Pepperstone logo
Pepperstone logo
  • English (UK)
  • Ways to trade

    Pricing

    Trading accounts

    Trading hours

    24-hour trading

    Spread betting vs CFDs

    Maintenance

  • Trading platforms

    Trading platforms

    TradingView

    MetaTrader 5

    MetaTrader 4

    Pepperstone platform

    cTrader

    Trading integrations

    Trading tools

  • Markets

    Markets to trade

    Forex

    Shares

    Indices

    Commodities

    Currency Indices

    Dividends for Index CFDs

    Dividends for Share CFDs

    CFD Forwards

    ETFs

  • Market analysis

    Market news

    Navigating Markets

    The Daily Fix

    Meet the Analysts

  • Learn to trade

    Trading guides

    CFD trading

    Spread betting

    Forex trading

    Commodity trading

    Stock trading

    Technical analysis`

    Day trading

    Scalping trading

    Candlestick patterns

    Upcoming IPOs

    Gold trading

    Oil trading

    Webinars

  • Partners

  • About us

  • Help and support

  • Professional

  • English (UK)

Analysis

Natural Gas
Commodities

Commodities flashing hot for traders

Chris Weston
Chris Weston
Head of Research
25 Jul 2023
Share
Commodities have become front of mind for traders, but it is a space that should now be firmly on the radar for any macro thinker too.

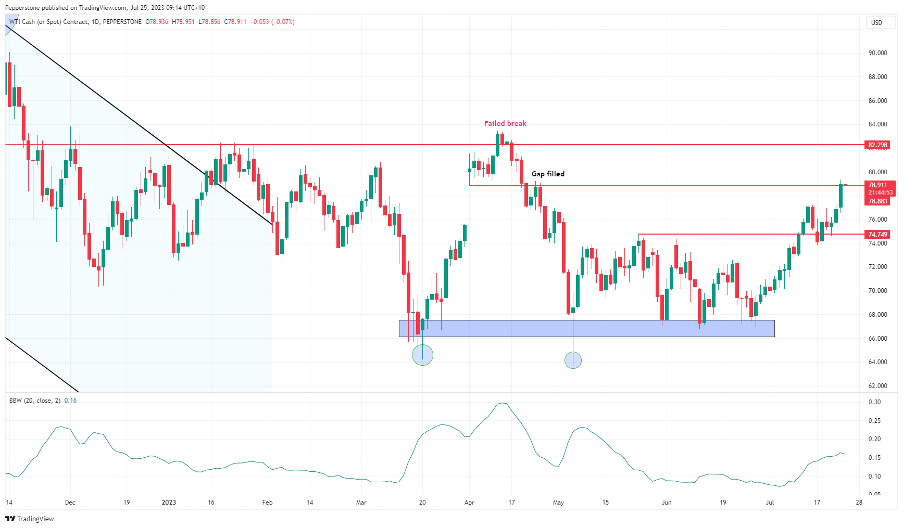
We’ve seen crude dominate the flows with WTI crude cash trading through the 200-day MA and into $79 – the momentum traders, on the higher timeframes, will be quietly confident of a push into the April highs of $83.46. Considering as the price has moved from $67 in June, it’s no surprise that US inflation expectations have started to rise.

Daily chart of WTI crude

Preview

We can measure inflation expectations through several channels, but one of the more common measures is in the bond market through ‘breakeven rates’ – we can see this on TradingView under the ticker ‘T5YIE’. This measures how inflation is expected to average over a specific duration – in this case over 5 years.

We also see gasoline pushing into $2.95 and higher for a sixth consecutive day. This is one that might be getting a touch too hot and could get attention from the mean reversion players. However, there is good underlying momentum, so if looking to get aggressive and play for a reversion to a mean, taking the timeframes into 30-minute charts seems prudent.

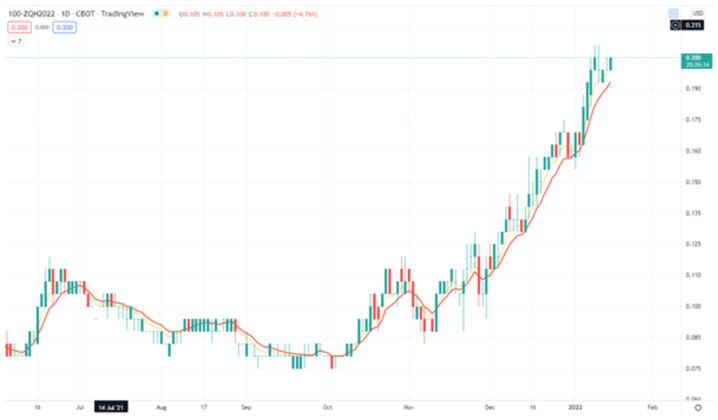
Nat Gas needs close attention – the global household could really do with Nat Gas staying subdued, but the set-up on the daily is ominous and offers a rising probability that a big move is coming. We see that price has held a $2.85 to $1.90 for 127 bars, and we see a true Bollinger band squeeze.

Preview

Momentum and trend moves start with breakouts, and as any trend-follower will attest to, many breakouts fail. So, you must be in it to win it, and while you typically get lower strike rates, the trend-follower hunts outlier moves within a distribution. This means holding in the hope of a 5 to 10R trade. Nat Gas – while it is often a high-octane ride - has the set-up that could do that.

We revert to the ag space and see wheat up 8%, albeit driven by a different set of news flow. Price has closed on highs of the daily bar, so the buyers have been in control to the bitter end. When we consider the distribution for the price, this type of close is thematic of future higher levels.

We also see cotton, corn, OJ, soybeans, cocoa, soymeal, and Oats all either trending strongly with a good rate of change (ROC) or near 52-week highs. There are signs of divergence in play – see oats as an example – and for those in longs, having a systematic stop in place that trails price will serve you well.

Again, moves across the commodity spectrum need monitoring, not just because it offers an opportunity for trend and momentum-focused traders, but because there is a macro consideration that could see volatility rise – if goods prices start to rise then it could be new news that central banks need to react to. Naturally, in a slowing demand environment, one suspect's commodity prices shouldn’t kick up too far, but perhaps they were mispriced and reverting to a fair value.


Related articles

Daily Fix: Five reasons why 109.33 is key for USDJPY

Daily Fix: Five reasons why 109.33 is key for USDJPY

The Daily Fix: Using volatility as a central guide in trading

The Daily Fix: Using volatility as a central guide in trading

VIX
Trading views – is the rates market signalling better times ahead for the USD?

Trading views – is the rates market signalling better times ahead for the USD?

USD
FOMC
Market Events
Banxico alert – is a lasting USDMXN trend change incoming?

Banxico alert – is a lasting USDMXN trend change incoming?

MXN
LATAM
USD

The material provided here has not been prepared in accordance with legal requirements designed to promote the independence of investment research and as such is considered to be a marketing communication. Whilst it is not subject to any prohibition on dealing ahead of the dissemination of investment research we will not seek to take any advantage before providing it to our clients.

Pepperstone doesn’t represent that the material provided here is accurate, current or complete, and therefore shouldn’t be relied upon as such. The information, whether from a third party or not, isn’t to be considered as a recommendation; or an offer to buy or sell; or the solicitation of an offer to buy or sell any security, financial product or instrument; or to participate in any particular trading strategy. It does not take into account readers’ financial situation or investment objectives. We advise any readers of this content to seek their own advice. Without the approval of Pepperstone, reproduction or redistribution of this information isn’t permitted.

Other Sites

  • The Trade Off
  • Partners
  • Group
  • Careers

Ways to trade

  • Pricing
  • Trading accounts
  • Pro
  • Trading hours

Platforms

  • Trading Platforms
  • Trading tools

Markets and Symbols

  • Forex
  • Shares
  • ETFs
  • Indicies
  • Commodities
  • Currency indicies
  • CFD forwards

Analysis

  • Navigating Markets
  • The Daily Fix
  • Pepperstone pulse
  • Meet Our Analysts

Learn-to-trade

  • Trading guides
  • Videos
  • Webinars
Pepperstone logo
support@pepperstone.com
+442038074724
70 Gracechurch St
London EC3V 0HR
United Kingdom
  • Legal documents
  • Privacy policy
  • Website terms and conditions
  • Cookie policy

© 2025 Pepperstone Limited 
Company Number 08965105 | Financial Conduct Authority Firm Registration Number 684312

Risk warning: Spread bets and CFDs are complex instruments and come with a high risk of losing money rapidly due to leverage. 74.8% of retail investor accounts lose money when trading spread bets and CFDs with this provider. You should consider whether you understand how spread bets and CFDs work and whether you can afford to take the high risk of losing your money.

Trading derivatives is risky. It isn't suitable for everyone and, in the case of Professional clients, you could lose substantially more than your initial investment. You don't own or have rights in the underlying assets. Past performance is no indication of future performance and tax laws are subject to change. The information on this website is general in nature and doesn't take into account your or your client's personal objectives, financial circumstances, or needs. Please read our legal documents and ensure you fully understand the risks before you make any trading decisions. We encourage you to seek independent advice.

Pepperstone Limited is a limited company registered in England & Wales under Company Number 08965105 and is authorised and regulated by the Financial Conduct Authority (Registration Number 684312). Registered office: 70 Gracechurch Street, London EC3V 0HR, United Kingdom.

The information on this site is not intended for residents of Belgium or the United States, or use by any person in any country or jurisdiction where such distribution or use would be contrary to local law or regulation.