Understanding support & resistance levels in trading
Support and resistance are key concepts in technical analysis. They refer to price levels acting as barriers, guiding market direction. These levels help traders make informed decisions on entry/exit points.
Identifying support and resistance levels
Support and resistance levels are often identified through various methods, ranging from simple price observation to more complex technical analysis tools. The most common way is by looking at historical price levels where the price has repeatedly reversed direction. These levels are easy to spot on price charts as horizontal lines marking areas where the price has bounced or been rejected several times:
Resistance: A price level on a chart signified with a horizontal trend line that identifies a high probability area where sellers are located based on prior behaviour.
Support: A price level on a chart signified by a horizontal trend line that identifies a high probability area where buyers are located based on prior behaviour.
Be aware that trend lines identify ZONES of support and resistance as opposed to exact prices.
Using historical price data
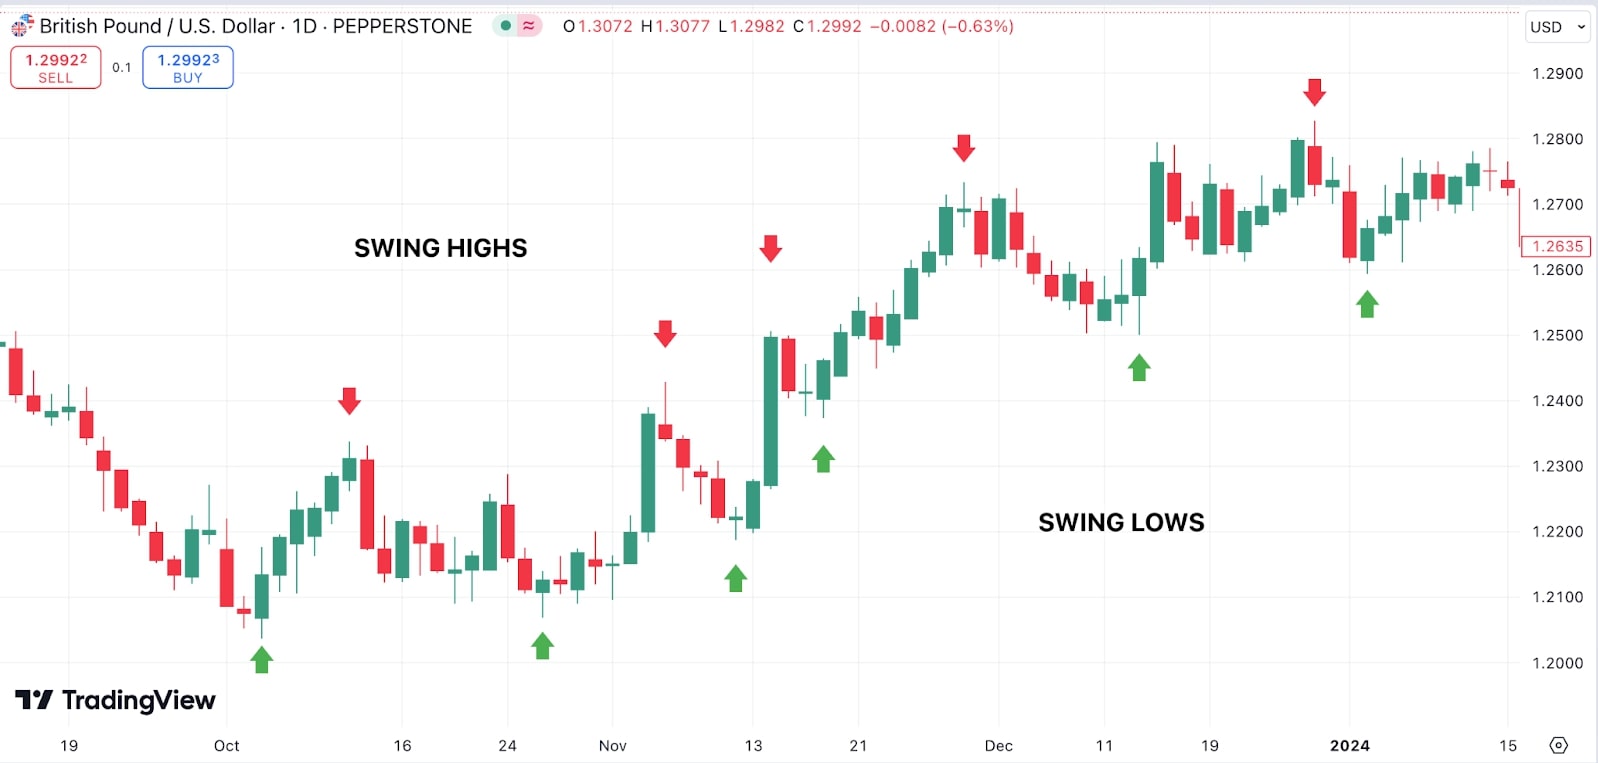
A reliable way to identify support and resistance is to analyse historical price data. Looking at past price actions on a chart gives traders a sense of where the market has faced significant obstacles in the past. For example, previous swing highs and lows, closing prices, and psychological levels like round numbers can all act as potential support and resistance points. This historical context helps traders predict future price movements, providing critical insights for developing a trading plan.
Swing highs and swing lows are key points on a price chart that indicate areas of resistance and support.
Source: Tradingview
A swing high occurs when the price peaks before pulling back, forming a high point surrounded by lower highs on either side.
A swing low happens when the price bottoms out before bouncing back, creating a low point surrounded by higher lows.
Applying technical indicators
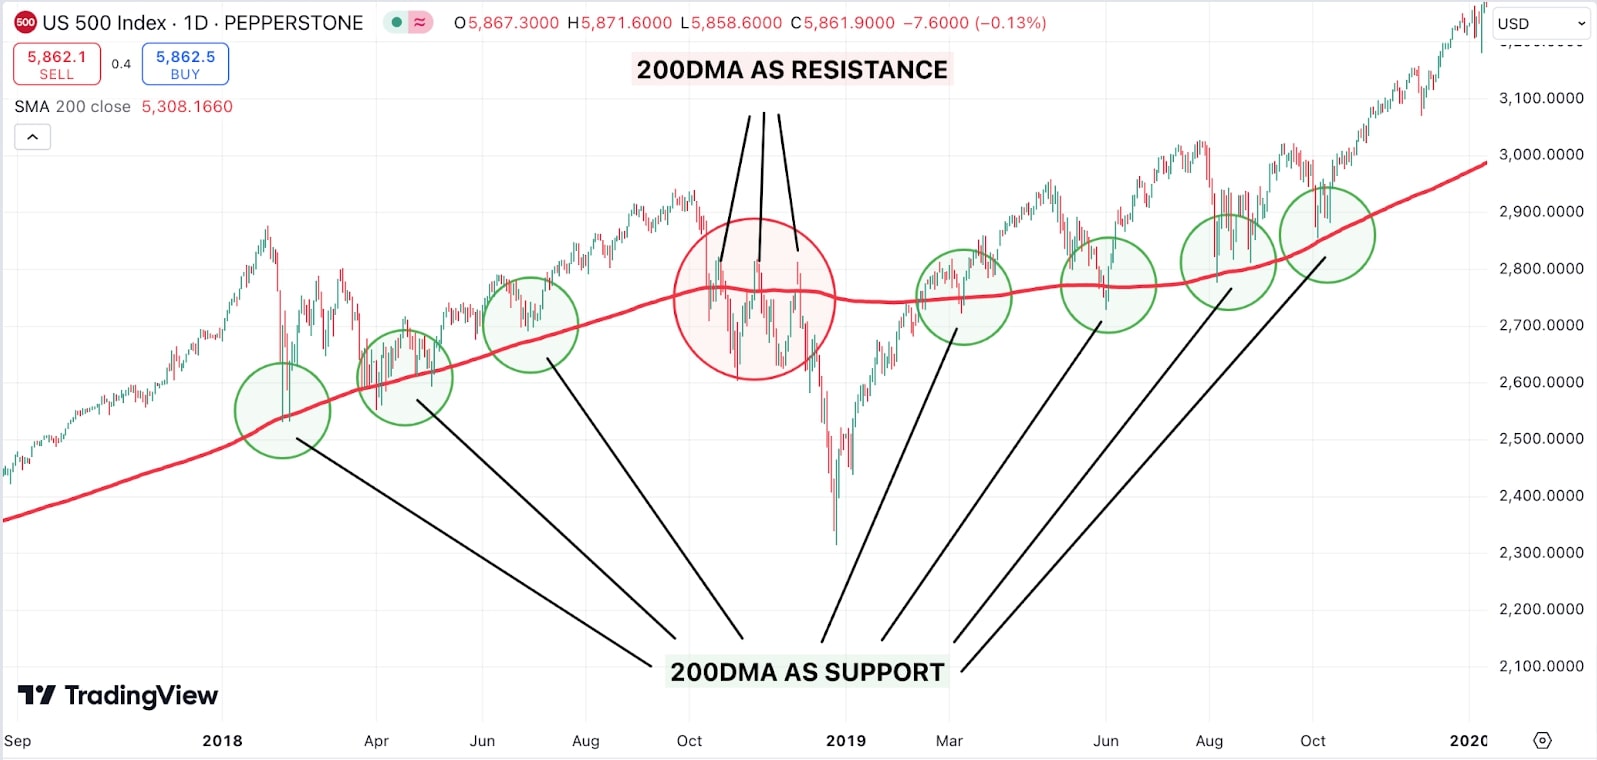
While historical price data offers valuable insights, technical indicators can provide additional confirmation of support and resistance levels. Moving averages are one such indicator commonly used in conjunction with support and resistance. When a price crosses a long-term moving average, it often signals a change in trend. For example, if an asset’s price rises above its 200-day moving average, that level can become a support zone.
Other indicators like the Relative Strength Index (RSI) can help identify overbought or oversold conditions, offering further insights into potential support and resistance levels. When RSI is above 70, the asset is considered overbought, potentially signalling a reversal near resistance. When RSI drops below 30, it is seen as oversold, indicating a potential reversal near support. When a stock price reaches these extreme RSI levels, it often indicates that a reversal is imminent, possibly near key support or resistance points.
Utilising trendlines
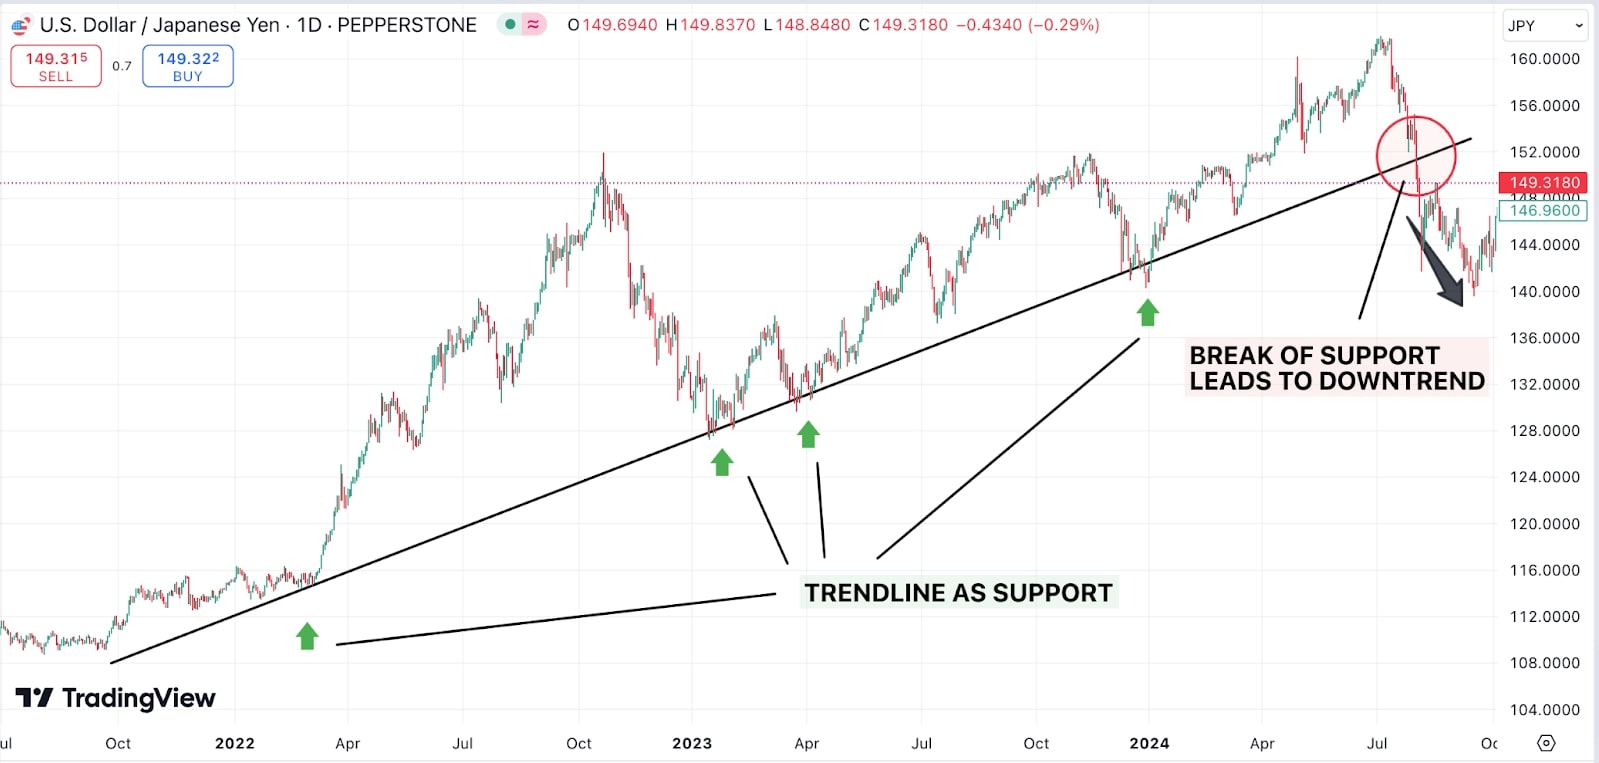
Trendlines are diagonal lines drawn on a price chart, connecting a series of rising lows (support) or declining highs (resistance). These lines provide a visual representation of a trend's momentum.
For example, in an uptrend, each successive low should be higher than the previous one, forming an ascending trendline that acts as support:
Source: Tradingview
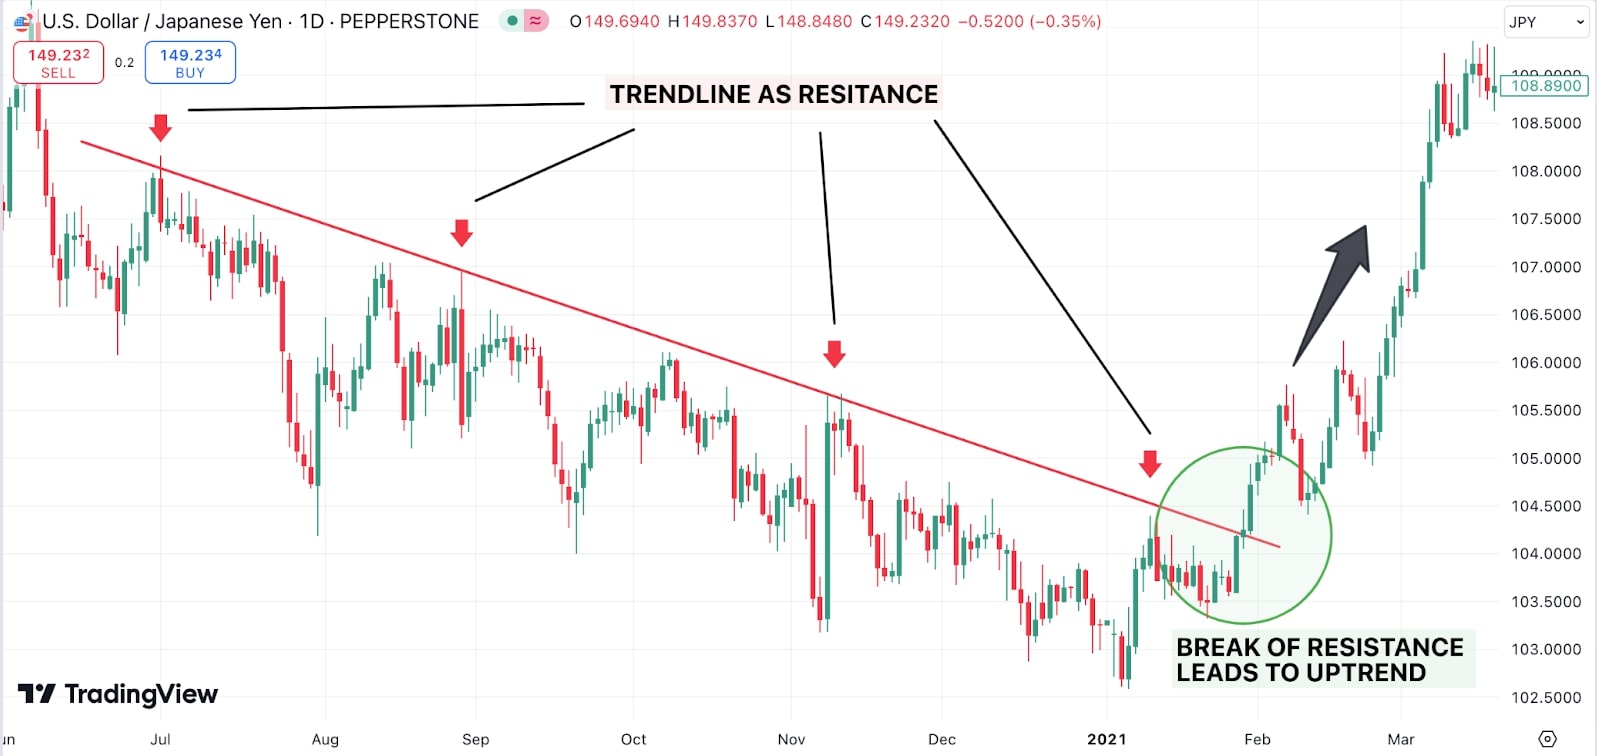
Conversely, in a downtrend, the highs form a descending trendline that acts as resistance:
Source: Tradingview
Trendlines help traders pinpoint where price action may find support or resistance, contributing to a well-rounded trading plan.
Market sentiment and behaviour
When market participants believe a certain level is significant, their collective actions reinforce that level as either support or resistance. For instance, if traders perceive that a stock price is undervalued at a certain level, their buying activity will cause the price to bounce off that level, reinforcing it as support. Similarly, if traders see a price as too high, they will start selling, strengthening the resistance.
Price action analysis involves reading charts without relying on indicators, and can help traders assess market sentiment and behaviour near support and resistance levels. Traders can use candlestick patterns and chart formations, such as double tops or bottoms (see chart below), to gauge potential reversals.
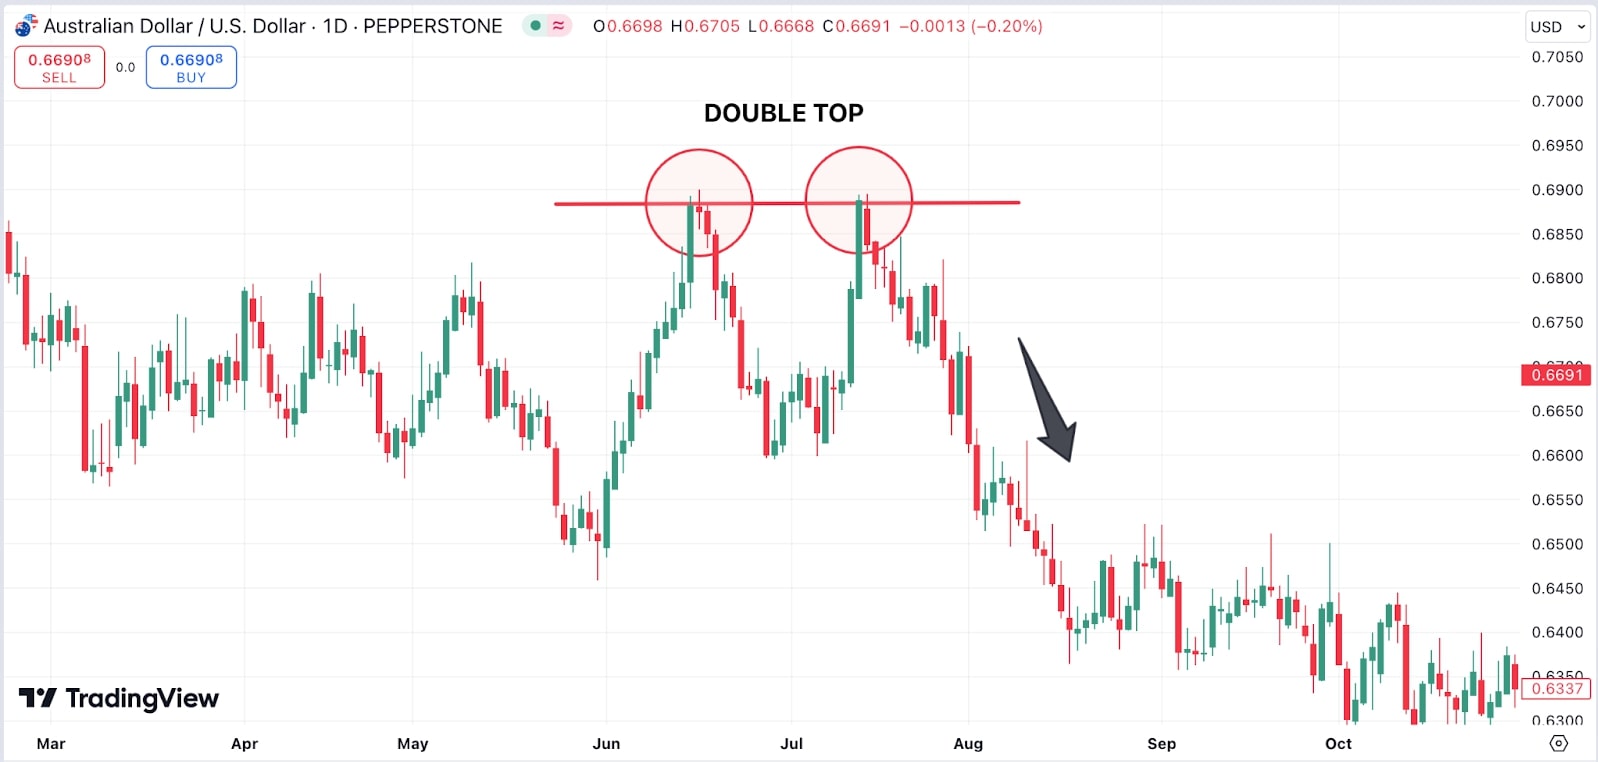
Source: Tradingview
Role reversal phenomenon
One aspect of support and resistance is the role reversal phenomenon. When the price breaks through a key support or resistance level, it often switches roles. Former support becomes new resistance, and vice versa (chart below). This happens because traders who missed the initial move will jump in once the level is breached, creating the opposite effect.
For example, if a stock breaks below a significant support level, it might later retest that level from below, but this time it acts as resistance. Understanding this phenomenon helps traders anticipate potential entry points and adds depth to a trading strategy.
Source: Tradingview
Bounce trading strategy
The bounce trading strategy involves identifying support or resistance levels and waiting for the price to "bounce" off these levels before entering a trade. For instance, a trader might wait for a stock price to approach a known support level, expecting it to reverse direction. When the stock shows signs of bouncing off that level, a trader can enter a trade in the direction of the bounce.
This strategy allows traders to enter trades with a favourable risk-reward ratio, as they place their stop-loss orders just beyond the support or resistance level. Price action and candlestick patterns are often used in conjunction with the bounce strategy to confirm the reversal.
Source: Tradingview
Break trading strategy
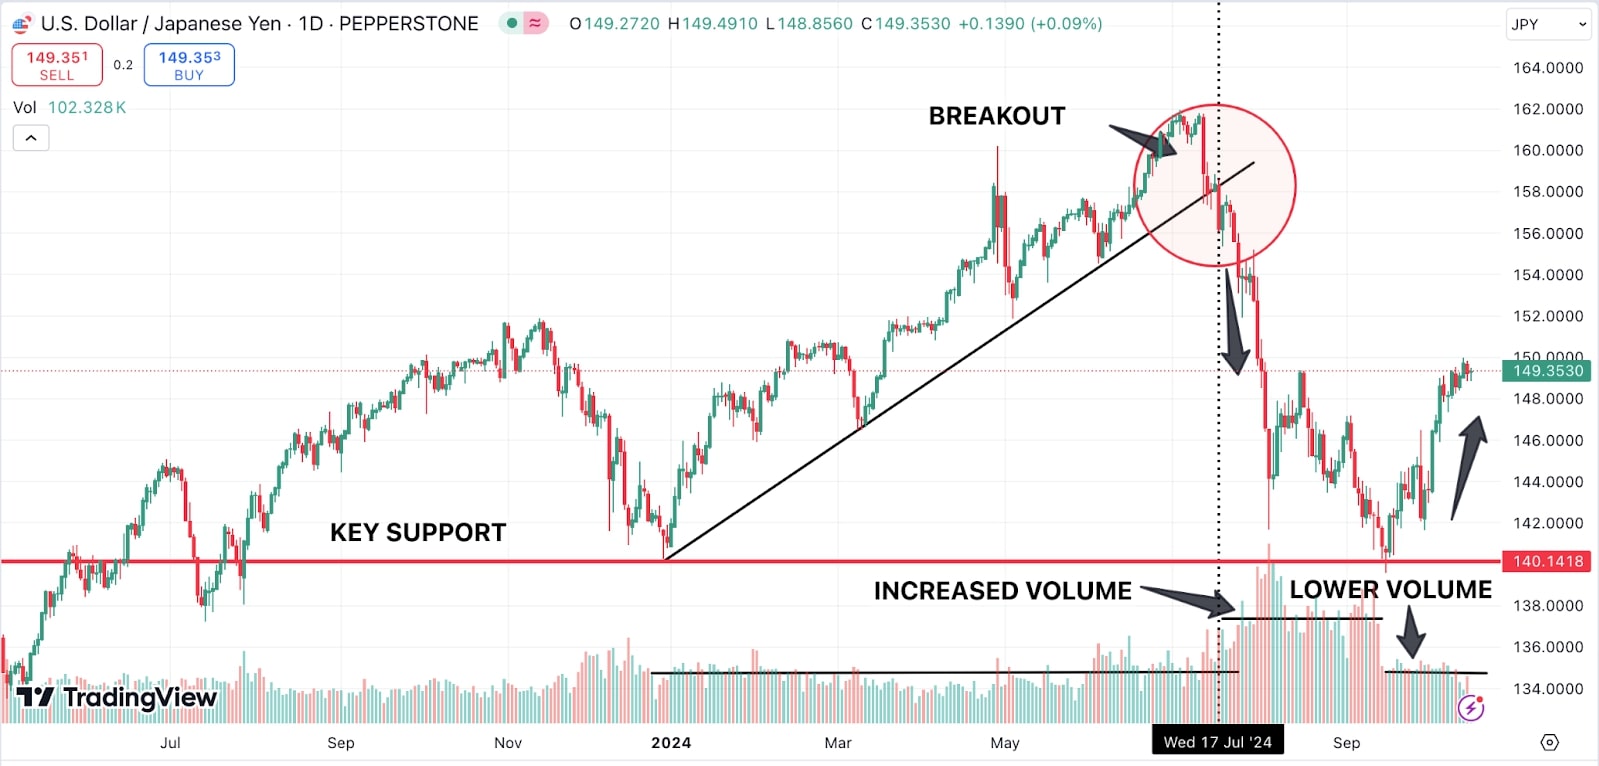
Another popular method is the break trading strategy. This approach involves waiting for the price to break through a significant support or resistance level and then entering a trade in the direction of the breakout. Traders often look for increased volume during breakouts as a sign that the move is likely to be sustained.
For example, the USD/JPY pair (chart above) had been steadily rising along an uptrend line from December 2023 to July 2024. Around mid-July 2024, the pair broke below the trendline, which was a key 8 month uptrend support level. The breakout was confirmed by a noticeable increase in trading volume, signalling strong bearish momentum. Once the support was breached, the price dropped sharply. Traders looking for breakouts would have entered sell positions when the trendline broke, using the volume spike as additional confirmation.
After the sharp decline following the breakout, the USD/JPY pair began to stabilise and recover as downside volume decreased (chart below). As price approached a key psychological level of 140.00 upside volume increased. This indicated that the selling pressure subsided, leading to consolidation. When volume fell, it signalled reduced participation from traders, which often coincides with stabilisation. The lack of strong selling momentum, combined with the decrease in volume, allowed the pair to reverse some of its losses and move back toward higher levels. This type of volume behaviour often signals exhaustion in the prior trend.
Source: Tradingview
Advantages of using support and resistance
Support and resistance trading offers several advantages. First, it provides clear entry and exit points based on objective price levels. These levels are easily identifiable on a price chart, allowing traders to create a structured trading plan. Additionally, support and resistance strategies can be applied across different time frames, making them suitable for both short-term trading and long-term investing.
Support and resistance levels also provide a visual way to gauge market sentiment. When combined with technical indicators like moving averages or RSI, they offer a comprehensive picture of market conditions.
Disadvantages of relying on support and resistance
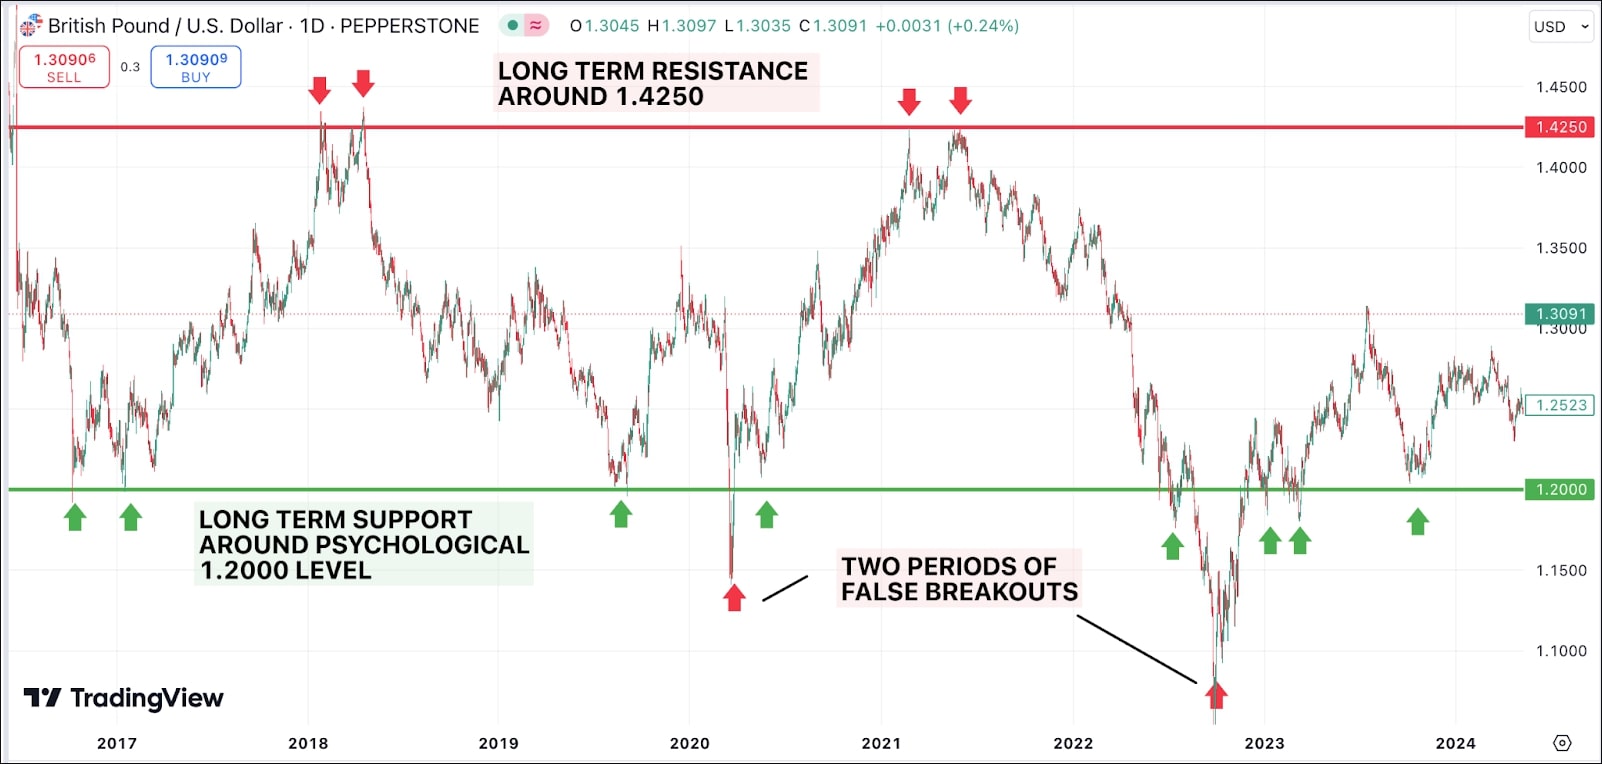
Trading solely based on support and resistance has its limitations. Financial markets are unpredictable, and false breakouts or unexpected market events can cause price levels to fail. Relying too heavily on historical levels may lead to missed opportunities if the market suddenly shifts.
Moreover, support and resistance levels are not always precise. Price may hover around a support or resistance zone for some time, creating uncertainty about whether the level will hold. As a result, traders should consider complementing support and resistance analysis with other technical tools.
Complementing support and resistance with other indicators
The following tools can enhance decision-making by providing more confirmation signals:
- Moving Averages: Identify trends and potential support or resistance levels as the price interacts with key moving averages (e.g., 50-day or 200-day).
- Relative Strength Index (RSI): Helps determine overbought or oversold conditions near support or resistance, indicating potential reversals.
- Bollinger Bands: When the price approaches the upper band, it may indicate a resistance level, while the lower band can suggest support. A price move outside the bands may signal overbought or oversold conditions, enhancing the likelihood of reversals at these key levels.
- Volume: To confirm the strength of a support or resistance level, traders should observe volume. Stronger volume typically accompanies significant breaks or bounces off key levels, signalling a more reliable move. Conversely, lower volume during a price move suggests weaker market conviction, indicating a potential false breakout or bounce.
Furthermore, incorporating fundamental analysis alongside technical analysis can provide a more comprehensive view of the market. By understanding how economic events, interest rates, and earnings reports affect asset prices, traders can develop more informed strategies.
Backtesting support and resistance levels
Backtesting is a crucial part of any trading plan. By backtesting support and resistance levels, traders can assess how these levels have performed in the past and evaluate the effectiveness of their strategies.
Here’s a 5 step process to consider:
- Identify Key Levels: On historical charts, mark obvious support and resistance areas where price has reversed multiple times.
- Observe Price Reaction: Check how price behaved around these levels (bounces, breaks, or false breakouts).
- Use Multiple Timeframes: Analyse the levels on both short-term and long-term charts for consistency.
- Apply Indicators: Use volume and technical indicators like RSI or moving averages to confirm strength or weakness at these levels.
- Record Findings: Track how often price respected or broke past these levels.
What tools are available to identify support & resistance
The following platforms have charting software which can be used for identifying support and resistance levels:
- TradingView: Offers customisable charts with real-time data, multiple indicators, and the ability to draw trendlines for identifying support and resistance.
- MetaTrader 4/5: Provides advanced charting tools and custom indicators.
- StockCharts: Offers free basic charting with customisable tools to identify key price levels.
Final thoughts on support & resistance levels
Incorporating support and resistance into a trading plan is an essential foundation for all traders. These key levels help identify where prices may stall, reverse, or continue a trend, guiding trade entries and exits. By combining them with other technical indicators and fundamental analysis, traders can enhance accuracy and confidence. However, it’s crucial to practice patience and avoid over-reliance on any single method. Consistently reviewing market behaviour and refining strategy will help develop a well-rounded, adaptable trading approach for long-term success.
The material provided here has not been prepared in accordance with legal requirements designed to promote the independence of investment research and as such is considered to be a marketing communication. Whilst it is not subject to any prohibition on dealing ahead of the dissemination of investment research we will not seek to take any advantage before providing it to our clients.
Pepperstone doesn’t represent that the material provided here is accurate, current or complete, and therefore shouldn’t be relied upon as such. The information, whether from a third party or not, isn’t to be considered as a recommendation; or an offer to buy or sell; or the solicitation of an offer to buy or sell any security, financial product or instrument; or to participate in any particular trading strategy. It does not take into account readers’ financial situation or investment objectives. We advise any readers of this content to seek their own advice. Without the approval of Pepperstone, reproduction or redistribution of this information isn’t permitted.