How to trade the FTSE 100
Trading the FTSE 100 offers opportunities for short-term traders and long-term investors.

By understanding the index, monitoring key factors, and using disciplined strategies, traders can succeed with CFDs, spread betting or ETFs, backed by analysis and risk management.
What is the FTSE 100?
The FTSE 100 is a price index reflecting the price performance of the 100 largest companies listed on the London Stock Exchange. It does not account for dividends or other income distributions. However, there is also a total return version of the FTSE 100, which includes the reinvestment of dividends. Traders and investors can choose between the price index for monitoring price movements and the total return version for a more comprehensive measure of investment performance.
How is the FTSE 100 calculated?
Understanding how the FTSE 100 is calculated is crucial for trading because it helps traders evaluate index movements and anticipate potential impacts of corporate actions, such as dividend payments, stock splits, or changes in market capitalisation. The FTSE 100 is calculated using a free-float market capitalisation-weighted methodology:
- Market capitalisation: Each company’s market cap is determined by multiplying its share price by the number of shares available for public trading (free float). This excludes shares held by insiders, governments, or other entities with restricted trading.
- Weighting: Companies with larger market capitalisations have a higher weighting in the index, meaning their price movements have a greater influence on the FTSE 100.
- Index value: The index value is calculated by dividing the total market capitalisation of all constituent companies by a fixed divisor. This divisor is adjusted for corporate actions (e.g., stock splits, mergers) to ensure continuity in the index value.
- Updates: The FTSE 100 is reviewed quarterly to ensure it accurately represents the top 100 companies listed on the London Stock Exchange. The index is reviewed on a quarterly basis in March, June, September and December.
How do weightings have an Impact on the Index?
Understanding how many points a stock contributes to an index, like the FTSE 100, is crucial when evaluating earnings reactions and dividends, as it helps gauge the impact of individual stocks on the broader index:
Disproportionate influence of large-cap stocks
Stocks with higher weightings (e.g., Shell or AstraZeneca) have a larger influence on the index's movement. If a heavily weighted stock reports strong earnings, it can push the entire index up. Conversely, disappointing earnings from the same stock can drag the index down even if smaller stocks perform well. For example, if Shell’s weighting is 8% and its price falls by 5%, it would contribute a 0.4% drop in the FTSE 100 index (assuming the other 99 stocks remain unchanged).
Knowing this helps traders anticipate how earnings surprise or misses from large-cap stocks might affect the overall index, allowing for informed trading decisions.
What impact do dividends have on the FTSE?
Dividends directly affect the total return index but can also influence the price index when a stock goes ex-dividend. A large-cap stock paying a significant dividend will cause a noticeable drop in its price on the ex-dividend date, which can reduce the index level temporarily.
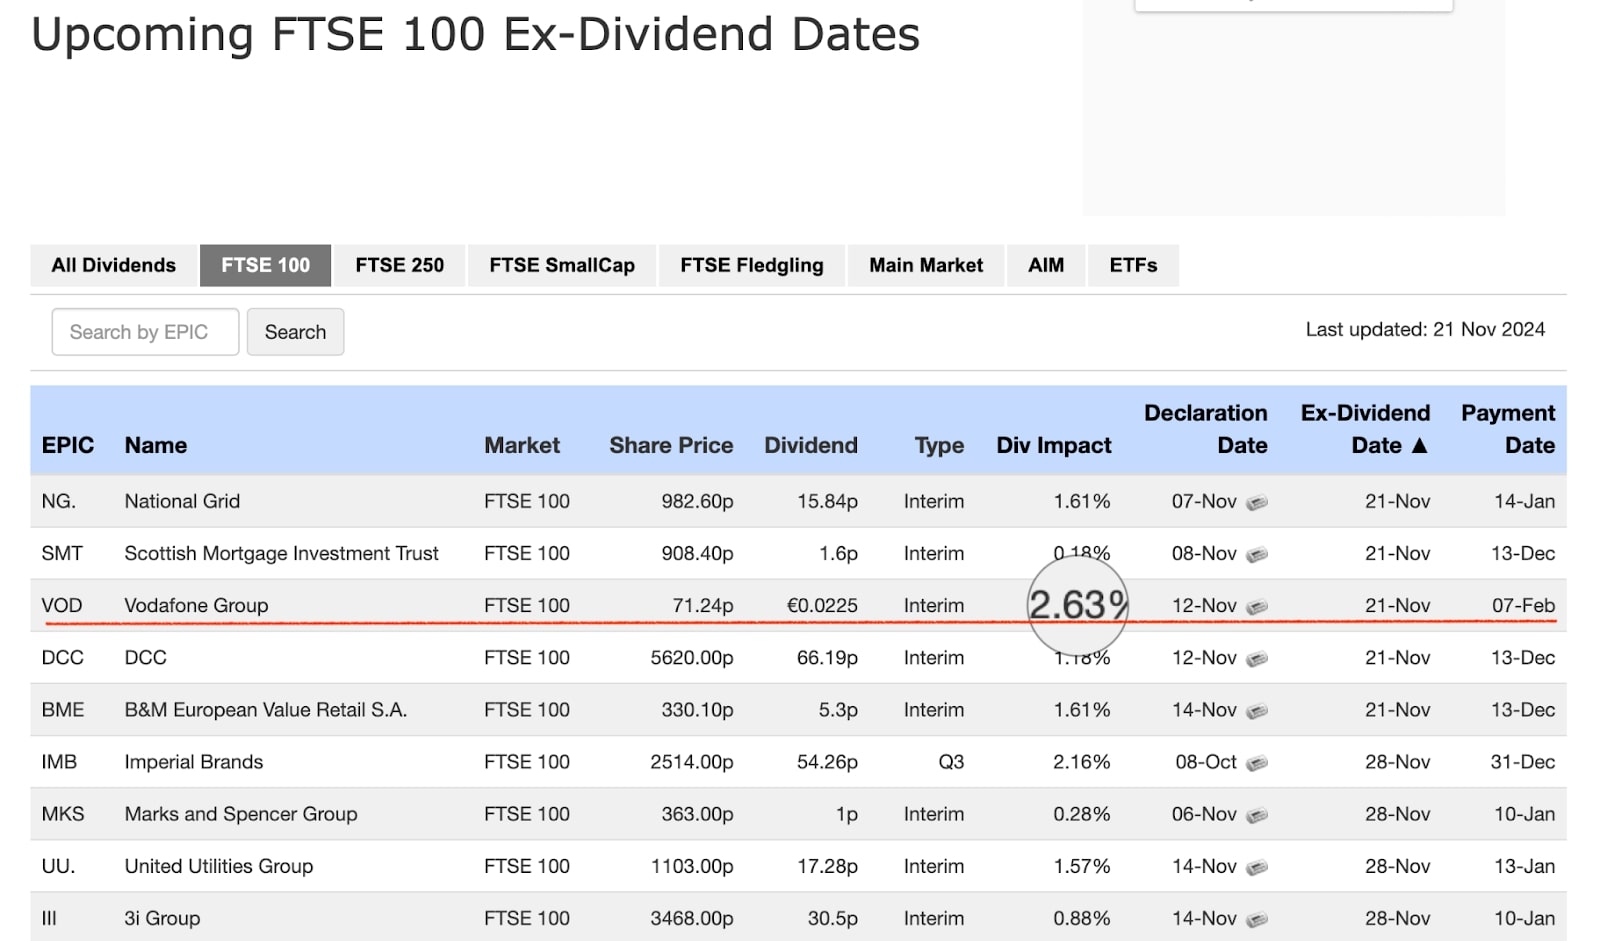
Example calculation (using ex-dividend dates below):
Traders can anticipate short-term movements in the index by tracking dividend schedules for heavily weighted stocks.

Source: https://www.dividenddata.co.uk/dividend-payment-dates.py?m=ftse100
Hypothetically, assuming an index value of 8,400, if two large weighting stocks like British American Tobacco and Vodafone go ex-dividend on the same day, the combined impact on the FTSE 100 would be a drop of approximately 6.21 points. This highlights how dividend payouts from heavyweight stocks can significantly influence the index:
Scenario overview:
British American Tobacco
Weight: 2.68% (0.0268).
Dividend Impact: 2.02% (0.0202).
Vodafone
Weight: 0.8% (0.008).
Dividend Impact: 2.63% (0.0263).
FTSE 100 Index Value: 8,400 (example).
Calculations
1. British American Tobacco:
FTSE 100 Impact (BAT) = 0.0268 × 0.0202 × 8400 = 4.45 points
2. Vodafone:
FTSE 100 Impact (VOD) = 0.008 × 0.0263 × 8400 = 1.76 points
Total Combined Impact:
Total FTSE 100 Impact = 4.45 + 1.76 = 6.21 points
Other factors influencing FTSE 100 price movements
The FTSE 100’s price is driven by multiple factors:
- Global economic data: Many FTSE 100 companies generate much of their revenue internationally, meaning global economic data can often outweigh domestic UK factors.
- Currency movements: A weaker British pound can boost the index, as it benefits multinational companies earning revenues in foreign currencies especially USD.
- Interest rates and inflation: Decisions from the Bank of England and inflation data can influence the market. The CPI including owner occupiers’ housing costs (CPIH) is the most widely followed inflation reading. CPIH is widely regarded as the most reliable gauge for policymakers, including the Bank of England, when assessing inflation trends to guide monetary policy decisions.
- Geopolitical events: Brexit, trade agreements, and other geopolitical events can create volatility.
Starting as a beginner
For beginners, trading the FTSE 100 starts with selecting a broker that offers access to the index. Beginners should:
- Learn the basics: Understand index trading, leverage, and risk management.
- Use a demo account: Most brokers offer demo accounts for practice without risking real money.
- Set realistic goals: Focus on building a consistent strategy rather than aiming for quick profits.
FTSE 100 trading hours
The FTSE 100 trading hours in UTC are:
Standard trading hours (Monday to Friday): 08:00 to 16:30 UTC
Pre-market auction period (opening auction): 07:50 to 08:00 UTC
Orders can be placed and modified, but no trades occur until the market opens.
Closing auction period: 16:30 to 16:35 UTC
Orders can be placed to finalise closing prices.
Out-of-hours trading: Some brokers may offer extended hours through derivative products like CFDs or spread betting, but these are outside the official exchange hours.
Trading strategies for the FTSE 100
Trading the FTSE 100 requires understanding its unique characteristics, such as its composition of large blue-chip companies and sensitivity to global economic factors. The best strategies focus on capitalising on market trends, key levels, and news events:
Trend following
What: This strategy involves trading in the direction of the prevailing market trend, either bullish or bearish.
Why: The FTSE 100 often exhibits sustained trends due to its heavy weighting in global sectors like energy, financials, and healthcare.
How: Use the 50- and 200-day moving averages to identify trends. A crossover of the 50-day above the 200-day can indicate the beginning of a bullish trend (golden cross), while the opposite indicates a bearish trend (death cross).co.uk/dividend-payment-dates.py?m=ftse100
_lines.jpg)
Range Trading
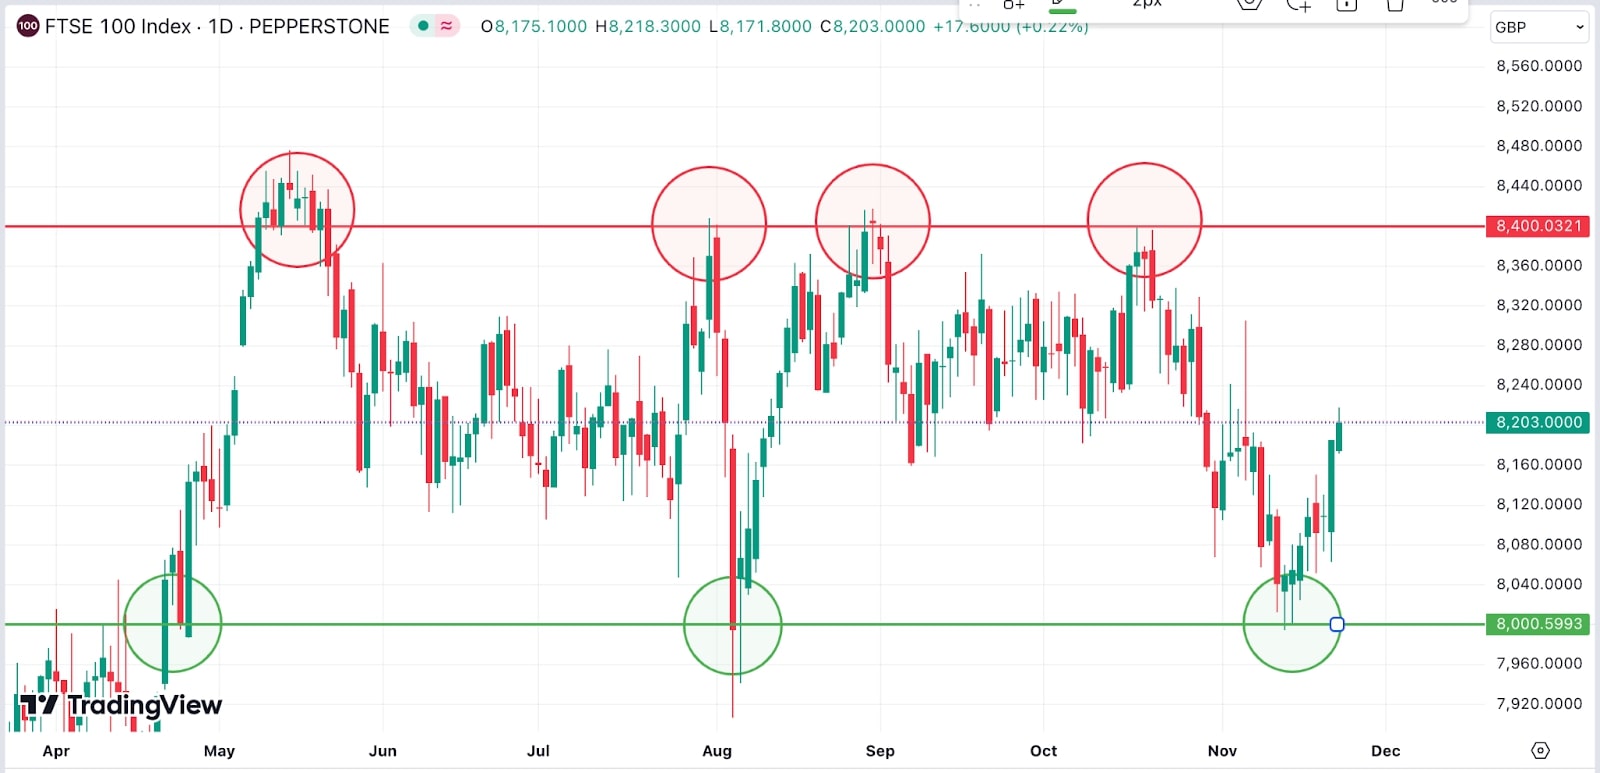
What: Range trading involves identifying when the FTSE 100 is moving sideways within a defined price range and profiting from repeated bounces between support and resistance levels.
Why: The FTSE 100 often trades within tight ranges during periods of market uncertainty, as it reflects a mix of defensive and cyclical sectors.
How: Identify a trading range (e.g., 8,000 to 8,400 as per the chart below) and use technical indicators like RSI or Bollinger Bands to time entries. Buy near support and sell near resistance, while using stop-loss orders just outside the range to manage risk.

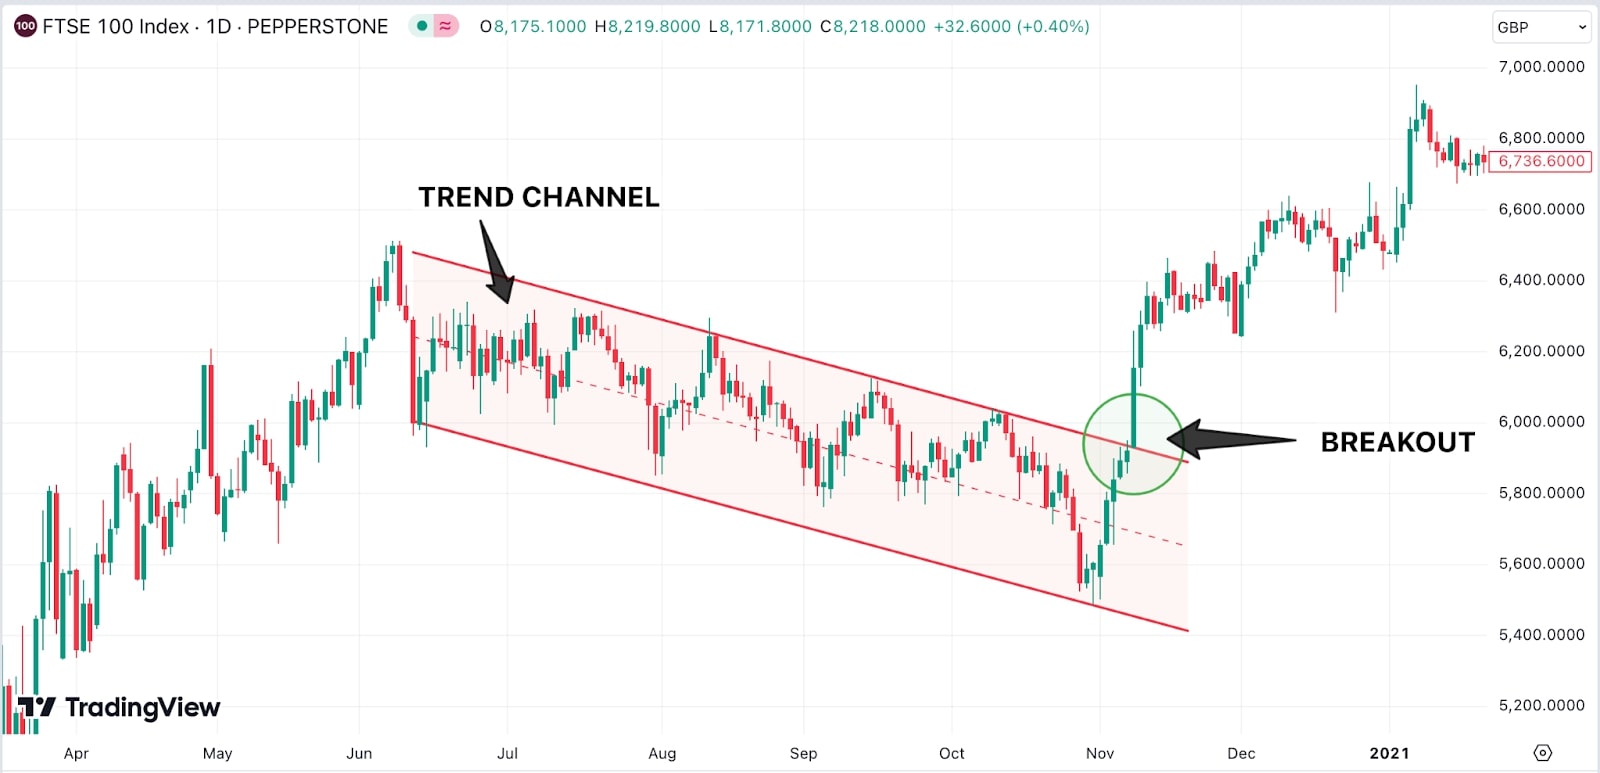
What: This strategy focuses on trading the FTSE 100 when it breaks through key support or resistance levels.
Why: The FTSE 100 often consolidates before breaking out due to earnings releases or major economic events. Breakouts often signal the beginning of a strong directional move.
How: Identify trend channel levels using price charts. Place buy orders above resistance or sell orders below support. Use tight stop-losses to manage risk if the breakout fails.

Analysing FTSE 100 Trends
To analyse the FTSE 100 effectively, traders use a combination of technical, fundamental, sentiment, and volume analysis. These methods help identify trends, predict price movements, and assess market sentiment to make informed trading decisions. Here's how each approach works:
Technical analysis: Study charts, patterns, and indicators like moving averages, RSI, and MACD to identify trends and price movements.
Fundamental analysis: Focus on economic data, earnings reports, and geopolitical events that affect the FTSE 100.
Sentiment analysis: Gauge market mood through news, social media, and sentiment indicators like the VIX.
Volume analysis: Confirm trends by analysing trading volume; higher volume suggests stronger price movements.
Cross asset analysis: Monitor related markets, such as GBP movements and commodity prices, to assess their impact on the FTSE 100.
Should I trade FTSE100 index CFDs or invest in ETFs?
As an index is essentially a measure of its component stocks, it can’t be purchased in the same way as a stock or a commodity. However, there are ways to get exposure to the FTSE 100’s price movements.
- CFDs: These are more suited to short-term trading, where profit can be made from price movements without owning the underlying asset. This means traders can go long or short, potentially benefiting from both rising and falling markets. They are leveraged products, offering the ability to control larger positions with a smaller initial outlay. This amplifies the potential profit but also the potential loss, as both will be based on the full value of the position.
- ETFs: ETFs are investment funds that track the performance of a group of stocks or a whole index such as the FTSE 100. They provide a vehicle to invest in the index over the long term, often reinvesting dividends automatically and therefore compounding returns over time. ETFs may be suitable for investors looking for passive, long-term exposure to the index without using leverage – meaning you’d put down the full value of the position upfront, with no amplification of profits or losses.
ETFs can also be traded on as a CFD. Pepperstone, for example, offers more than 100 ETFs that track the performance of sectors or whole countries. If you choose to trade CFDs on an ETF, you’ll be speculating on its price movements rather than buying it outright – and will be trading with leverage, which amplifies profits or losses.
How does trading the FTSE 100 with leverage work?
Leverage gives you exposure to the full value of a trade with a small initial deposit, known as margin. Your provider loans you the rest of the funds to cover the full position. The ratio of your total exposure to your margin is called the leverage ratio, for example 1:5 or 1:20.
Say, for example, you want to trade two contracts on the FTSE 100 at 8000, and the contract size is £2. Your full exposure is therefore £32,000 (a buy price of 8000 x 2 contracts x £2). If leverage is 1:20, this means your margin is 5% and so you’d put down a deposit of £1600. Your broker would put up the other £30,400 initially, enabling you to open a position 20 x greater than your initial outlay.
Leverage can magnify your potential profits and losses, as your profits and losses will be calculated on the full value of the position.
Day trading vs. swing trading
The choice between day trading and swing trading the FTSE 100 should be based on time availability, risk tolerance and trading style. Here are the main differences to consider:
Day trading
- Time frame: Positions are opened and closed within the same trading day, often within minutes or hours. Traders aim to profit from short-term price movements within the day.
- Approach: Day traders focus on high liquidity and volatility, using technical indicators and intraday chart patterns to enter and exit trades quickly.
- Example: A day trader might spot a breakout from a key support level during the opening session and take a position to capitalise on the price move before the close of the trading day.
Swing trading
- Time frame: Positions are held for several days to weeks, aiming to capture price swings or trends over a longer period than day trading.
- Approach: Swing traders use both technical analysis and fundamental factors, looking for trends or reversals in the market to take advantage of medium-term price movements.
- Example: A swing trader might enter a position when they believe the FTSE 100 is beginning an upward trend after a pullback, and hold the position until the trend shows signs of exhaustion.
Are there automated tools to help trade the FTSE100 Index?
There are several automated trading tools and platforms available for the FTSE 100, allowing traders to streamline their strategies. These tools can be broadly categorised into trading platforms, algorithmic trading systems and custom indicators and scripts:
Trading platforms with automation
Popular platforms like MetaTrader 4 (MT4), MetaTrader 5 (MT5), and cTrader, support automated trading through Expert Advisors (EAs) or custom scripts. Traders can use these to execute strategies automatically based on pre-set conditions. For example, an EA programmed to trade FTSE 100 breakouts could automatically enter trades when the index surpasses specific resistance levels.
Algorithmic trading systems
Traders with coding knowledge can develop algorithms on platforms like Python or connect to APIs provided by brokers. These systems can monitor the FTSE 100 and execute trades whenever the market is open.
Traders can leverage tools like TradingView for custom alert systems that integrate with broker platforms.
These tools help reduce emotional decision-making, improve consistency, and provide flexibility, but users must ensure strategies are backtested and closely monitored to mitigate risks.
Risks of trading the FTSE 100
Trading the FTSE 100 involves several risks, including the following:
- Market volatility: Price fluctuations driven by global events, sector-specific issues, or geopolitical tensions can lead to unexpected losses.
- Concentration risk: The index’s heavy weighting in sectors like energy and financials means shocks in these industries can disproportionately impact the broader index.
- Economic sensitivity: The FTSE 100 can react to UK and global economic data, such as inflation or GDP, which can create rapid, unpredictable price changes.
- Leverage risks: Trading CFDs or other leveraged instruments magnifies both gains and losses, increasing the risk of significant capital depletion.
- Dividend impact: Dividend adjustments, especially from large-cap stocks, can influence index pricing, affecting traders unaware of these movements.
Effective risk management and staying informed about market conditions are essential to mitigate these challenges.
How do I manage risk when trading the FTSE 100?
The FTSE 100 is a popular index for traders, but its movements can be influenced by global and domestic factors, making risk management essential. Here are key strategies to manage risk effectively:
- Use stop-loss and take-profit orders: Protect capital by setting a predefined level at which the trade will automatically close if the market moves against the position. Lock in gains by setting a target price where the trade will close when the market moves in the desired direction.
- Manage position sizes: Limit risk to 1-2% of an account balance per trade. For instance, if an account is £10,000, risk no more than £100-£200 on any single position.
- Use leverage cautiously: Leverage magnifies gains and losses. Regulated brokers in the UK and EU cap retail leverage for indices like the FTSE 100 at 1:20 (5% margin requirement). Use leverage conservatively to manage risks during volatile periods.
- Stay updated on market events: Monitor UK economic indicators like GDP, inflation, employment, and central bank decisions, as these heavily influence the FTSE 100. The FTSE is also impacted by global market trends and geopolitical events, so keep an eye on related markets.
- Manage volatility: Use tools like Bollinger Bands or Average True Range (ATR) to assess market volatility and adapt a strategy accordingly.
- Stick to a plan: Avoid impulsive decisions based on emotions or after losses. Maintain discipline and follow a trading plan.
- Use a demo account: Practice trading the FTSE 100 on a demo account to test strategies and refine risk management techniques without risking real money.
- Regularly review performance: Evaluate trades to identify patterns of success or failure. Adjust strategy based on data-driven insights.
Common mistakes to avoid when FTSE 100 Trading
There are several common mistakes that traders, especially beginners, should be mindful of to improve their chances of success:
- Ignoring risk management: Many traders fail to set proper stop-loss orders or position sizes. Without risk management, even small market movements can result in significant losses, especially when using leverage.
- Overtrading: Overtrading occurs when traders attempt to capitalise on every small price movement without a clear strategy. This often leads to excessive fees, emotional fatigue, and poor decision-making, particularly in volatile market conditions.
- Focusing too much on short-term movements: While day trading or short-term trading can be profitable, it's essential to avoid getting caught up in short-term market fluctuations. The FTSE 100 is influenced by both short-term news and long-term economic trends, so it's crucial to balance both perspectives.
- Lack of understanding of the index's composition: The FTSE 100 is heavily weighted toward specific sectors, such as financials, energy, and consumer goods. Traders may fail to understand how large-cap stocks in these sectors can disproportionately influence the overall index, leading to misinformed trades.
- Ignoring macro and microeconomic factors: Ignoring interest rates, inflation data, or political events can lead to trades that are out of sync with overall market conditions.
- Chasing losses: Some traders try to recover losses by increasing their trade size, hoping the market will turn in their favour. This strategy can lead to significant losses if the market continues to move unfavourably.
- Not having a defined trading plan: Trading without a clear plan or strategy is a major mistake. Successful traders rely on defined entry, exit, and risk management rules that are based on technical analysis or fundamental trends.
- Over reliance on leverage: Using excessive leverage can amplify both profits and losses. While the FTSE 100 may seem like a stable index, leveraging too much can lead to substantial losses if the market moves against the trader’s position.
- Emotional trading: Emotional decision-making, driven by fear or greed, is one of the most common mistakes in trading. Traders often panic during market corrections or become overly confident during rallies, leading to impulsive decisions that can hurt their overall performance.
- Failing to adapt to changing market conditions: The FTSE 100 is influenced by a wide range of factors, and market conditions can change quickly. Traders may make the mistake of sticking too rigidly to a particular strategy or trade in conditions that no longer align with their analysis.
The material provided here has not been prepared in accordance with legal requirements designed to promote the independence of investment research and as such is considered to be a marketing communication. Whilst it is not subject to any prohibition on dealing ahead of the dissemination of investment research we will not seek to take any advantage before providing it to our clients. Pepperstone doesn’t represent that the material provided here is accurate, current or complete, and therefore shouldn’t be relied upon as such. The information, whether from a third party or not, isn’t to be considered as a recommendation; or an offer to buy or sell; or the solicitation of an offer to buy or sell any security, financial product or instrument; or to participate in any particular trading strategy. It does not take into account readers’ financial situation or investment objectives. We advise any readers of this content to seek their own