Using Bollinger Bands® in your trading strategy
We recently hosted some of the best traders and brightest minds in macro strategy at Pepperstone Talks in London.
One of the highlights was a presentation from John Bollinger, the creator of the Bollinger Bands, one of the most popular trading tools used by both retail and institutional traders alike. There was so much great intel for traders to digest, but we’ve taken some of the core points that all traders can use in their trading process - both to identify high probability set-ups, but also to heighten their risk controls.
Trading the headlines
The title of the Pepperstone Talks conference was “Trading the Headlines” – Given John is such a legendary figure in the world of trading, we were keen to hear how he tackles trading in a headline and news flow-driven market. In this clip, John Bollinger gives a great analogy of how he refrains from anticipating an outcome, putting greater weight on how the market reacts to the facts, which reveals more about sentiment. Assessing the reaction from the collective in the market, and the subsequent price action, can be so powerful for traders.
What are Bollinger Bands®?
With the creator of the Bollinger Bands talking to Pepperstone clients, there are none better to hear on Bollinger Bands should be used correctly.
Bollinger Bands are adaptive and can be utilised to trade breakouts (and potentially trending markets), momentum, and mean reversion, over any timeframe. The basic settings use the 20-day moving average and then projects a two standard deviation move from that average. The wider the bands, the larger the distribution of price movement from the average of the past 20-closing periods - subsequently portraying a higher realised volatility. The narrower the bandwidth the more contained we see movement in the price from that average and therefore a lower realised volatility.
Traders may look for extremes in Bandwidth to suggest an impending change in volatility conditions, but it can also portray an impeding price reversal or an explosive move in one direction.
This short video offers a great overview.
Bollinger Band® indicators
There are two additional indicators which work concurrently with Bollinger Bands to add real context and heightened control - % B and Bandwidth.
Bollinger % B – this indicator effectively tells a trader where the price is in relation to the upper and lower band. John explains the logic behind % B and gives an example that offers a foundation for using % B within a trading strategy.
Bandwidth – As John details in this clip, Bandwidth looks at how wide the upper and lower bands are in relation to the middle band (or the defined moving average). We layout various strategies below that incorporate Bandwidth to assess the risk of a reversal or an explosive move; higher or lower.
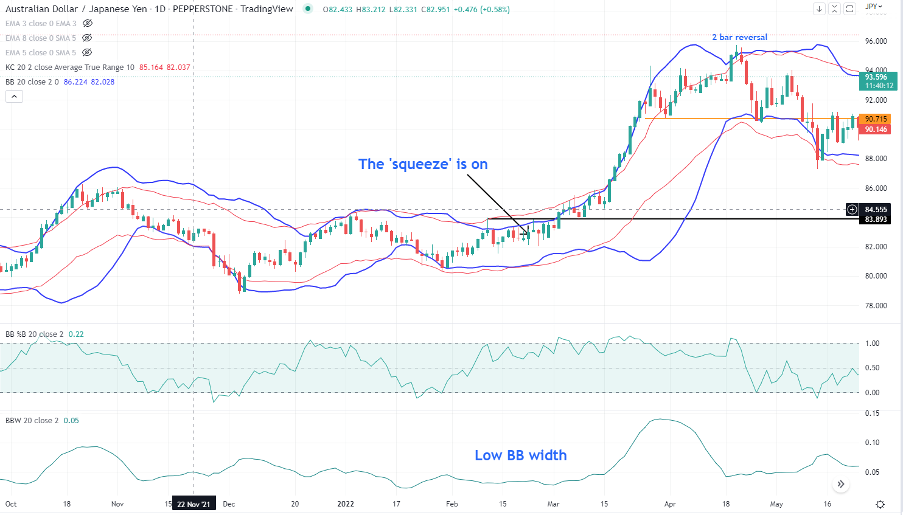
One interesting point was the idea of using Bollinger Bands in conjunction with other volatility-based indicators such as Keltner Bands, or even with one of the many oscillators (such as the RSI). In effect, when both Bollinger Bands move inside the Keltner bands and narrow sufficiently (this is called a ‘squeeze’), often this can be the precursor for an explosion in movement and lead to trending conditions.
We can see this concept on the AUDJPY daily chart. Here, after a prolonged period of sideways price action, with the Bollinger Bands squeezing and trading inside the Keltner bands, we finally saw a powerful breakout - the result was an explosive rally with price riding the upper band.
Strategies to use with Bollinger Bands®
When thinking about strategies with Bollinger Bands, what’s critically important is that it can help identify opportunities where the odds of success are in our favour, where the amount risked is smaller than the potential reward.
Of course, no pattern works every time – To increase the odds of a successful trade John looks for confirmation in the price action – it’s about trading the aggregated flow of capital and while buying something that is starting to go up (selling what is going down) sounds simple, this can help swing the odds - remember a body in motion can stay in motion.
Using stop losses also helps dramatically as it defines your risk on every trade.
Trading W bottoms
The idea of trading ‘W bottoms’ may be foreign to a lot of traders, but trading reversals won’t be – there is a certain logic to this strategy that will absolutely resonate with a lot of traders. Many traders will be fairly familiar with trading price divergence using an RSI, MACD or stochastic, but in this clip, John Bollinger offers several examples of how we can trade divergence using Bollinger Bands.
How to use bollinger bands® to trade
Trading M Tops
John lays out the strategy involved in trading ‘M tops’ – this time we learn to identify various higher probability set-ups and reversals when prices are high. Subsequently, looking for shorting opportunities over different timeframes.
Trading ‘Two Bar Reversals’
John Bollinger’s favourite trading strategy – the ‘Two Bar Reversal’ first requires two consecutive bars both being larger than the 5-day average true range (ATR) – the first bar needs to close outside of the Bollinger Band, and while the second may open outside of the band, if we see it close the period back within the band then the set-up is triggered and we’re then looking for a confirmation bar – John shows how to look for confirmation in the price action, again, to heighten the probability in the trade. A great strategy for counter-trend traders.
Trading with Bollinger Bands®
It was a pleasure to host Pepperstone Talks and put such talent in front of clients. This article touches on some of the key points from John Bollinger’s talk and how to correctly use the Bands. Download the Bollinger Bands onto your MT4, MT5, cTrader or TradingView charts today and see how they can help build your edge as a trader with Pepperstone.