- English (UK)
- English (UK)
Analysis
The Daily Fix – Better supply in equity suggests the coast is not yet clear

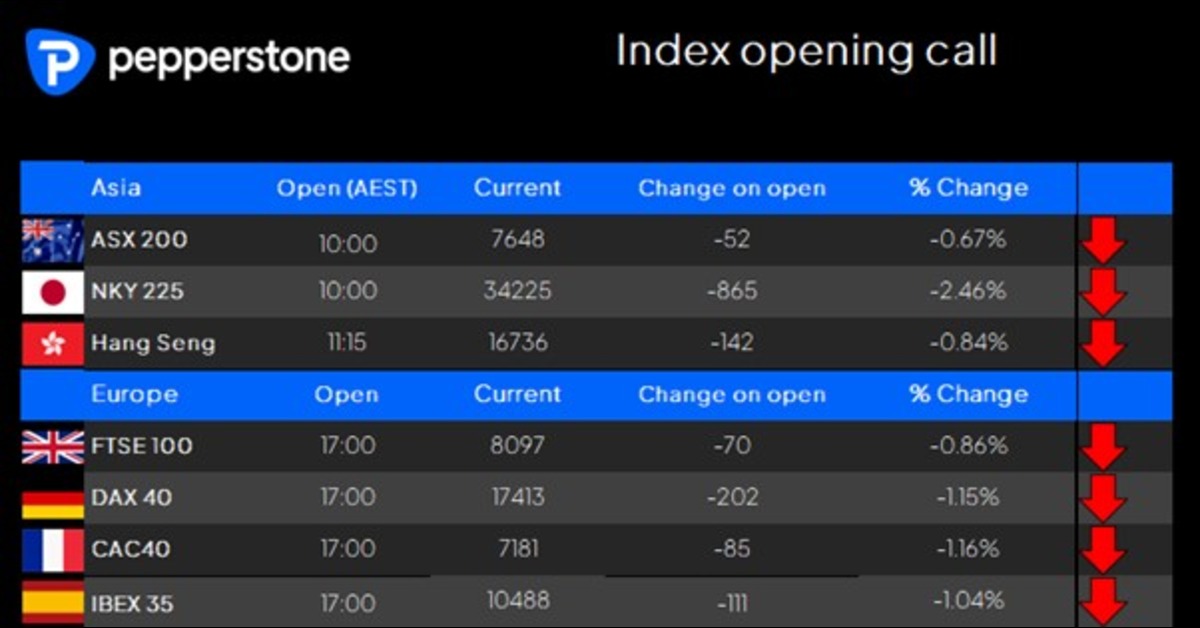
Much can change in this higher volatility regime that traders operate in, and as we saw that front and centre yesterday, where we were calling the NKY225 down hard on the open, yet the buyers stepped in as soon as cash equity trading got underway, and we saw an impressive 8% rally.
We look to the S&P500 and NAS100 futures, where the buyers were making the presence felt, with S&P500 futures rallying into 5395 - but as we have seen in the past 3 sessions, there is clearly heavy supply that kicks in around the 100-day MA, with 5350 capping intraday rallies and until we can see a close above these levels then I would refrain from expressing a view of buying the rip after this dip in risk.
S&P500 futures – daily chart
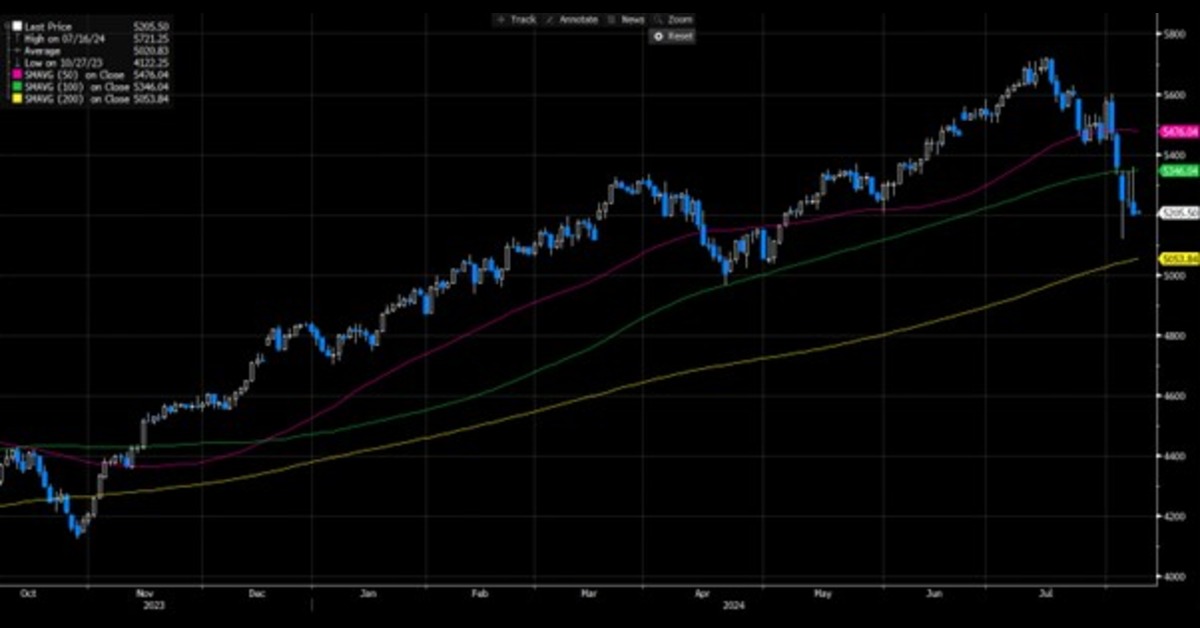
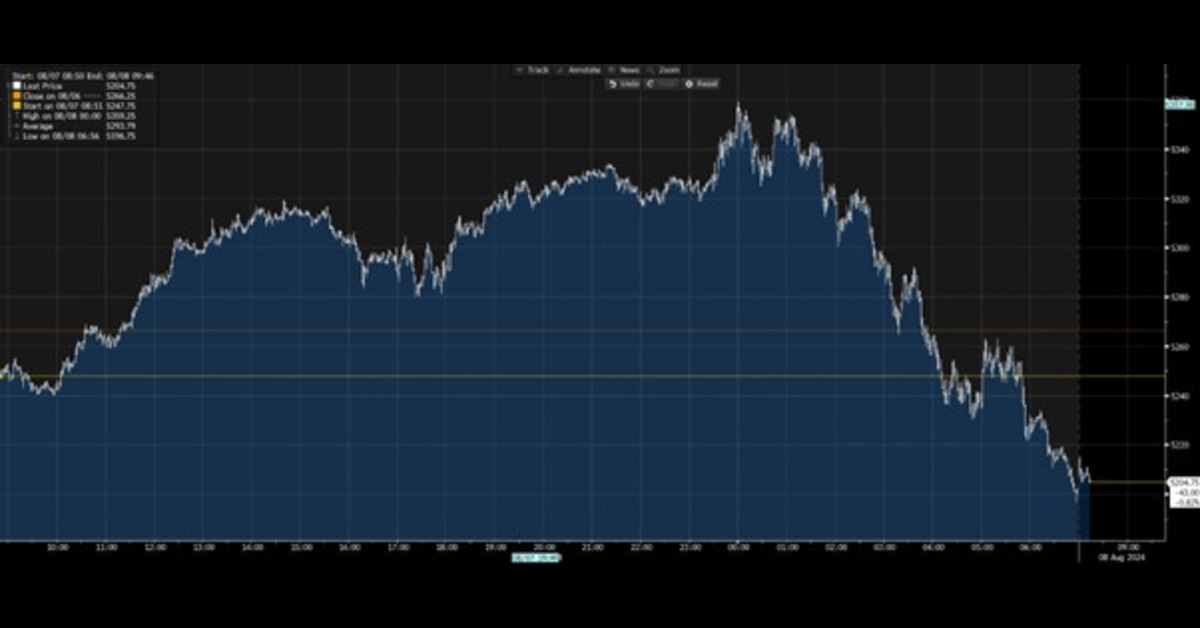
What has been widely discussed (and traded) was the 2.6% reversal lower in the S&P500 (-3.4% in the NAS100) through US cash equity trade, and this could prove to be fairly damaging to the bull’s psyche. The intraday tape seen here could also resonate in Asia, as the buyers in US equity trade simply went missing and Asia-based traders will be considering the possibility that we now see a break of 5200 (S&P500 futures), which could take us towards the 200-day MA (5049).
S&P500 futures – intraday moves
There was no immediate smoking gun for the reversal, but the selling did get legs when we saw the poor US 10-year Treasury auction, with the yield on the US 10-year pushing higher towards 4%, resulting in the US 2s v 10s Treasury curve moving ever closer to un-invert. We also saw buyers of volatility notably in the ultra-short-term 0 DTE (days to expiry) options, with 2.18m puts traded vs 1.43m calls. Many pointed to the rise in the VIX index, which pushed from 22% back to 27%, with hedging flows picking up again.
The selling in the AI-rated names (Nvidia closed -5.1%, Broadcom -5.3%) was also in play, backed by some punchy moves in Super Micro Computers who reported poor numbers and closed -20%. One for the radar, as the shorts are going to work in SMCI, with the stock having lost 50% since 16 July. Tesla also attracts good selling interest, and I would look at shorts here, with a stop on a move above $210.
The move higher in Treasury yields may have been a headwind to risk, but if the JPY has been a key focal point and influence of broad market direction, then the intraday moves seen in USDJPY and alike suggest the effect may have waned today. USDJPY tracked into 147.90, and through US trade found better sellers above 147.50, and we look to see how Asia trades this move today, where a downside break of 146.60 may further accelerate the JPY buying and we may once again see the JPY being more of an influence on sentiment in Asia and US and EU equity futures.
By way of event risk in Japan, we get June balance of payments, and bank lending, while RBA Gov Bullock speaks – I am skeptical we hear anything overly market-moving given we only heard her press conference on Tuesday, so I would have few concerns with holding AUD exposures through today’s speech. In US trade the focus shifts to the weekly jobless and continued claims, and this could be market-moving, especially if the jobless claims rise above 250k.
Today's Asia session could be important, as many had bought the dip with the hope that we see real follow-through buying and the upside momentum building. Looking at the set-up in US indices the reversal we saw will possibly impact that view, and it’s clear that we have not been given all clear just yet - this is a day trader’s market, and one where the ability to react and be nimble to two-way opportunity is there.
We are all data dependent, and the market craves answers that may not be known overnight – where either the US (and global) data comes in hotter, in which case we can add confidence that US hard landing fears are truly overdone and risk assets (such as equity) can climb the wall of worry. Conversely, the data continues to deteriorate, in which case market players continue to de-risk and look to push central bankers to share the vision price by markets – then, if the Fed et al don’t come to the party, the markets will search out where the strike price on the central bank put sits.
Good luck to all,
The material provided here has not been prepared in accordance with legal requirements designed to promote the independence of investment research and as such is considered to be a marketing communication. Whilst it is not subject to any prohibition on dealing ahead of the dissemination of investment research we will not seek to take any advantage before providing it to our clients.
Pepperstone doesn’t represent that the material provided here is accurate, current or complete, and therefore shouldn’t be relied upon as such. The information, whether from a third party or not, isn’t to be considered as a recommendation; or an offer to buy or sell; or the solicitation of an offer to buy or sell any security, financial product or instrument; or to participate in any particular trading strategy. It does not take into account readers’ financial situation or investment objectives. We advise any readers of this content to seek their own advice. Without the approval of Pepperstone, reproduction or redistribution of this information isn’t permitted.