- English (UK)
January 2025 US CPI: Keeping The Fed On The Sidelines

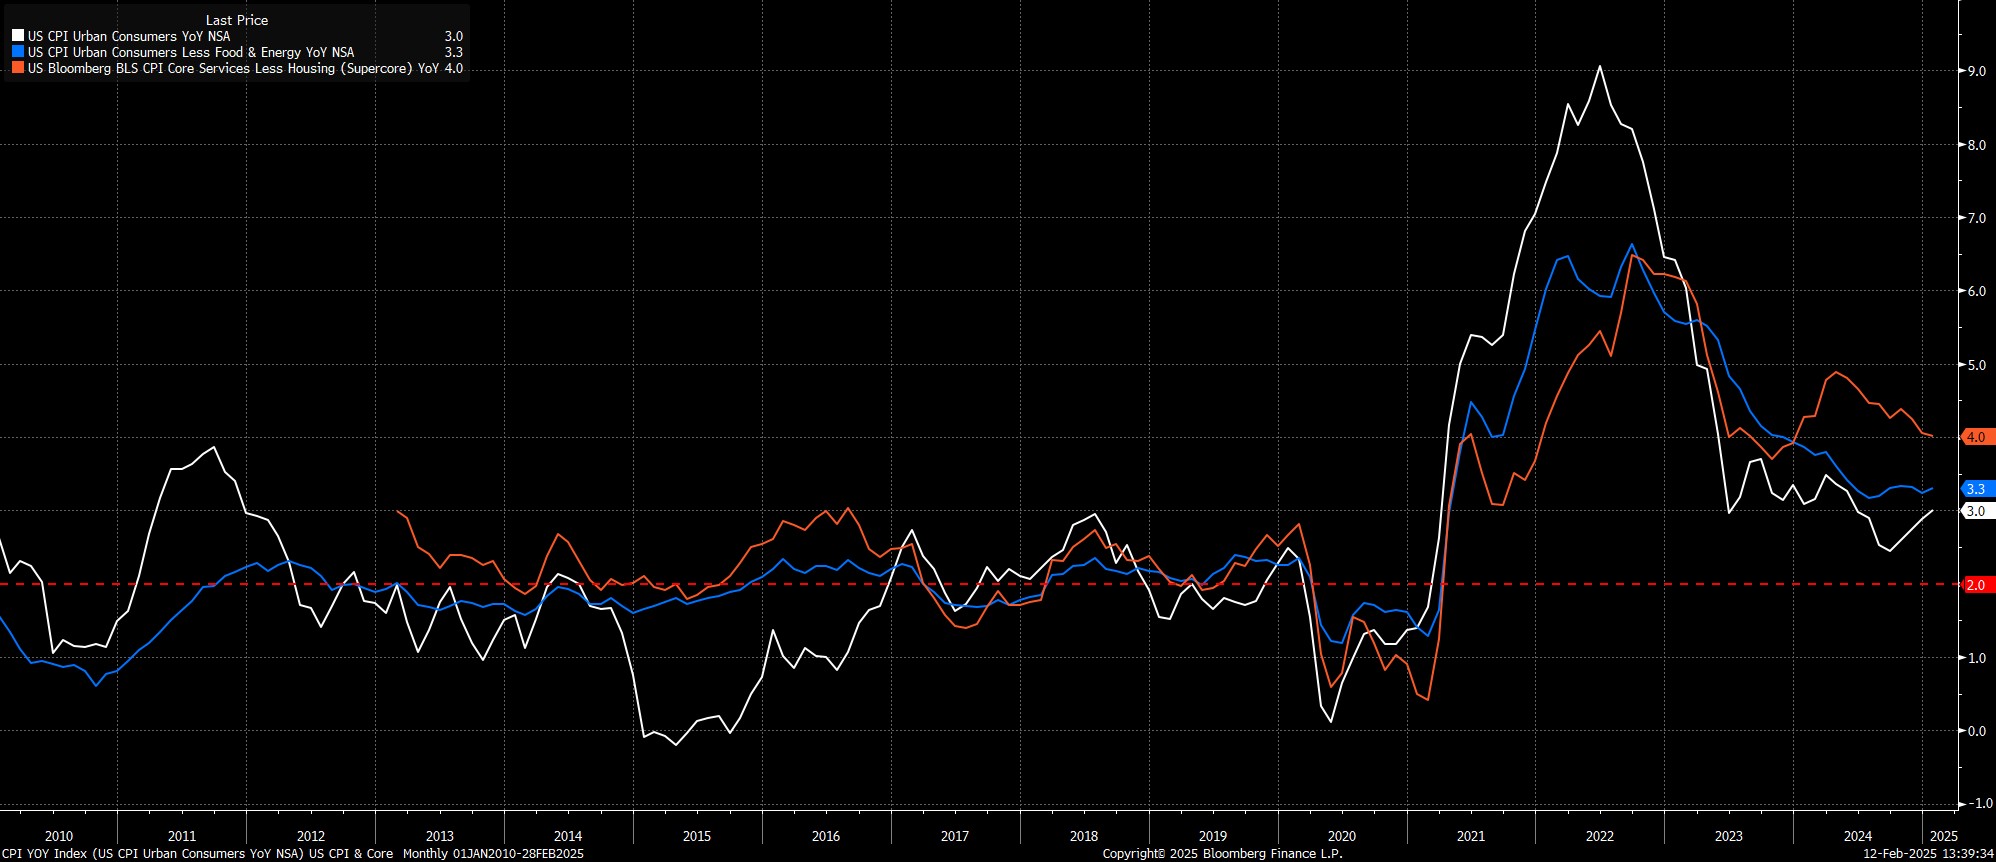
Headline CPI rose 3.0% YoY as the year got underway, above consensus expectations, and the highest level since the middle of last year. Core prices also rose by an above-expected 3.3% pace, which also represented an 0.1pp increase on the December print. Of course, it is important to recognise that the January figures do not account for any potential inflationary impact of the tariffs announced since President Trump returned to the Oval Office.
Meanwhile, on a month-over-month basis, headline inflation rose by 0.5% MoM, with the core metric rising by 0.4% MoM, with both metrics again hotter than expected, and the core print in particular being just 0.004pp away from rounding up to 0.5%.
Annualising the above figures helps to provide a clearer view of the underlying trend in inflation, and will make grim reading for policymakers:
- 3-month annualised CPI: 4.7% (prior 3.9%)
- 6-month annualised CPI: 3.6% (prior 3.0%)
- 3-month annualised core CPI: 3.8% (prior 3.3%)
- 6-month annualised core CPI: 3.7% (prior 3.2%)
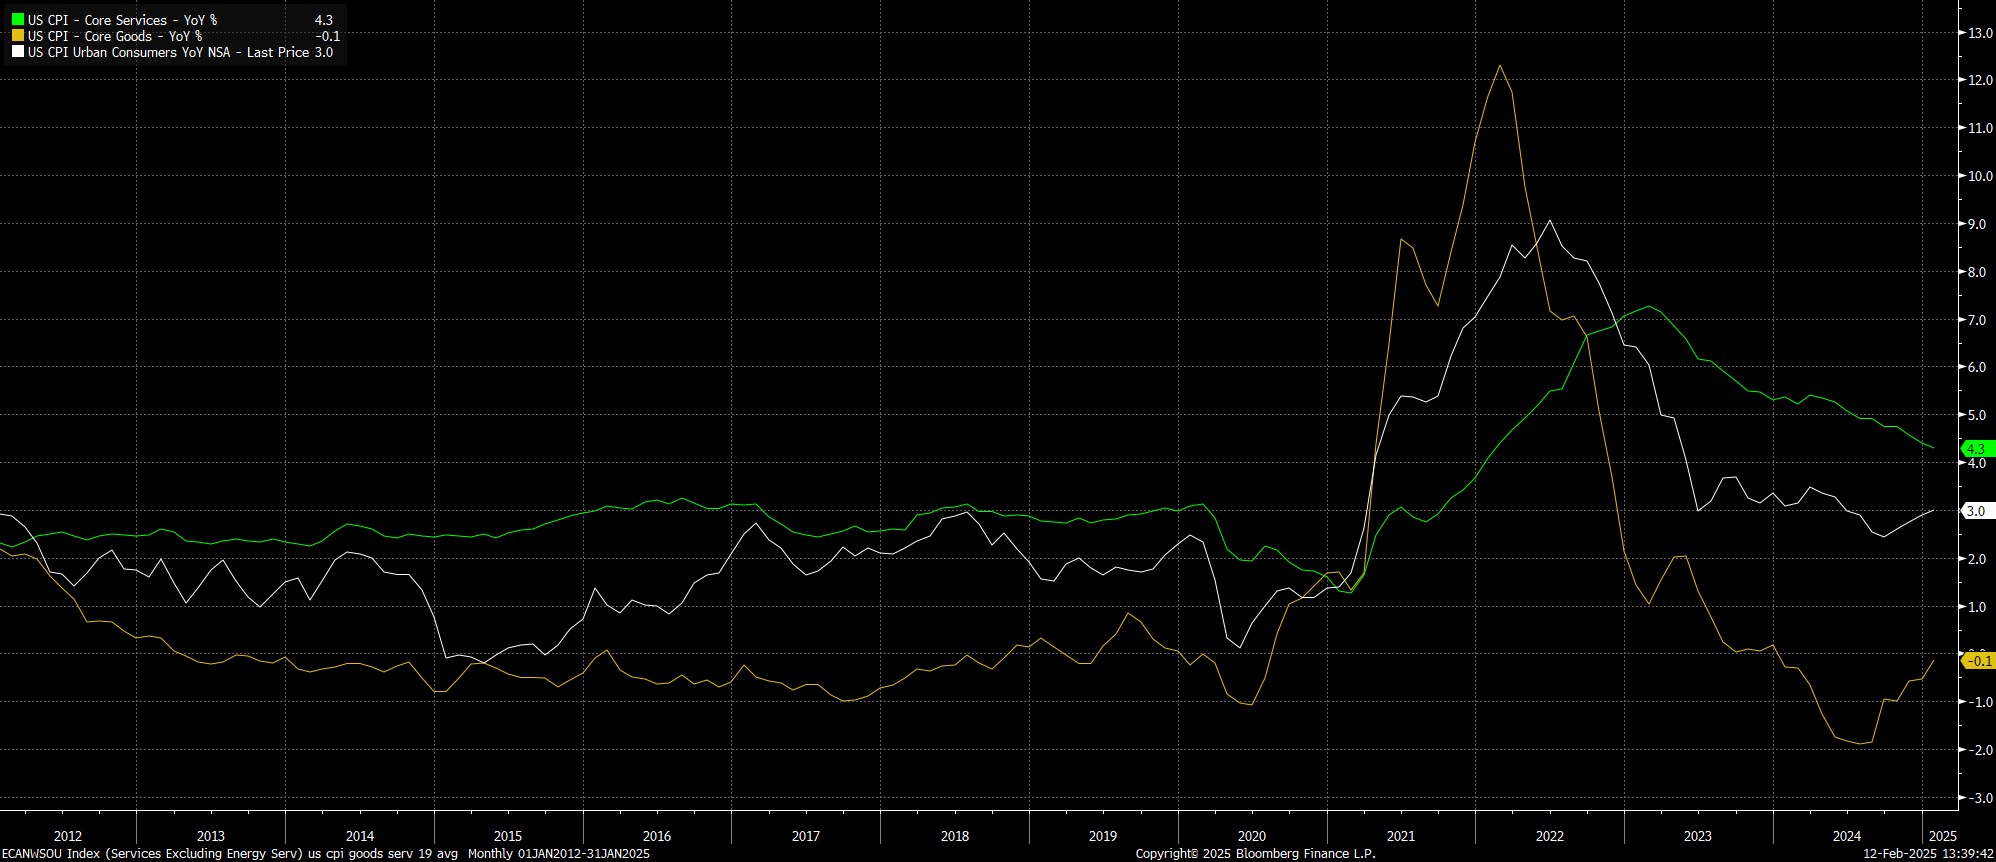
Digging a little deeper into the figures, the January CPI report did point to a continued disinflationary trend in services prices, with the core services index rising 4.3% YoY, its slowest annual increase in almost three years. In fact, the bulk of the rise in headline inflation came by virtue of higher shelter prices, while an end to the goods deflation seen during most of last year also exerted upward pressure on the overall index.
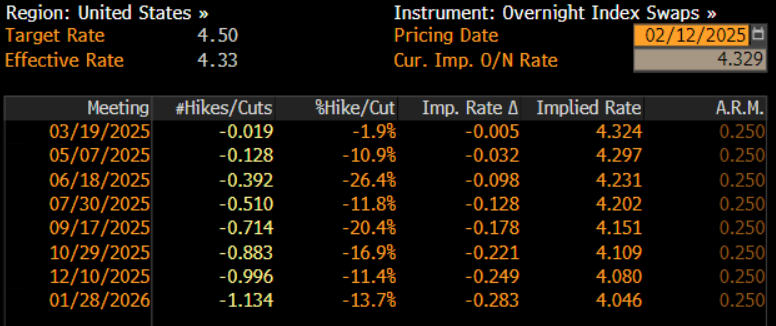
Naturally, as a result of the hotter than expected data, money markets repriced aggressively in a hawkish direction. The already-slim probability of a March Fed cut was slashed to zero, while expectations for the next 25bp cut were pushed back to December, from September pre-release, with the USD OIS curve briefly moving to discount less than a full rate cut over the next 11 months as the data dropped.
Taking a step back, these figures should see the FOMC maintain their patient stance, being in no hurry to deliver another rate cut. Chair Powell has now outlined, on numerous occasions, that the Committee’s default position is to stand pat, unless “real” disinflation progress is made, or unexpected labour market weakness were to emerge. Given that these figures point to disinflationary progress having stalled, the chances of a more prolonged pause in the easing cycle have now risen.
Such a cautious stance will allow policymakers time to not only assess the impact of the 100bp of easing delivered last year, but also to determine how the Trump Administration’s trade policies are impacting the risks to the dual mandate.
Consequently, any rate reductions in the first half of 2025 now seem highly unlikely, while the December ‘dot plot’ median projection for a total of 50bp of cuts this year is now in some doubt, particularly with money markets now discounting just one 25bp cut over the next eleven months.
The material provided here has not been prepared in accordance with legal requirements designed to promote the independence of investment research and as such is considered to be a marketing communication. Whilst it is not subject to any prohibition on dealing ahead of the dissemination of investment research we will not seek to take any advantage before providing it to our clients.
Pepperstone doesn’t represent that the material provided here is accurate, current or complete, and therefore shouldn’t be relied upon as such. The information, whether from a third party or not, isn’t to be considered as a recommendation; or an offer to buy or sell; or the solicitation of an offer to buy or sell any security, financial product or instrument; or to participate in any particular trading strategy. It does not take into account readers’ financial situation or investment objectives. We advise any readers of this content to seek their own advice. Without the approval of Pepperstone, reproduction or redistribution of this information isn’t permitted.