- English (UK)
- English (UK)
Analysis
A Traders’ Week Ahead Playbook: Dynamic to our trading environment

When we consider the market environment, we assess whether a market is trending, balanced and ranging, as well as volatility and range expansion/contraction. Certainly, when it comes to recent movement through a period this has huge implications on how much risk we take in a position (i.e. the distance from entry to our stop) and subsequently our position size.
It’s worth focusing on volatility, as many will attest to being at rock bottom levels in FX and gold volatility.
Assessing realised volatility
We can see from ‘realised’ volatility, which is essentially a statistical measure of volatility (vol) and takes the close-to-close percentage changes (over a set period), calculates the standard deviation of these returns, and then annualizes that number. Using EURUSD as case study, last week the pair saw daily percentage changes of 0.02%, 0.27%, 0.1%, 0.04% and -0.02%, so it’s no surprise that this statistical level of volatility sits at multi-year lows.

We can also look at the implied level of volatility, which is derived from options pricing - I’ve used 1-week implied volatility as this assesses the risk events laid out in the playbook below. The implied move is heavily influenced by realised vol but will also include a premium that is determined by how dealers see the upcoming event risk (through the set period) driving price movement.
Implied vol and the expected ranges
If we look at 1-week implied volatility across the G10 FX pairs and gold again we see these 52-week lows (or the zero percentile of the 12-month range). By replicating the calculation used in options strategies, such as a weekly ‘straddle’ (can send the calculation upon request), we can see the expected move – higher or lower and with a 68.2% and 95% level of confidence – that price is expected to reach this week. Some use this for risk management purposes, others for mean reversion entry signals.
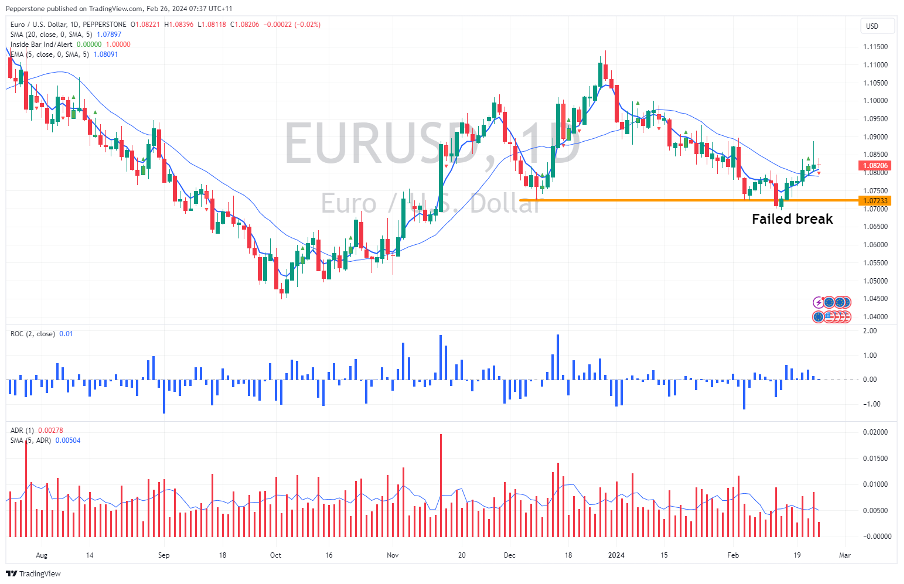
Traders don’t really work on close-to-close price changes though and we cut our craft trading the full extent of the daily high-low range. Here we see EURUSD 5-day high-low range average (ADR) at 50 pips, where in three days last week we saw a range of under 35 pips. USDJPY averages (5-day) 55 pips, AUDUSD 42p, GBPUSD 65p and XAU $16. Traders need to be cute when working orders intraday.
While many would dearly love higher volatility across markets, low volatility can stay that way for some time, although typically the longer it stays compressed the more USD positive it will prove to be when vol does finally present itself. For now this dynamic is pushing funds into high carry currencies and for traders who want upsized movement into areas which are moving, such as high beta equity plays (such as Nvidia and Super Micro Computers), crypto and select commodities.
The process to work to a sustainable higher volatility regime may take time and will likely be driven by the interest rate markets – but we migrate to other markets (if the strategy allows) or we trade what’s in front of us and what the market gives us – we’re dynamic to adapt to price action and our market environment.
Good luck to all….
The marquee event risks for traders in the week ahead
Month-end flows – the sell-side banks expect FX rebalancing to result in USD selling across G10, except for the JPY. We’ll see if there is any noticeable effect on USD flows, but I’ve never seen any edge for trading in focusing on month-old flows.
Tuesday
Japan national CPI (10:30 AEDT) – the market expects headline CPI to print at 1.9% (from 2.6%) and core CPI at 3.3% (from 3.7%). A further deceleration in price pressures should once again challenge the notion the BoJ should be in a rush to change policy. BoJ board member Takata speaks later in the week (Thursday 12:30 AEDT) and he could offer insight on how the JP CPI print influences his view on any future policy changes. The JPY crosses are consolidating at key highs and require monitoring – preference to buy momentum should it play out in NZDJPY and AUDJPY
Wednesday
US consumer confidence (02:00 AEDT) – Further improvement in sentiment is expected with the index eyed at 115 (from 114.8). Unlikely to cause too great a reaction in the USD, but big numbers will only solidify calls that the US economy is in a good spot.
Australia (January) CPI (11:30 AEDT) – the market looks for the first monthly CPI read of 2024 to come in at 3.6% (from 3.4%). AUS swaps pricing is very benign and doesn’t have a full 25bp cut priced until September, with 35bp of cuts priced by year-end. AUDCHF and AUDJPY longs have worked well, and I see risks of further upside in both crosses. AUDUSD is higher for 8 straight days.
RBNZ meeting (12:00 AEDT) – the RBNZ meeting poses a sizeable two-way risk for NZD exposures, and we may well see a short period of volatility that traders will need to manage. 2 of 21 economists are calling for a 25bp hike, with NZ rates markets pricing a 20% chance of a hike. Subsequently, the weight of money is positioned for a hold in the cash rate, but with a hawkish outlook. A hike would also not greatly surprise but given the rates pricing would see the NZD spike hard. Positioning is a core consideration, and the market goes into the meeting very long of NZDs. Preference for limit longs in NZD pairs and buying weakness after the statement drops.
Thursday
US Core PCE inflation (Friday 00:30 AEDT) – the median estimate from economists is for headline PCE inflation to come in at 0.3% QoQ / 2.4% YoY, and core PCE at 0.4% MoM / 2.8% YoY. While this may not create big cross-asset vol, this will get the lion’s share of media attention given the Fed set policy to this inflation metric. We look at the mix of goods vs services inflation, and many will want to assess how the numbers feed into 3- and 6-month annualised rate. How much will traders see through the numbers as driven by seasonal factors or see something more entrenched?
Friday
China NBS manufacturing & services PMI (12:30 AEDT) – the market looks for the manufacturing index to print at 49.1 (from 49.2) and services at 50.8 (50.7). Chinese equity markets have found form, with the CN50 index hitting my target of 12k - an above consensus print should keep the upside momentum in play here, and flipping to the CHINAH index, there is upside potential for 6000 – exit longs on a daily close below the 5-day EMA.
China Caixin manufacturing PMI (12:45 AEDT) – this survey takes the pulse of smaller manufacturing businesses in China. Here, the market looks for the index to print 50.7 (from 50.8), a result which should cause any real vol.
EU (flash) CPI (21:00 AEDT) – the market eyes EU headline CPI at 2.5%, with core CPI at 2.9% (from 3.3%). EU swaps market prices the first 25bp cut in June, with 104bp (four) of cuts priced by December.
US ISM Manufacturing (Sat 02:00 AEST) – the market looks for the manufacturing index to come in at 49.5, an improvement from the prior month’s reading of 49.1. Recall this manufacturing data point has been in contraction territory (a read below 50 indicates this) since October 2022 (15 months). Subsequently, a read above 50 could support the US equity markets (notably the US2000) and promote USD buying.
Fed speakers (times in AEDT)
.png)
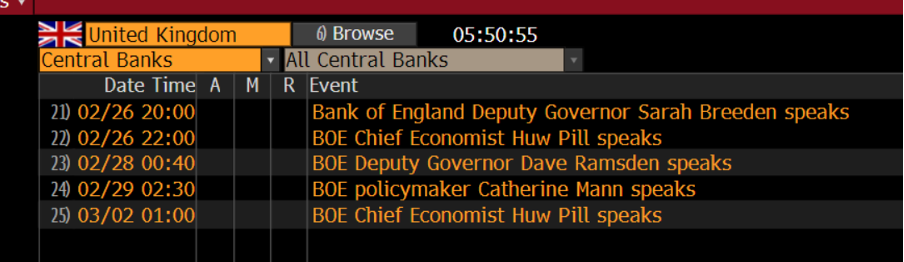
BoE speakers
Related articles


The material provided here has not been prepared in accordance with legal requirements designed to promote the independence of investment research and as such is considered to be a marketing communication. Whilst it is not subject to any prohibition on dealing ahead of the dissemination of investment research we will not seek to take any advantage before providing it to our clients.
Pepperstone doesn’t represent that the material provided here is accurate, current or complete, and therefore shouldn’t be relied upon as such. The information, whether from a third party or not, isn’t to be considered as a recommendation; or an offer to buy or sell; or the solicitation of an offer to buy or sell any security, financial product or instrument; or to participate in any particular trading strategy. It does not take into account readers’ financial situation or investment objectives. We advise any readers of this content to seek their own advice. Without the approval of Pepperstone, reproduction or redistribution of this information isn’t permitted.