- English
US 500 (S&P 500) Explained: Composition, Weighting, and Historical Performance
US 500
The US 500 (also known as SPX500, US SPX 500 or SP500) – more commonly known as the S&P 500, or the Standard and Poor’s 500 – tracks the performance of the 500 largest companies listed on the NYSE, Nasdaq and BZX exchanges. In short, the index tracks the performance of the biggest US companies. The index is, perhaps, the most important and most followed in the world, given that it includes around 80% of the total market cap of publicly listed US companies.
Weighting and Composition
The index is a market capitalisation weighted index, meaning that the larger a company’s market cap, the greater the weight that it has in the index. As of the start of 2024, the 10 largest stocks in the index comprise around a third of the index’s total weight.
Components of the US 500 are not selected by any strict rules-based system, and instead are decided by a committee at S&P Dow Jones Indices. Typically, however, new additions to the index are considered based on their market cap, trading volume, the exchange upon which they are listed, and the country in which the stock in question has its primary listing. The index is typically rebalanced on a quarterly basis, after market close on the third Friday in March, June, September, and December each year.
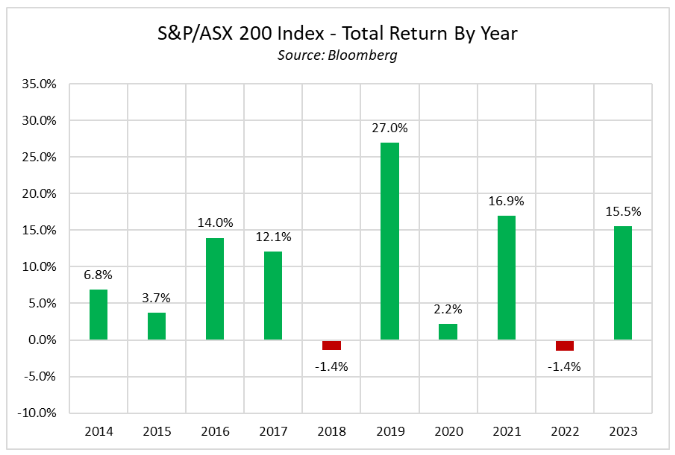
Historical Performance
Historically, the US 500 has tended to perform well on an annual basis, as the below shows. Of course, past performance is no guarantee of future results.
Gaining Exposure to the S&P 500
The S&P 500 is a stock market index, not a directly investable asset. However, you can still participate in its performance through various investment options. These include:
- Mutual funds and ETFs: These track the S&P 500, offering a diversified way to invest in the U.S. stock market.
- CFDs (contracts for difference): These are financial instruments used for trading, allowing speculation on the price movements of the S&P 500.
Important Note: CFDs are complex instruments and carry a high risk of losing money quickly due to leverage. Make sure you understand how CFDs work and can afford to take the high risk involved before trading them.
By weighting, the biggest 50 stocks in the index are as follows:
Position | Stock | Ticker | Weighting as of 01/10/2024 |
1 | Apple Inc. | AAPL | 7.14% |
2 | Microsoft Corp | MSFT | 6.56% |
3 | Nvidia Corp | NVDA | 6.16% |
4 | Amazon.com Inc | AMZN | 3.62% |
5 | Meta Platforms, Inc. Class A | META | 2.56% |
6 | Alphabet Inc. Class A | GOOGL | 1.98% |
7 | Berkshire Hathaway Class B | BRK.B | 1.73% |
8 | Broadcom Inc. | AVGO | 1.66% |
9 | Alphabet Inc. Class C | GOOG | 1.64% |
10 | Tesla, Inc. | TSLA | 1.49% |
11 | Eli Lilly & Co. | LLY | 1.43% |
12 | Jpmorgan Chase & Co. | JPM | 1.23% |
13 | Unitedhealth Group Incorporated | UNH | 1.11% |
14 | Exxon Mobil Corporation | XOM | 1.06% |
15 | Visa Inc. | V | 0.95% |
16 | Procter & Gamble Company | PG | 0.84% |
17 | Mastercard Incorporated | MA | 0.84% |
18 | Home Depot, Inc. | HD | 0.82% |
19 | Costco Wholesale Corp | COST | 0.81% |
20 | Johnson & Johnson | JNJ | 0.80% |
21 | Walmart Inc. | WMT | 0.71% |
22 | Abbvie Inc. | ABBV | 0.71% |
23 | Netflix Inc | NFLX | 0.63% |
24 | Merck & Co., Inc. | MRK | 0.59% |
25 | Coca-Cola Company | KO | 0.57% |
26 | Oracle Corp | ORCL | 0.56% |
27 | Salesforce, Inc. | CRM | 0.55% |
28 | Advanced Micro Devices | AMD | 0.55% |
29 | Bank of America Corporation | BAC | 0.55% |
30 | Chevron Corporation | CVX | 0.51% |
31 | Thermo Fisher Scientific, Inc. | TMO | 0.48% |
32 | Pepsico, Inc. | PEP | 0.48% |
33 | Linde Plc | LIN | 0.48% |
34 | Adobe Inc. | ADBE | 0.47% |
35 | Accenture Plc | ACN | 0.45% |
36 | Mcdonald's Corporation | MCD | 0.45% |
37 | Cisco Systems, Inc. | CSCO | 0.44% |
38 | International Business Machines Corporation | IBM | 0.42% |
39 | Ge Aerospace | GE | 0.41% |
40 | Abbott Laboratories | ABT | 0.40% |
41 | Texas Instruments Incorporated | TXN | 0.39% |
42 | Wells Fargo & Co. | WFC | 0.39% |
43 | Caterpillar Inc. | CAT | 0.39% |
44 | Qualcomm Inc | QCOM | 0.39% |
45 | Verizon Communications | VZ | 0.39% |
46 | Philip Morris International Inc. | PM | 0.39% |
47 | Servicenow, Inc. | NOW | 0.37% |
48 | Danaher Corporation | DHR | 0.37% |
49 | The Walt Disney Company | DIS | 0.36% |
50 | Nextra Energy, Inc. | NEE | 0.36% |
The material provided here has not been prepared in accordance with legal requirements designed to promote the independence of investment research and as such is considered to be a marketing communication. Whilst it is not subject to any prohibition on dealing ahead of the dissemination of investment research we will not seek to take any advantage before providing it to our clients.
Pepperstone doesn’t represent that the material provided here is accurate, current or complete, and therefore shouldn’t be relied upon as such. The information, whether from a third party or not, isn’t to be considered as a recommendation; or an offer to buy or sell; or the solicitation of an offer to buy or sell any security, financial product or instrument; or to participate in any particular trading strategy. It does not take into account readers’ financial situation or investment objectives. We advise any readers of this content to seek their own advice. Without the approval of Pepperstone, reproduction or redistribution of this information isn’t permitted.