- English
Understanding the JPN 225: A Guide to the Nikkei Stock Average
JPN 225
The JPN 225 – also known as the Nikkei Stock Average, N225, JP225, Nikkei 225, or even simply the Nikkei – is a key benchmark equity index for the Japanese stock market. It tracks the performance of 225 of the largest listed companies on the Tokyo Stock Exchange.
In contrast to many other global equity benchmarks, but in keeping with the US 30, the JPN 225 is a price-weighted index, meaning that an individual constituent’s weighting in the index is directly proportional to its price; the higher a stock’s price, the greater its weight, and thus the more significant an impact it will have on the index as a whole. The JPN 225 is denominated in Japanese Yen (JPY) and serves as the underlying asset for various financial instruments, including futures contracts, CFDs (Contracts for Difference), and spread bets.
The index comprises 225 of the largest Japanese listed companies, having initially been calculated in September 1950, albeit with the index being retrospectively calculated back to 18 months prior to its launch. The JPN 225 is updated every five seconds during regular trading hours on the Tokyo Stock Exchange. Investors can monitor the index's performance and market conditions in real-time, making informed decisions based on their risk tolerance and investment goals.
The JPN 225 famously underwent a significant bubble in the late-1980s, with the index rallying more than fivefold over the course of the ‘80s, before losing over 80% of its value when measured to the intraday low printed during the GFC in 2008.
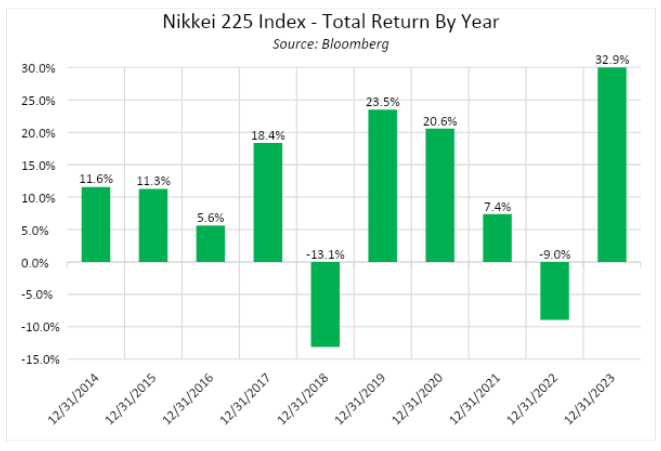
More recent performance for the index, on a total return basis, is shown below. Remember, past performance shouldn't be the sole factor in making investment decisions. It's crucial to conduct thorough research and consider your risk tolerance before investing in any financial market.
Furthermore, index weightings for the largest individual JPN 225 are as follows.
Stock | Weighting as of 01/10/2024 |
TOKYO ELECTRON LTD. | 6.56% |
ADVANTEST CORPORATION | 4.36% |
SOFTBANK GROUP CORP. | 4.16% |
SHIN-ETSU CHEMICAL CO., LTD. | 2.74% |
TERUMO CORPORATION | 1.89% |
FANUC CORPORATION | 1.82% |
KYOCERA CORPORATION | 1.21% |
SONY GROUP CORPORATION | 1.19% |
TOYOTA MOTOR CORPORATION | 1.16% |
NITTO DENKO CORPORATION | 0.99% |
FUJIFILM HOLDINGS CORPORATION | 0.99% |
LASERTEC CORPORATION | 0.96% |
NTT DATA CORPORATION | 0.93% |
BANDAI NAMCO HOLDINGS INC. | 0.80% |
OTSUKA HOLDINGS CO., LTD. | 0.74% |
KIKKOMAN CORPORATION | 0.70% |
TOYOTA TSUSHO CORPORATION | 0.70% |
TOKIO MARINE HOLDINGS, INC. | 0.70% |
NINTENDO CO., LTD. | 0.67% |
ITOCHU CORPORATION | 0.64% |
MURATA MANUFACTURING CO., LTD | 0.60% |
SHIONOGI & CO., LTD. | 0.58% |
SUZUKI MOTOR CORPORATION | 0.58% |
MITSUI & CO., LTD. | 0.52% |
NISSAN CHEMICAL CORPORATION | 0.43% |
MITSUI FUDOSAN CO., LTD. | 0.40% |
ZOZO, INC. | 0.39% |
DAIWA HOUSE INDUSTRY CO., LTD. | 0.38% |
TAKEDA PHARMACEUTICAL COMPANY LIMITED | 0.37% |
JAPAN TOBACCO, INC. | 0.36% |
The material provided here has not been prepared in accordance with legal requirements designed to promote the independence of investment research and as such is considered to be a marketing communication. Whilst it is not subject to any prohibition on dealing ahead of the dissemination of investment research we will not seek to take any advantage before providing it to our clients.
Pepperstone doesn’t represent that the material provided here is accurate, current or complete, and therefore shouldn’t be relied upon as such. The information, whether from a third party or not, isn’t to be considered as a recommendation; or an offer to buy or sell; or the solicitation of an offer to buy or sell any security, financial product or instrument; or to participate in any particular trading strategy. It does not take into account readers’ financial situation or investment objectives. We advise any readers of this content to seek their own advice. Without the approval of Pepperstone, reproduction or redistribution of this information isn’t permitted.