- English
Learn to trade

Oil trading involves the exchange of crude oil, one of the world's most essential and highly valued commodities. Crude oil and its refined products serve as the backbone of the global economy, acting as both a primary energy source and a critical raw material. Consumed continuously across the globe, oil has played a pivotal role in shaping the modern world.
Oil is measured in units called barrels, each containing just under 159 litres of crude oil. In 2022, global oil production reached 93.90 million barrels per day, according to Statista. However, this figure remains slightly below the all-time high of 95.0 million barrels per day recorded in 2019.
What are the benefits of trading oil?
The pursuit of oil has historically led to conflicts, and much of the world's oil is still produced in politically sensitive areas. The level of oil demand is often viewed as a yardstick for measuring the health of the global economy.
This combination of fluctuating yet persistent demand, economics, and geopolitics means that oil prices are almost always in motion, making oil highly attractive to speculators and traders.
What are the risks of trading oil?
Oil prices are sensitive to global economics and geopolitics, acting as barometers for both. This sensitivity means that oil prices can be volatile and move sharply when major news breaks or unexpected events occur.
Changes in the dynamics of supply and demand can also cause oil prices to experience sharp movements.
These types of events can come unexpectedly and are difficult to predict and plan for.
It is important to be aware that multiple oil prices are derived differently:
- NYMEX WTI Crude Oil: Based on a benchmark in oil futures contracts traded on CME’s New York Mercantile Exchange.
- Brent Oil: An international benchmark primarily used in Europe, traded on the Intercontinental Exchange (ICE).
- OPEC Basket: An aggregate price for oil produced and exported by OPEC countries, with Saudi Arabia as a key member.
What are the main types of oil traded?
The majority of the trade in oil is conducted in two key benchmarks: WTI and Brent Crude.
WTI, or West Texas Intermediate, is known as a light sweet crude oil, which flows easily and requires less refining than its heavy or sour counterparts. WTI is considered a US-centric crude oil, and delivery for WTI futures contracts takes place in Cushing, Oklahoma, located at the heart of America.
Contracts for more than 1.0 billion barrels of WTI crude are traded each day in the markets, and as the US becomes an increasingly important producer and exporter of crude oil, that figure could increase.
Brent crude is also a sweet light crude, originally produced in the Brent oil fields located in the North Sea between the UK and northern Europe in 1976. Though the Brent field itself is no longer active, the name has been retained, and crude oil extracted from other European oil fields now falls under this designation.
Brent is seen as the benchmark for Atlantic basin crudes. However, Brent also acts as a price barometer for as much as 80% of global crude production, according to data from the Intercontinental Exchange (ICE).
How do geopolitical events impact oil prices?
Oil and geopolitics are closely interwoven because many of the world's oil-producing economies are also political hot spots. Additionally, the biggest consumers of oil are among the most powerful nations. Events that threaten or hinder the production or transportation of crude oil and its refined products can send oil prices higher very quickly. Conversely, geopolitical events that increase crude production or ease transportation bottlenecks, such as those in the Straits of Hormuz or the Suez Canal, can drive oil prices lower.
How can I integrate macroeconomic analysis into my oil trading strategy?
Oil’s sensitivity to geopolitical and macroeconomic events means it is relatively easy to incorporate macroeconomic analysis into an oil trading strategy. As with all commodities, oil is mostly priced and traded in US dollars, making it sensitive to changes in the dollar's value. A stronger dollar applies pressure to oil prices, while a weaker dollar supports oil prices. It follows that macroeconomic events influencing the dollar's value can also affect oil prices. The more significant the data, the greater its potential impact.
By studying and filtering the Pepperstone macroeconomic calendar, we can create a timetable of key macroeconomic data releases and be prepared for them. Markets tend to move most when data deviates from analysts' expectations or prior trends. The dollar and crude oil are no different. Being aware of what is expected from major economic releases and what the recent history of the data is could provide you with an oil trading edge.
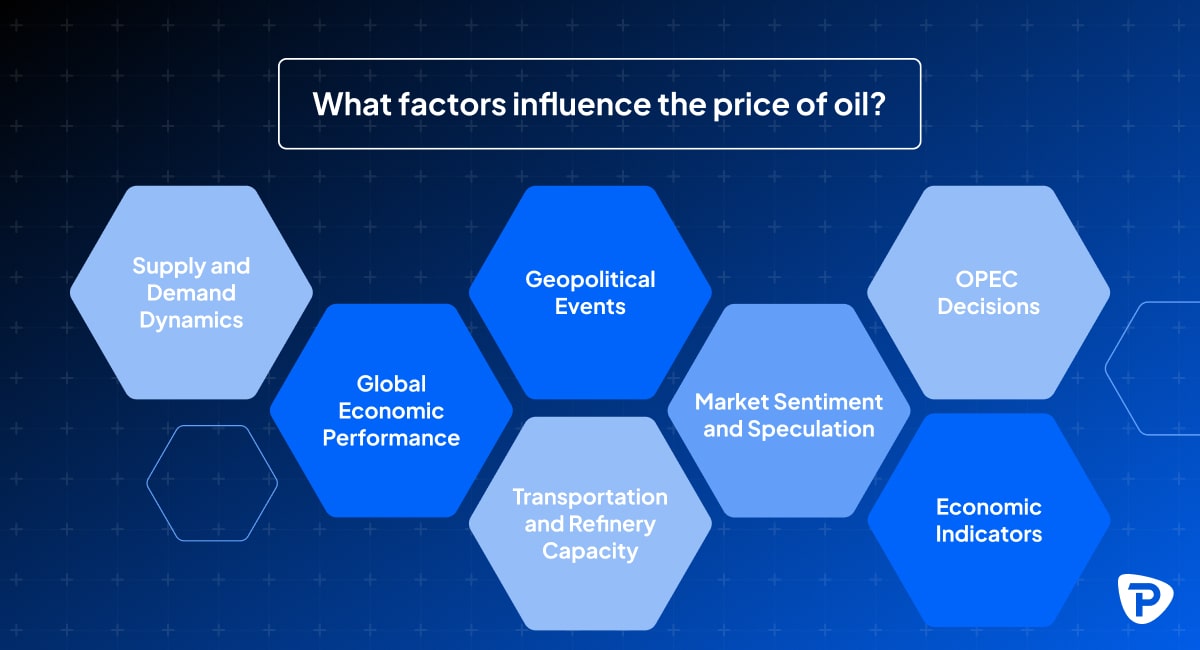
What factors influence the price of oil?
Oil prices are shaped by a broad range of factors, many of which can lead to significant price fluctuations. Key influences include:
Supply and Demand Dynamics: The balance between global oil supply and demand is a fundamental driver of oil prices. Supply disruptions (such as during the oil crisis of the 1970s, when prices tripled) or surges in demand can lead to sharp price increases. Conversely, oversupply or weakening demand can cause prices to fall. OPEC’s production decisions are particularly important in controlling supply levels.
Global Economic Performance:The health of the global economy, particularly major economies like the US, China, Japan, and the EU, has a direct impact on oil demand. Strong economic growth leads to increased consumption, pushing prices higher, while economic slowdowns often result in reduced demand, driving prices down
Geopolitical Events: Political instability, trade disputes, or conflicts in oil-producing regions (like the Middle East or Russia) can lead to supply chain disruptions and heightened volatility in oil prices. Sanctions or embargoes on major oil producers also affect global supply, often driving prices up.
Transportation and Refinery Capacity: The cost and availability of transporting oil (via pipelines or seaborne tankers) and the capacity of refineries to process crude oil into usable products play a key role in determining short-term oil prices. Bottlenecks or disruptions in transportation or refining can limit supply, pushing prices higher.
Market Sentiment and Speculation: Market sentiment, driven by news, reports, and speculation, can create short-term price swings. Speculators, including CFD traders, often react quickly to changes in economic data or geopolitical developments, amplifying price movements through leveraged positions.
OPEC Decisions: OPEC’s production quotas and decisions to cut or increase oil output have a significant influence on global supply, which in turn affects prices. Traders often look to OPEC meetings to gauge future price trends.
Economic Indicators: Reports on GDP growth, industrial output, and energy demand from major oil-consuming nations provide important signals about the future direction of oil prices. For example, strong industrial activity in the US or China can drive up oil consumption and prices, while weaker data may signal reduced demand and falling prices.
What is OPEC and how does it impact the oil market?
OPEC, or the Organisation of Petroleum Exporting Countries, is effectively the international trade body for many oil and gas producing nations. The organisation, which is headquartered in Vienna, Austria, came to prominence in the 1970s when Middle-Eastern oil producers demanded a better deal from their Western customers by collectively hiking the price at which they would sell oil.
Since the 1970s, OPEC has expanded its membership and today it tries to manage the supply and production of crude on a global basis. Sometimes it does this in conjunction with non-OPEC oil-producing nations such as Russia, to try and create a stable and attractive price range in oil for its member states. OPEC has regular meetings throughout the year to establish production targets and quotas. However, with the growth in non-OPEC oil production, in the US and elsewhere, its overall influence is far more limited than in its heyday in the 1970s and 80s.
How do environmental and sustainability concerns impact the oil market?
Greenhouse gases, such as carbon dioxide (CO2), which is emitted through the combustion of fossil fuels like oil, are closely associated with global warming and climate change. In response, many of the world’s economies are actively pursuing an energy transition—a strategic shift aimed at reducing dependence on fossil fuels and promoting renewable and environmentally sustainable energy sources, including solar, hydroelectric, and wind power.
Over time the move away from the use of CO2-producing fuels and sources of energy, is likely to shrink oil demand. However, oil and gas are embedded into our economies and infrastructure. And that means this energy transition will take decades and trillions of dollars of investment to achieve. Additionally, developing and highly populous nations in Asia are just beginning to transition their economies away from fossil fuels. Consequently, demand for oil and gas in these regions could potentially grow over the medium term.
What are the different ways to trade oil?
There are various ways to trade oil, including oil futures, and there are separate futures contracts for WTI and Brent crude, both of which are over 1000 barrels of oil. This means that one lot of WTI crude oil futures (at the time of writing) has a notional value of approximately $80,000. The initial margins or deposit on WTI futures contracts are currently around $5900.00 per lot according to the CME website. It's also possible to trade in the shares of oil companies listed on major stock exchanges around the world.
However, trading oil company stocks is not a pure play on oil prices. Alternatively, you could consider trading ETFs or Exchange Traded Funds, which track the price of oil.The regulations about trading ETFs vary from jurisdiction to jurisdiction, which could limit the choice of funds available to you or prevent you from trading them entirely. Instead of the options outlined above, many traders prefer to use CFDs to trade oil. CFD trading or Contracts For Differences trading are cash-settled, non-deliverable contracts that allow you to speculate on the rise and fall of the oil price without the need for ownership of the underlying oil.
How can I start trading oil using CFDs?
Four key steps to start trading oil using CFDs:
- Open an account: Begin by opening an account with a CFD broker, such as Pepperstone, which offers a selection of trading platforms and access to oil prices.
- New traders can get to grips with the trading platform and the markets by using a demo account which simulates live market conditions and trading without the need to risk any real money.
- Fund your account: Once your trading account is open, you will need to fund it by making a deposit.
- Download the Trading Platform: Download the trading platform provided by your broker and familiarise yourself with its features and functionality.
- Start Trading: After gaining confidence in using the trading platform, you will be ready to start trading oil.
Pepperstone trades in what are known as oil CFDs, or Contracts For Differences, which are cash-settled and non-deliverable. This allows you to trade long or short with equal ease, without worrying about the ownership or delivery of the underlying commodity.
What is leverage and how is it used in oil trading?
Leverage allows traders to increase their exposure to the oil market without needing the full amount of capital that the position would typically require. This is achieved through margin trading of Contracts for Difference (CFDs), where the broker enables the trader to amplify their market position by covering the difference between the initial margin and the full value of the trade.
For example, if a trader has $500 in their account and the broker offers 10:1 leverage, the trader can control a position worth up to $5,000 in the oil market. This means the trader can take a larger position than their account balance would normally permit, leveraging the initial deposit to increase potential returns.
The broker facilitates this leverage by covering the difference between the trader's initial margin (or deposit) and the notional value of the trade. It is important to note that if a position is held overnight, the trader will incur funding or interest charges on the notional value of the trade. These charges typically do not apply to trades opened and closed within the same business day. It is also important to note that margin or leverage rates can vary between different products and regulatory jurisdictions.
How to analyse oil market trends
Analysing trends in the oil market might initially seem daunting, but it has become significantly easier for retail traders to access relevant market information. Here are some tips on how to track and analyse oil market trends:
Keep track of oil prices:
- Utilise Pepperstone’s trading platforms, which provide real-time oil prices and charts displaying a tick-by-tick record of oil price movements. Historical data can also be accessed to observe past trends.
Use technical indicators and tools:
- Pepperstone’s trading platforms come equipped with a wide range of technical indicators and tools. These can help analyse price action and identify trends in oil prices, making it easier to assess market movements.
Make use of regulatory and positioning reports:
- Regular reports can provide valuable insights into oil market trends. Notable reports include the weekly Commitments of Traders (COT) report from the Commodity Futures Trading Commission (CFTC), published every Friday, and the U.S. Energy Information Administration (EIA) report on crude oil inventories, published weekly on Wednesdays.
Monitor key industry websites:
- Trade body websites, such as the International Energy Agency (IEA), offer a wealth of facts and data about oil and energy markets. These sources can provide comprehensive insights into current trends and future projections.
By leveraging these resources, traders can develop a well-rounded understanding of the oil market and make more informed trading decisions.
Choosing an oil trading strategy
Selecting an effective oil trading strategy involves choosing one that you can understand and implement while being active in the markets. Here are some considerations:
Understand market sensitivities:
- Oil prices are sensitive to changes in the value of the US dollar, macroeconomic data, and geopolitical events. Recognising these factors can help you anticipate market movements.
Consider trend-following strategies:
- Oil markets can trend in the same direction for extended periods. A simple trend-following strategy, which involves trading in the direction of the market's movement, can be a good starting point.
- This strategy entails maintaining your position as long as the market continues to trend in that direction and adjusting your position only when the trend changes or reverses.
Identify potential inflection points:
- Key macroeconomic data releases, especially those with significant deviations or surprises, can create inflection points in oil price trends.
- Important geopolitical events, including OPEC meetings, can also influence market direction and should be closely monitored.
By understanding these elements and choosing a strategy that aligns with your comprehension and activity level, you can more effectively navigate the oil trading market.
How can I better manage risk in oil trading?
Effective risk management in oil trading involves adhering to several key principles:
Avoid over-trading:
- Oil prices can move rapidly and unpredictably. To manage risk, avoid over-trading and ensure that your position sizes are appropriate for the size of your account.
Correct position sizing:
- Having the correct position size or the number of positions open relative to your account size can help reduce and manage your trading risk.
Follow existing trends:
- New traders often make the mistake of opposing existing trends. While intuition may sometimes be correct, the oil market is largely driven by sentiment and significant financial forces.
- International oil companies, major energy producers, consumers, banks, and large-scale commodity traders have deeper resources, making it impractical for retail traders to oppose prevailing trends.
Wait for trend reversals:
- If you wish to oppose the current trend, wait for clear signs from the market and price action indicating that the trend is fading before making a move.
Use stop loss orders:
- Always use stop loss orders to limit potential trading losses to a predefined amount. Be mindful of where you place your stop loss to ensure it effectively mitigates risk.
- Factor in the possibility of slippage when developing your trading and risk management strategies.
Monitor economic indicators:
- Oil prices are influenced by movements in the US dollar, major data releases, and production reports. Study the macroeconomic calendar and news flow to stay aware of key data releases and meetings, as well as market expectations for these events.
By following these guidelines, traders can better manage their risk and navigate the complexities of the oil trading market.

Using technical analysis in oil trading
Choosing the right technical analysis tools and indicators for oil trading should be based on those you can understand and use to your advantage. Here are some foundational tools and indicators to consider:
Moving averages:
- Moving averages are a simple yet powerful tool, representing a rolling measure of average prices over a fixed period, such as 15 minutes, 1 hour, or 10 days.
- Traders often plot two moving averages with different time frames and study their interactions with the price line.
- For example:
A 5-day moving average is recalculated four times more frequently than a 20-day moving average.
The shorter-term moving average provides insights into current momentum and trends, while the longer-term moving average offers a broader view.
Crossing moving averages:
- Traders observe the direction of moving averages and the points at which they intersect.
- When the faster-moving, shorter-term average crosses above the slower-moving, longer-term average, it indicates rising price momentum.
- Conversely, when the shorter-term average crosses below the longer-term average, it suggests negative price momentum.
Price crossovers:
- Signals are generated when the current price crosses above or below the moving averages, indicating potential entry or exit points.
Relative strength index (RSI):
- The RSI, particularly the 14-day RSI, is another valuable indicator used by technical traders.
- It helps identify potential trend changes and overbought or oversold conditions in the oil price.
By starting with these simple yet effective tools, traders can develop a solid foundation in technical analysis and enhance their ability to make informed trading decisions in the oil market.
Oil Trading FAQs
What does Brent mean in oil?
Brent crude refers to a specific type or quality of oil discovered in the UK Brent oilfield, located in the North Sea. Brent is a light crude oil and is commonly associated with Europe.
What does an oil trader do?
An oil trader speculates on the price of oil to make a profit. They aim to be long on oil when prices are rising and short on oil when prices are falling. Oil traders hope to profit by selling their long positions at a higher price than they initially paid or by buying back their short positions at a lower price than they originally sold.
What happens to an oil CFD if oil goes up?
CFDs (Contracts for Difference) are delta-one instruments, meaning their price changes one-for-one with the underlying instrument. If the price of oil increases by $5.00 per barrel, the price or value of an oil CFD also increases by $5.00 per barrel. However CFDs are also leveraged products and that means that PnL changes, whether profits or losses, reflect that leverage and are magnified by it.
The running P&L (Profit and Loss) of a CFD trade is calculated by subtracting the opening price from the current price. For a long trade, if the current price is above the entry level, there is a running profit. For a short trade, a running profit occurs when the current price is lower than the entry level.
How do oil traders trade?
Oil trading is conducted electronically and online through specialised trading platforms. The contracts oil traders use depend on their type and their specific goals and needs:
- Traders needing delivery of the underlying oil typically trade oil futures contracts.
- End users and industrial consumers may trade specific oil blends and refined products using a combination of futures and OTC (over-the-counter) markets and they may take delivery of these underlying products.
- Oil speculators and retail traders, who do not require delivery, often trade oil through cash-settled, non-deliverable CFDs.
Is oil trading profitable?
Oil trading can be profitable due to the highly active market and the numerous external factors affecting oil prices, creating frequent trading opportunities. However, the same factors can lead to significant losses if a trader lacks discipline, ignores money management and risk rules, or trades emotionally.
This risk is especially true when trading margin products like oil CFDs. While margin can magnify profits on successful trades, it can also magnify losses on trades that go against the trader.
What is the difference between spot and futures oil prices?
The spot price of oil is the current price of oil at this moment in time. In contrast, the futures price is the price of oil at a fixed point in the future, such as 1, 3, or 6 months ahead. Spot and futures prices differ due to factors such as the cost of carry (including storage and transportation costs) and the forward supply and demand curve for oil.
Related articles

The material provided here has not been prepared in accordance with legal requirements designed to promote the independence of investment research and as such is considered to be a marketing communication. Whilst it is not subject to any prohibition on dealing ahead of the dissemination of investment research we will not seek to take any advantage before providing it to our clients.
Pepperstone doesn’t represent that the material provided here is accurate, current or complete, and therefore shouldn’t be relied upon as such. The information, whether from a third party or not, isn’t to be considered as a recommendation; or an offer to buy or sell; or the solicitation of an offer to buy or sell any security, financial product or instrument; or to participate in any particular trading strategy. It does not take into account readers’ financial situation or investment objectives. We advise any readers of this content to seek their own advice. Without the approval of Pepperstone, reproduction or redistribution of this information isn’t permitted.