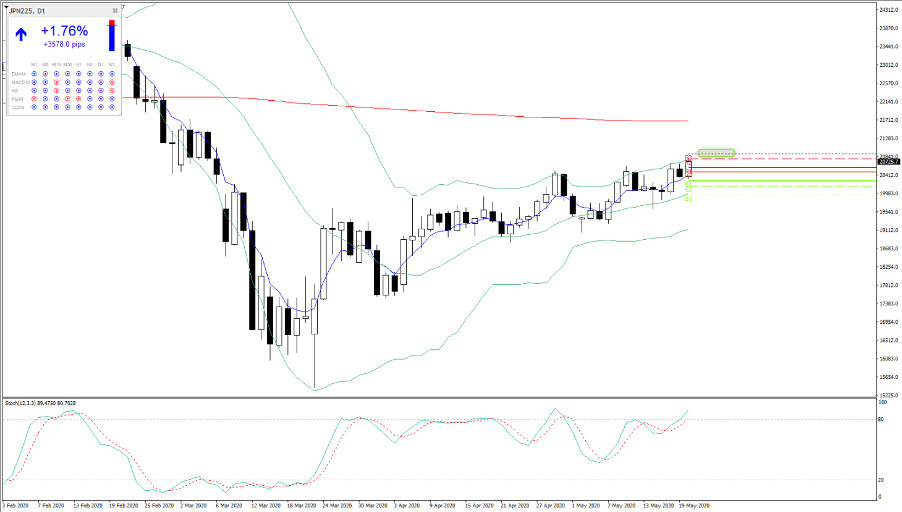
Its break-out city in Asian equities, notably for ASX200 and Japan, and the pain trade remains to the upside – the question is whether to buy the open or wait to see how price reacts, in this newfound territory.
Japan especially looks interesting, with the 200-day MA the clear target, although on the day, we see R3 (pivot) into 20,908, which marries nicely with a move above the top Bollinger Band, and that would be area to fade and look at mean reversion short positions.
There hasn’t been a huge amount of news to drive but we’ve seen some selling of volatility across the boards, with the VIX back below 30% and at 27.99% in the VIX cash the vol index implies that the S&P500 should trade (up or down) by 1.8% each day.
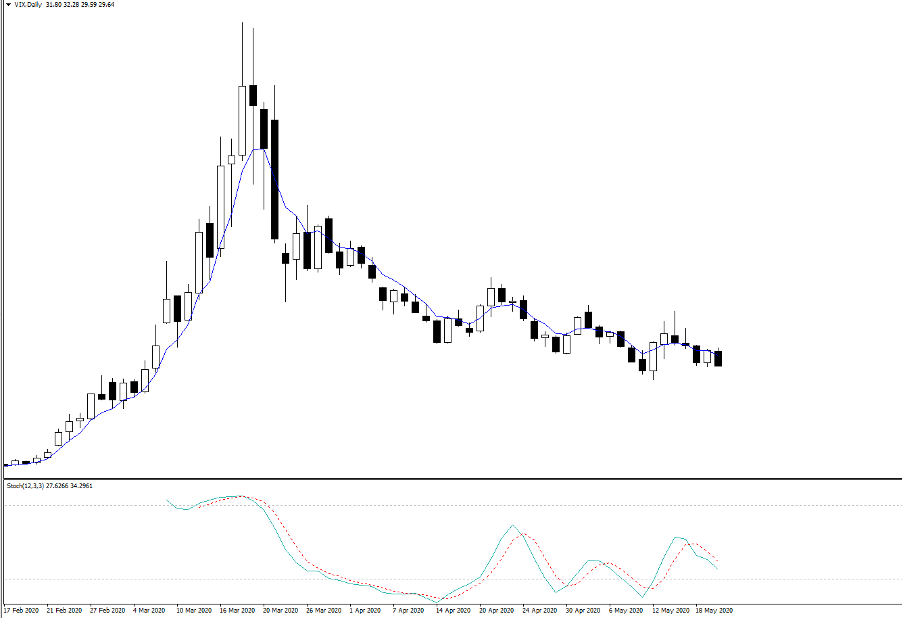
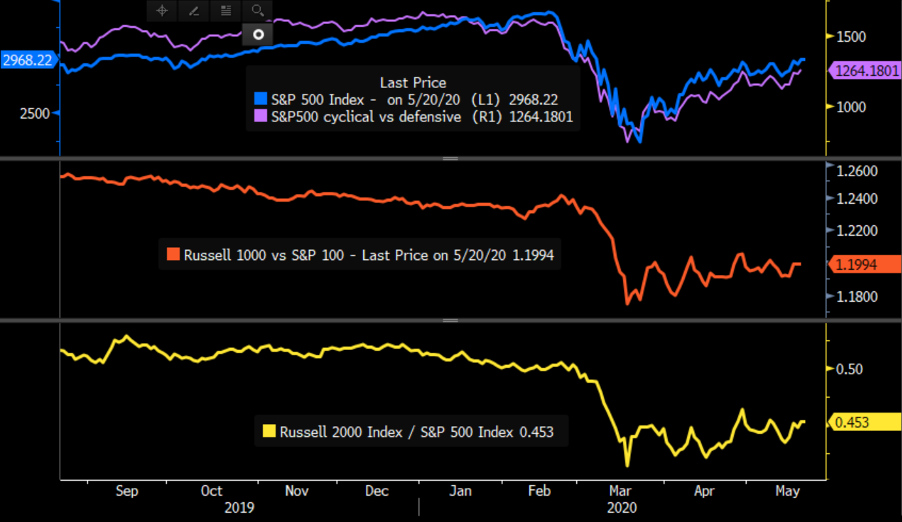
The sheer fact the VIX index (the 30-day implied volatility in the S&P500) is even at these levels despite such strong moves in the S&P500 is impressive. Especially, when we’ve seen good outperformance of cyclicals vs defensives sectors, with small caps starting to look like they are working better than large caps which is a sign of better economics ahead - as is crude.
That said, recently when we see these breakouts it’s when that equities turn, and for those who follow Demark, we saw a 13 sequential count on both the S&P500 and Nasdaq 100 (cash and futures), which can indicate a possible reversal of the trend.
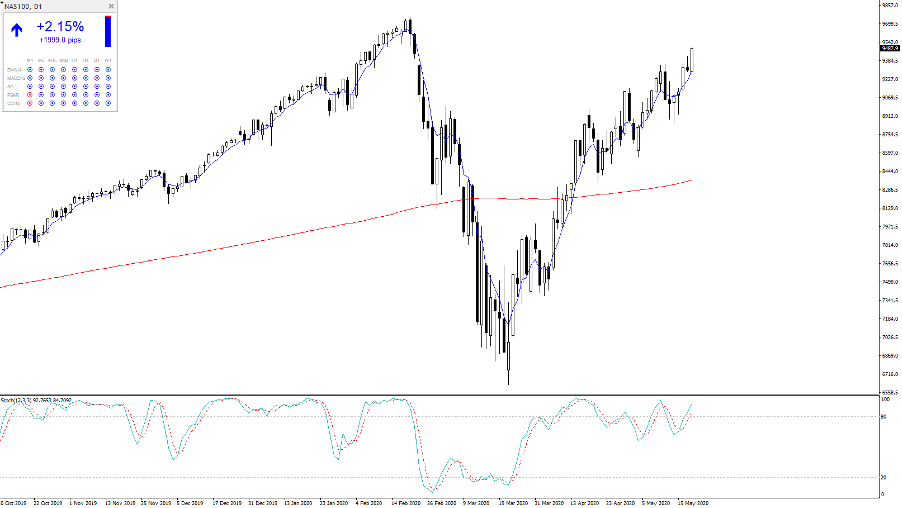
Still, on current price action, the set-up on the daily looks good for the S&P500, and even more so in the NASDAQ 100, where the tech index is a whisker away from a new ATH. Incredible stuff and we are about to see the S&P500 test the 200-day MA, which when we consider it was 27% below the average on 23 March is mean reversion at its most intense. Could the 200-day MA act as resistance? The ASX 200 has 12% to go.
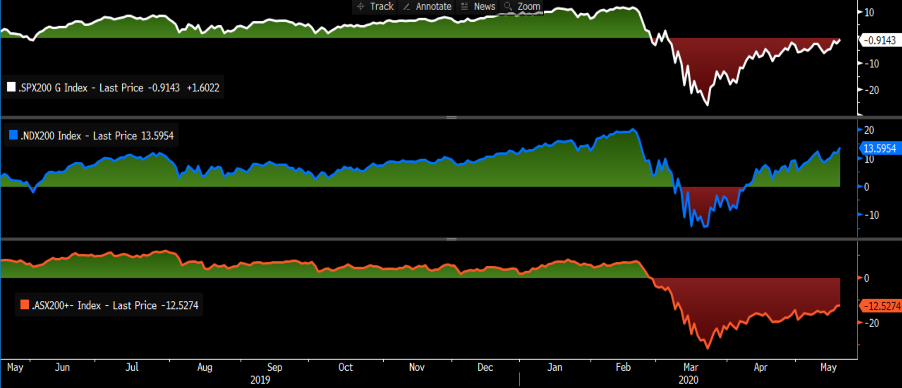
As we see, we can see the NAS100 now 13.6% above its own 200-day, with the market eyeing a new ATH.
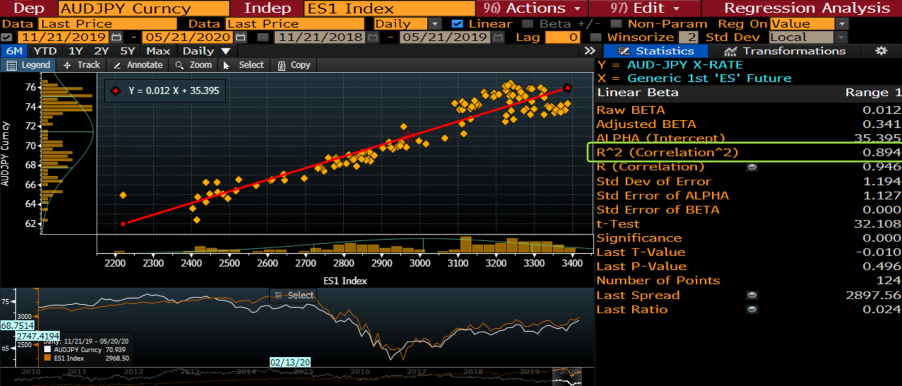
For FX traders’ equities, rates and volatility matters. When the US500 is firing and volatility is pushing lower, we see risk FX working. To provide a statistical understanding, the six-month correlation coefficient between the S&P500 futures and AUDJPY sits at 0.894 – for understanding, 89.4% of the variance in the AUDJPY can be explained by the S&P500 futures. It is not random in any way. So, tell me where the S&P500 is going to go, and I will tell you where risk FX is headed.
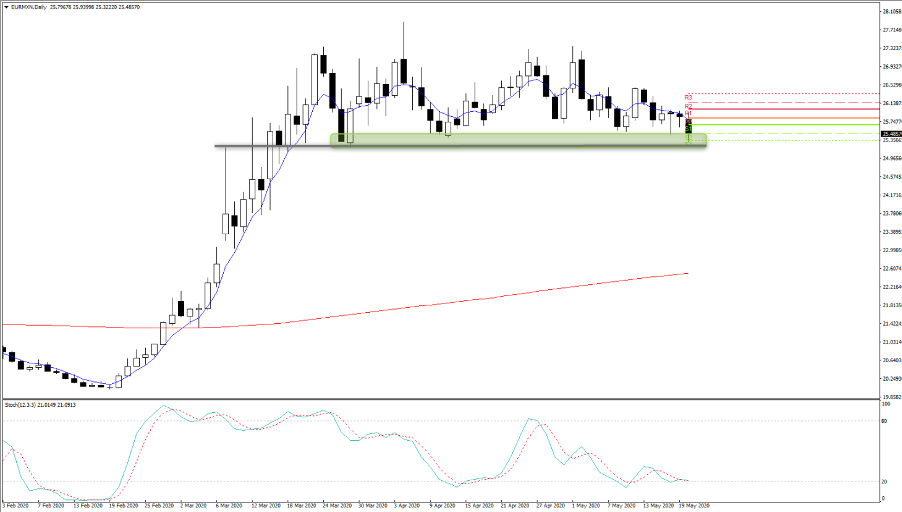
There is little fundamental reason why the ZAR has rallied 2.1% against the JPY, or why MXNJPY has pushed up 1.7% except for pure sentiment. EURMXN has come up on the radar, with carry buyers finding the low FX vol, limited moves in US Treasuries and positive moves in equities working.
GBPMXN is already there and moving lower in the channel – personally, I would hold off from shorts in this cross, with a preference to reload at higher levels as conditions are ST oversold but you can see the trend is progressing nicely.
Ready to trade?
It's quick and easy to get started. Apply in minutes with our simple application process.
The material provided here has not been prepared in accordance with legal requirements designed to promote the independence of investment research and as such is considered to be a marketing communication. Whilst it is not subject to any prohibition on dealing ahead of the dissemination of investment research we will not seek to take any advantage before providing it to our clients.
Pepperstone doesn’t represent that the material provided here is accurate, current or complete, and therefore shouldn’t be relied upon as such. The information, whether from a third party or not, isn’t to be considered as a recommendation; or an offer to buy or sell; or the solicitation of an offer to buy or sell any security, financial product or instrument; or to participate in any particular trading strategy. It does not take into account readers’ financial situation or investment objectives. We advise any readers of this content to seek their own advice. Without the approval of Pepperstone, reproduction or redistribution of this information isn’t permitted.
