5 exciting shares to trade over US Q1 Earnings Season
.jpg?height=93&quality=100)
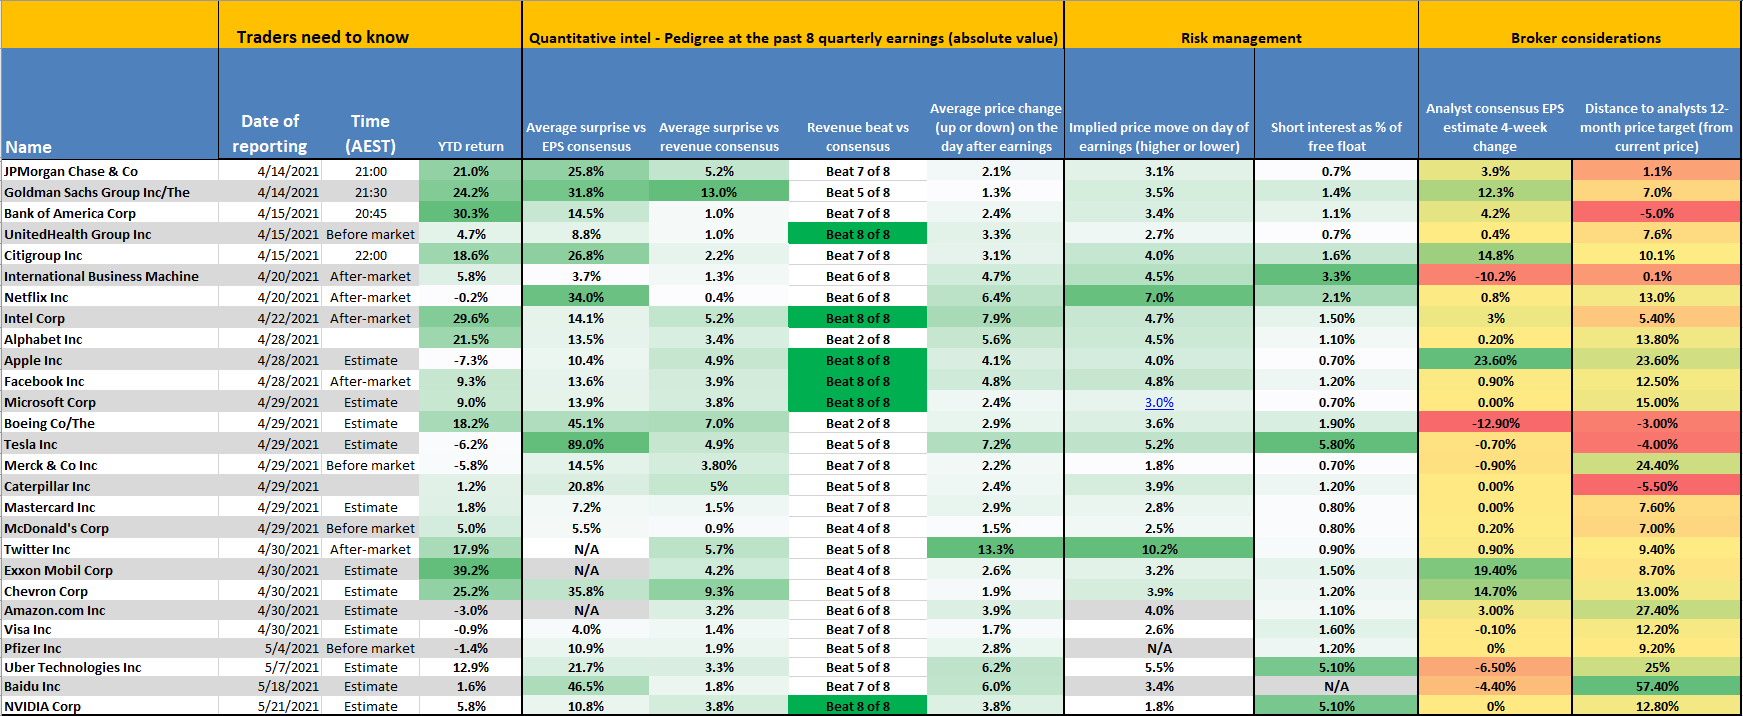
The table above gives a nice overview of key metrics for important US shares. Below we'll take a look at 5 in more detail.
JP Morgan:
Banks are starting to look really interesting as we emerge from the covid induced economic recession. Given that banks are a levered play on the health of the economy, they have a large tailwind behind them with improving US economic data. An accelerated vaccine rollout and massive stimulus is firing up GDP forecasts and the labour market. Longer term yields have been rising as a result, steepening the yield curve in the process which feeds through into better Net Interest Margins (difference between short and long term interest rates) aiding bank profitability. If we see a substantial release of credit loss reserves (which drop straight to the bottom line) combined with punchy revenues from their trading desk operations as a result of the increased asset price volatility seen in Q1 then the stars could really align for JPM. Forward guidance and the outlook given by JPM will also carry weight given their key insights into the health of the economy through their clients’ borrowing and spending data. In addition, the Federal Reserve recently stated restrictions on buybacks and dividend payments would be lifted after June 30. Lastly, banks form part of the cyclical recovery universe of shares and could see some thematic buying helping to propel the share price higher. What you need to watch when earnings drop is if earnings and revenues come in higher or lower vs consensus estimates, I’m expecting consensus beats when JPM reports their results. JPM has beaten consensus earnings estimates 7 times over the previous 8 quarters with an average price move up or down of 2.1%. Results will be released on Wednesday April 14 at 21:00 AEST/12:00 UK time.
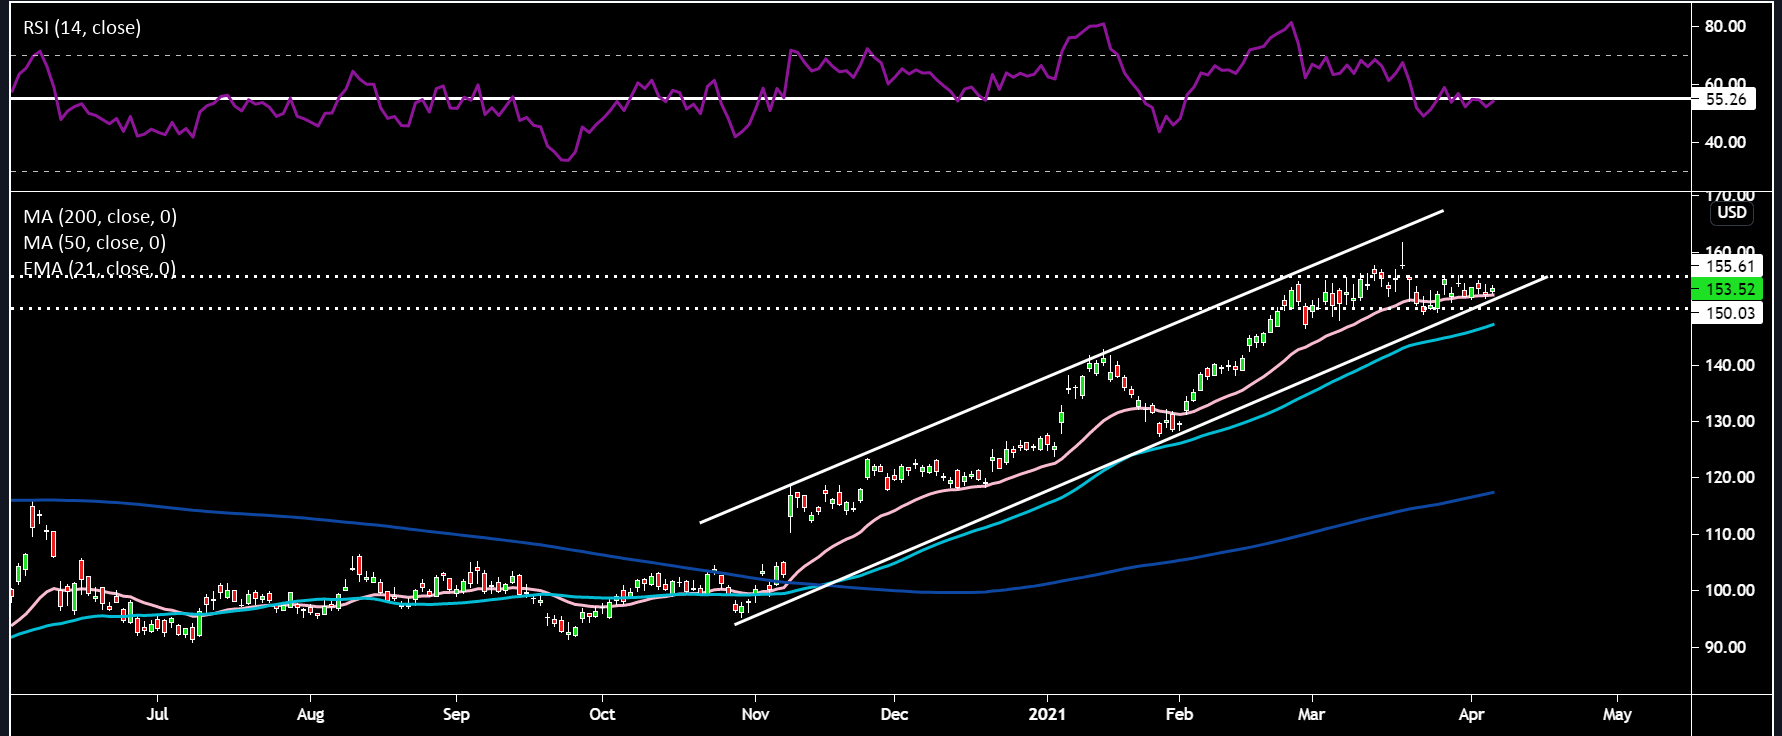
Pink line: 21-day EMA; Light Blue Line: 50-day SMA; Dark Blue Line: 200-day SMA (same for all other charts)
Taking a look at the chart we can see price has been in a nice ascending channel since October last year, with dips into the 21-day EMA being bought. Of late price has been moving sideways in a tight range between $150-155 and is right on the 21-day EMA. This Q1 earnings release could be the catalyst for a breakout from this range. On the downside price has support from the $150 horizontal support, lower line of ascending channel and further below that there is the 50-day SMA around $146. To the upside, the first hurdle to clear is the $155 range resistance with solid earnings bringing the March 18 high into play at $161.69. The RSI is far from overbought territory and just below the 55 resistance level.
Netflix:
A company most of us are very familiar with given it was an important part of our entertainment during lockdown. The streaming giant really needs to bring its A-game as the pandemic draws to an end and consumers begin to get off their couches. User growth (Global net paid subscriber additions) is one of the most important metrics we will receive on April 20, with the company guiding for 6 mln. The market concern is for a potential slowdown in growth due to Covid pulling forward subscribers from future years. Netflix is facing intense competition from the likes of Hulu, HBO Max and Disney+, who will be trying to eat into Netflix’s market share. In terms of recent positives for Netflix: 1) Prices were recently raised in Japan by 13% (a strong growth region) 2) A global prompt message was designed to pop up on users’ screens to try and convert shared accounts into individual paying accounts (potentially boosting new paid subscriber additions) 3) Solid results from a mobile-only strategy rolled out in India, a market with huge potential 4) The expectation of being break-even over 2021 could lead to share buybacks. A negative factor which may hurt global revenues is the strength in the dollar we’ve seen over Q1. Netflix has beaten market earnings expectations 6 of the last 8 quarters. If you’re looking for a big price move, Netflix certainly doesn’t disappoint, with an average move of 6.4% up or down. Results will be released around 06:00 AEST/21:00 UK time (after the US market closes, which you can trade with Pepperstone).
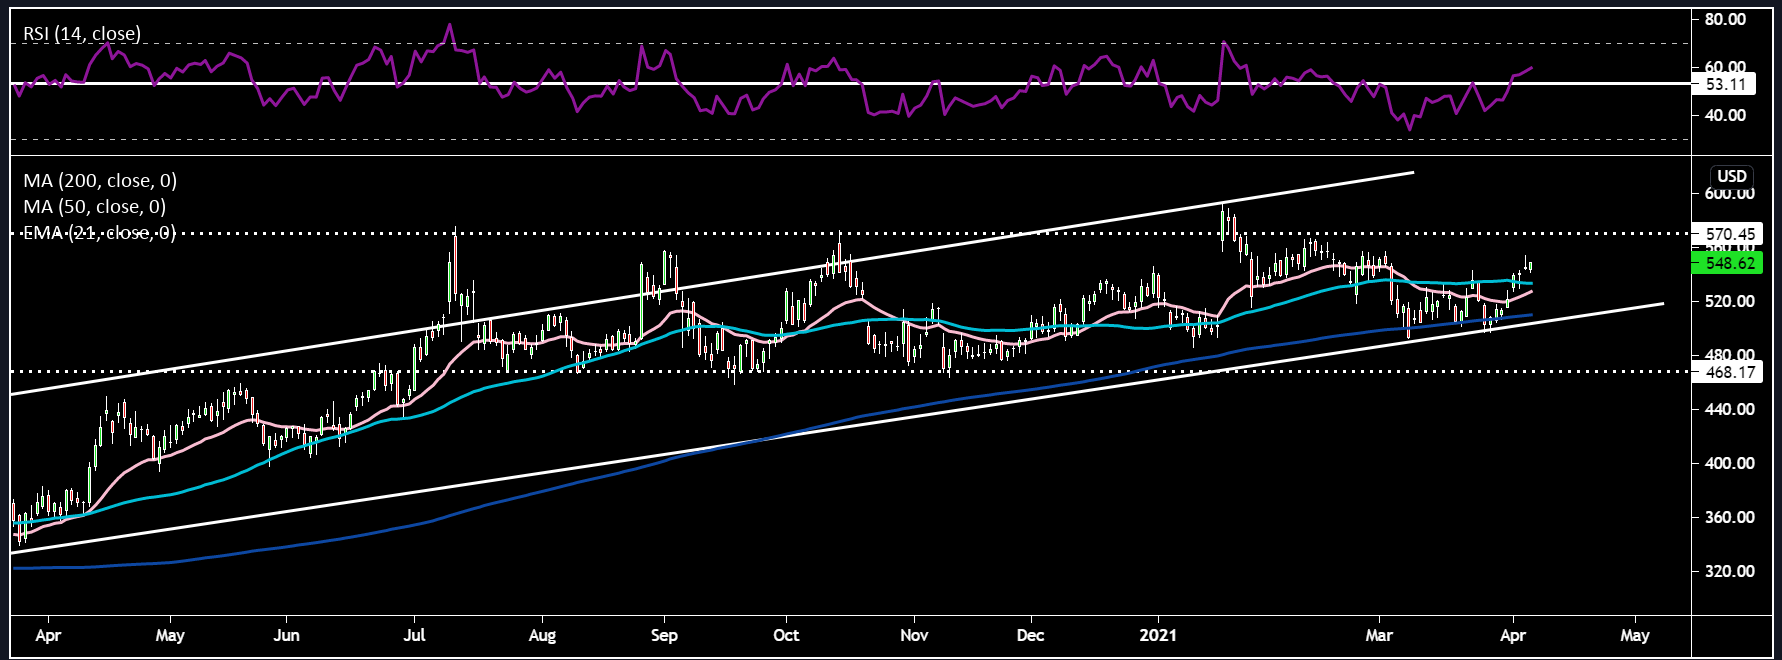
The technicals show that Netflix has been in a range between $470-570 since last year July. It actually looked as if the price candles had formed a triple top pattern over July to October. However, since 2021 price has had a slight tilt to the upside making higher lows, supported by the 200-day SMA and lower line of the ascending channel. The RSI looks like it wants to move higher and is currently above the 53 resistance line, with plenty of room before it becomes overbought. $600 could be well in reach on a strong set of earnings, slightly above the January 20 high of $593.29. A weak set of earnings could see price slide down towards the $500 level – around the 200-day SMA.
Apple:
Apple needs little introduction as a company with its brand globally recognized and holding the title of the largest company in the world on the basis of market capitalization. The share price has been under pressure from the start of this year as longer-term yields have risen, lowering the value of its interest sensitive cash flows. Additionally, the tailwind from the pandemic which encouraged work, learn and play from home is now receding as societies try to get back to normality. However, Joe Biden’s stimulus checks could be used to purchase Apple products as well as the large consumer savings which could be released as the pent-up demand explodes back into the economy. Apple has plans to enter the healthcare industry as well as autonomous driving, which are exciting growth areas for the company. The CFO recently reiterated Apple’s commitment of reaching a net cash neutral position over time, which means more returns of capital to shareholders. Apple is well positioned to take advantage of a significant upgrade cycle due to one of the biggest new tech trends – 5G. Besides rising rates, there is a risk of Apple having to cut its App Store commission fees for developers. Hopefully Apple will provide guidance on its outlook for future quarters as investors have been left in the dark due to the uncertainty of the pandemic in previous quarters. Apple has a strong history of beating earnings estimates, currently 8 out of the previous 8 quarters. In terms of the kind of price move we can expect, the average move is 4.1%. As it stands results will be released at 06:30 AEST/21:30 UK Time just after the US market closes.
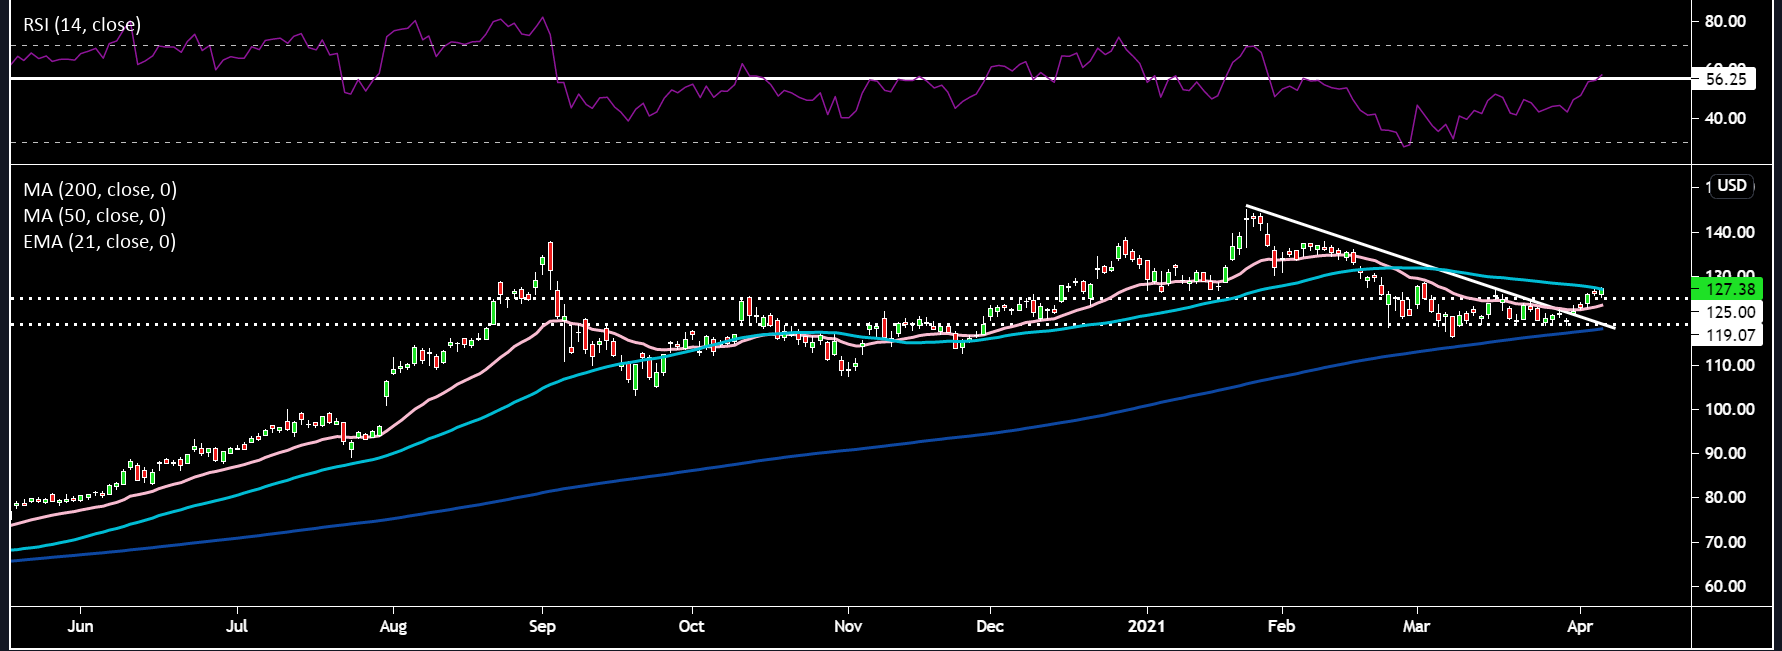
Apple’s share price has moved sideways since the end of February, sticking to a tight range of $120-125. Recently, price has broken through the mini downtrend line and the range. It looks as if Apple wants to have a go at the $130 level just above the 50-day SMA. The RSI is also pushing higher and trying to overcome the 56 resistance. A strong Q2 earnings release would help in this department. The shorter-term 21-day EMA is also curling back upwards, signal of bullish intent. Could price get back up to January high levels of $145 or are we set for a move lower towards $120 or worse $115?
Tesla:
Tesla just last Friday shot up as a reaction to the news that 184.8k vehicles had been delivered, beating market estimates of 168k vehicles comfortably. Going into China looks like a savvy business decision by Musk, with the an entry also into another high growth region, India, likely to come soon. However, if trade tensions begin to pick up again between the US and China, it could create some problems for Tesla’s sales in China. Those delivery numbers are quite commendable I must say, especially as there is a global semi-conductor chip shortage which led to the closure of Tesla’s US factory going offline for 2 weeks. Are we on the precipice of a new green energy revolution sweeping across the globe? It certainly looks that way, with millennials now coming into their prime purchasing power years and climate change concerns being front and centre for them, Tesla will only benefit. Additionally, President Biden’s new climate friendly infrastructure goals alongside more supportive regulation (EV tax credit change etc) works in Tesla’s favour. However, competition is heating up in this space with Volkswagen recently stating they’re making a big push into the EV market. However, given the size of the mobility market, there is enough cool-aid to go round for everyone, but I still believe Tesla will take the Lion’s share given its first mover advantage and cult like following behind Elon Musk or should I call him technoking? Lastly, Tesla also announced a purchase of Bitcoin worth $1.5 billion and the ability for customers to pay for their cars using Bitcoin. Tesla has beaten 5 out of its last 8 quarterly earnings estimates and boasts an average move on the day of 7.2% The Q1 earnings release date is currently being estimated for April 29.
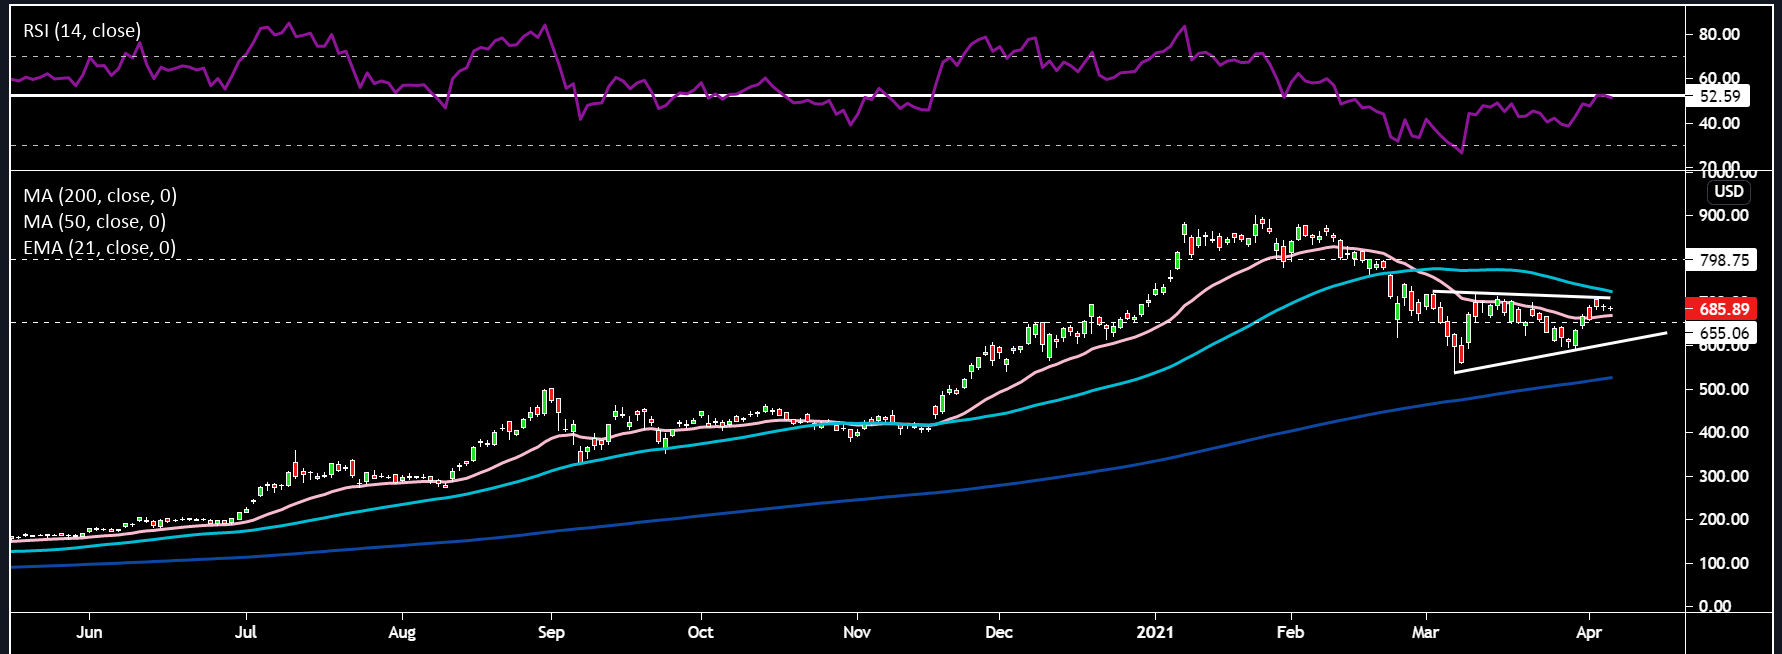
The technicals indicate a bit of indecision with the upcoming results potentially being the catalyst for price to decide its next direction of choice. Price broke below its 50-day SMA back in late February and saw the shorter term 21-day EMA cross below the 50-day SMA. Price has formed a triangle like pattern with rising lows and falling highs. A breakout in either direction can occur with patterns like this. The RSI looks to be modestly rolling over at the 52 resistance level, which will need to be overcome for the bulls to see further gains. On dips in price I’d watch around the $655 support level and the lower line of the triangle pattern. Above I’d look towards the 50-day SMA as an initial price target around $726 and then the horizontal dotted white line at $800.
Amazon:
Amazon another company which I’m sure many of us became intimately familiar with during lockdown as retail shops remained shut. As a result Amazon produced superb results over last year. The question that some are asking now is, with more people wanting to spend at outdoor shops after being held up in their houses could this see a slowdown in sales for Amazon. Potentially over the next few quarters yes, but I think e-commerce is definitely here to stay given its convenience for certain products. Biden’s stimulus checks should see some decent spending flowing Amazon’s way. Additionally, there are many regions globally that have low online shopping penetration rates providing green shoots for Amazon’s growth profile going forward. We also saw a change of the guard as Jeff Bezos hands over the reigns to Andy Jassy (former head of Amazon cloud business) and assumes the role of executive chairman by Q3. This could be an indication of more focus being placed on Amazon’s very dominant and high growth cloud business. In an attempt to have more of a physical presence, Amazon has been gradually opening up its own grocery stores (Amazon Fresh) in addition to the Whole Foods chains. A risk to Amazon’s share price is its high growth cash flows being hit by increasing yields as well as looming regulatory risk given their size. In terms of prior earnings beats, Amazon has achieved beats on 6 out of its previous 8 quarters, seeing price bob up and down by an average 3.9%. Results are estimated to be released on April 30.
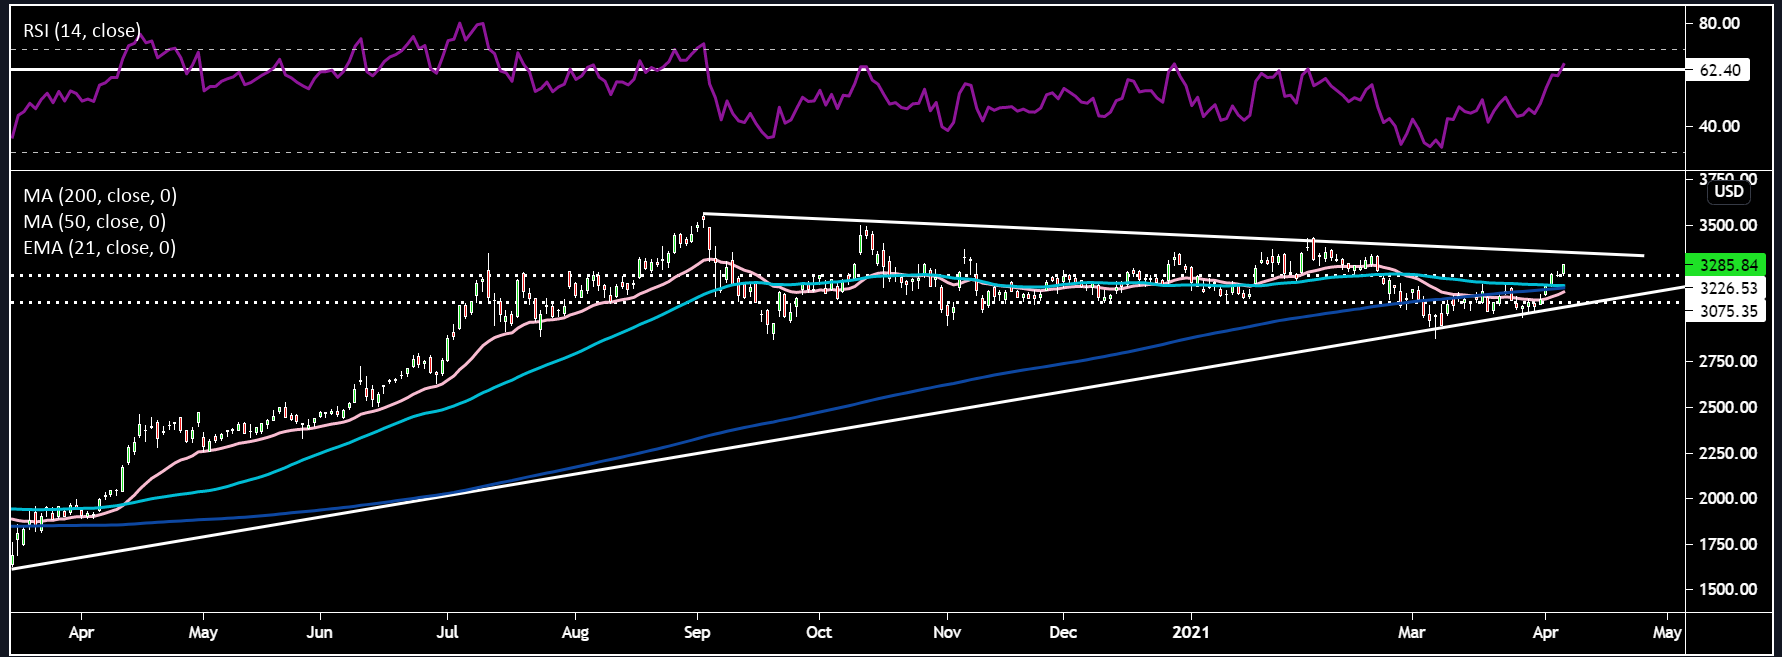
Price action has been sideways/slightly downwards since the 2020 September highs of $3550. Earnings results will have to be strong if price is to break above the downtrend line around $3350. Above that, price would need to take out February’s high around $3430 to make a push towards $3500. The RSI is right up against the 62 resistance which has marked previous peaks in price rallies, so the bulls need to monitor what happens here. The 50-day SMA is only just above the 200-day SMA, which if it drops below will make the dreaded death cross – which usually points to price declines. Price has recently broken up through the range resistance of $3225 and the shorter term 21-day EMA is curling back up. Price pullbacks should find some support around the $3075 range support and $3050 (uptrend line) areas, with slices through these potentially leading to deeper sell-offs.
Related articles

The material provided here has not been prepared in accordance with legal requirements designed to promote the independence of investment research and as such is considered to be a marketing communication. Whilst it is not subject to any prohibition on dealing ahead of the dissemination of investment research we will not seek to take any advantage before providing it to our clients.
Pepperstone doesn’t represent that the material provided here is accurate, current or complete, and therefore shouldn’t be relied upon as such. The information, whether from a third party or not, isn’t to be considered as a recommendation; or an offer to buy or sell; or the solicitation of an offer to buy or sell any security, financial product or instrument; or to participate in any particular trading strategy. It does not take into account readers’ financial situation or investment objectives. We advise any readers of this content to seek their own advice. Without the approval of Pepperstone, reproduction or redistribution of this information isn’t permitted.