What is a moving average, and how can I use it in my trading?
Moving averages smooth out price data, helping you identify trends by averaging an asset’s past prices over a set period.

Introduction to moving averages
A moving average (MA) is a technical indicator that is represented as a line on financial charts. It is used to filter out market noise making it easier to focus on underlying trends and spot a market’s overall trend direction and potential trade signals.
You can use moving averages to:
- Identify trends: Distinguishing between bullish and bearish markets.
- Generate trade signals: Crossovers between short-term and long-term MAs help determine entry and exit points.
- Provide dynamic support and resistance levels: Acting as price guides in trending markets.
The term ‘moving average’ comes from the way old prices are replaced with new ones, causing the MA line to shift over time. It’s also called a lagging indicator because it follows the price movements of an asset, helping smooth out short-term ups and downs.
Types of moving averages and their differences
There are different moving averages, each serving a unique function depending on trading style and market conditions.
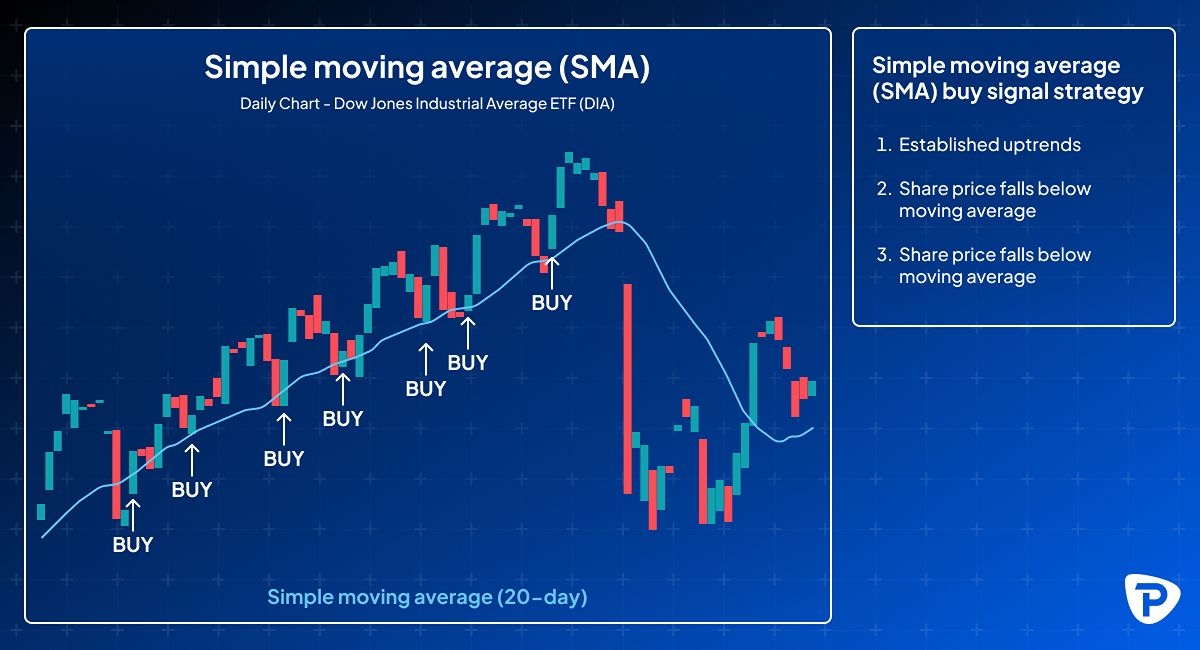
Simple moving average (SMA)
The simple moving average (SMA) is recognised as one of the earliest types of moving averages and the most popular one used in technical analysis because it’s straightforward and easy to use.
This type of average is calculated by adding the data points for the selected time and dividing by the total number of periods. It gives equal weight to each data point and is typically based on closing prices, though other values like opening or median prices can also be used depending on the strategy. The average changes with time, and the oldest number in the series is removed when a new period is introduced.
For example, the five-hour SMA calculated from an hourly chart would be the closing price of the previous five hours divided by five. Typically, the greater the SMA duration, the further it lags current price activity. A 30-period SMA will have less movement than a 5-period SMA.
_formula_detailing_equal_weight_of_price_values_over_specified_periods.jpg)
How to use SMAs:
- Long-term trend analysis
The 200-day SMA line shows the average price over the past 200 days, helping you see the overall market direction. If the price is above the 200-day SMA, the market is likely in an uptrend. If the price is below, it may be in a downtrend. Long-term traders use this to decide whether to stay in the market or wait for a better entry point. - Support and resistance
The 50-day SMA often acts as a dynamic support or resistance level. In an uptrend, prices may bounce off the 50-day SMA – acting as a support. In a downtrend, prices may struggle to rise above it— acting as a resistance. Traders use this to plan their entry and exit points. If price bounces off the 50-day SMA, it might be a good time to buy (in an uptrend) or sell (in a downtrend). - Trend reversals
A break below the 200-day SMA can signal a potential shift from bullish to bearish sentiment. If the price drops below the 200-day SMA and stays there, it may indicate a new downtrend. This helps avoid holding onto losing positions and prepare for market shifts.
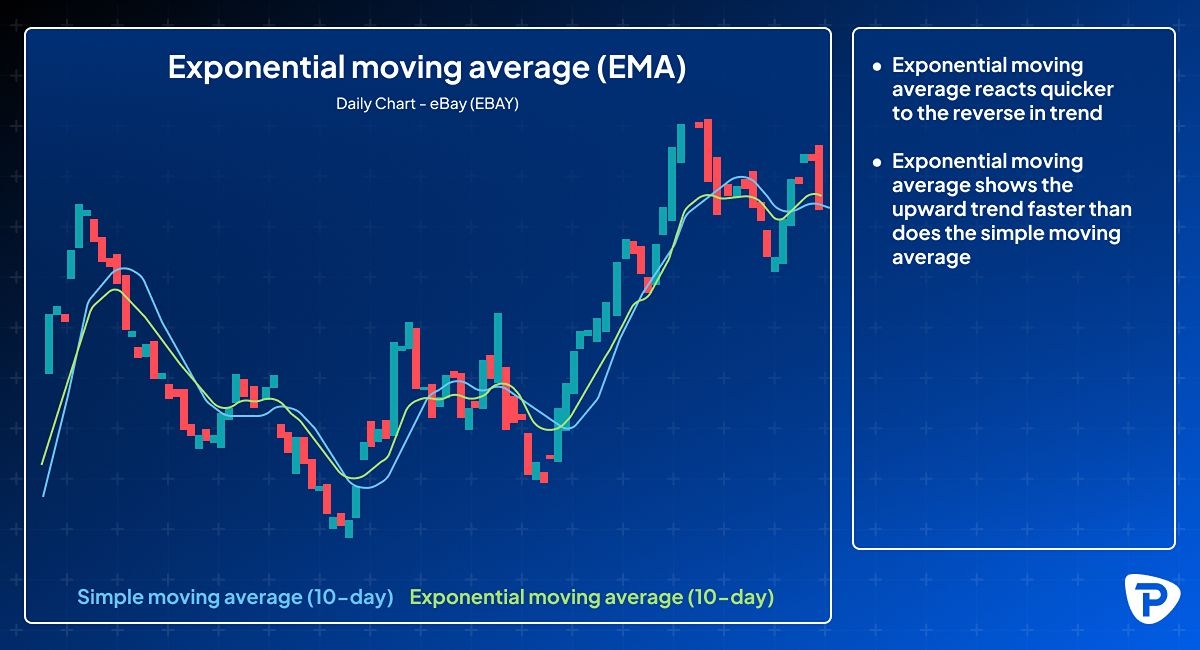
Exponential moving average (EMA)
Unlike the simple moving average (SMA), which calculates an asset's average price over time, the EMA focuses on the most recent values. This is the primary distinction between the two, and it explains why many traders prefer the EMA because it is more responsive than the SMA. However, as with most technical indicators, the EMA performs best when utilised in conjunction with its component (SMA) rather than on its own.
_with_definitions_for_recent_price_previous_EMA_and_weight_highlighted.jpg)
How to apply EMAs to different trading styles:
- Short-term trading
The 5-day and 10-day EMAs react quickly to price changes, helping scalpers and day traders spot short-term reversals or entry points. If the price crosses above the 5-day EMA, it may signal a quick upward move. If it drops below, it could mean a short-term decline. It’s always important to combine them with volume or candlestick patterns for confirmation. - Momentum trading
The 21-day EMA helps identify whether a trend has strength or is losing steam. If the price stays above the 21-day EMA, it suggests strong bullish momentum. If it dips below, momentum may be fading. - Swing trading
The 50-day EMA helps swing traders catch medium-term moves, spot trend continuation or early signs of reversal. If the price pulls back to the 50-day EMA and holds, it may be a good entry point. A break below could signal a trend change. For better entry and exit timing, you can combine it with support/resistance zones or RSI.
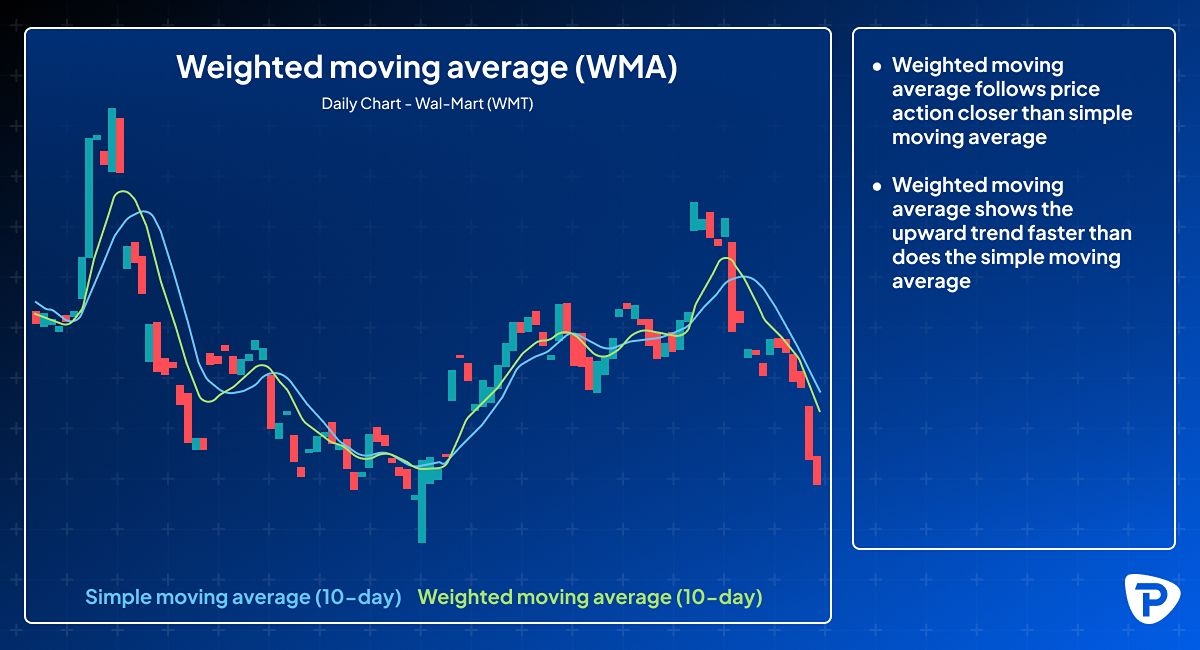
Weighted moving average (WMA)
The WMA places more weight on recent data points, making it more responsive to current market conditions and useful for short-term trading strategies. Since the most recent data significantly impacts the direction of the line, the WMA tracks prices more closely than a SMA. WMAs are best for active traders who want faster signals than SMAs but less noise than EMAs.
The moving average formula multiplies each input by a weighting factor determined by the period under consideration. WMAs are more relevant to the current price movement because they prioritise the most recent data points. However, the algorithm can be modified to give more weight to past data if you are looking for long-term price trends or want to downplay recent volatility.
_using_values_P1_to_P5_and_their_corresponding_weights.jpg)
How to apply WMAs to different trading styles:
- Ultra-short-term strategies
The 10-day and 20-day WMAs can be used by scalpers and day traders to help them react quickly to price changes while filtering out random fluctuations. If price crosses above the WMA, it may signal a short-term uptrend. A drop below it, could suggest a quick reversal. - Clearer signals and no distractions
WMAs respond to recent price changes and reduce the ‘choppiness’ and noise seen in faster moving averages. This makes them ideal for those who want clearer signals without reacting to every small price move allowing them to stay focused on the bigger picture. - Algorithmic trading
WMAs are often built into automated trading systems because they offer a balance of responsiveness and stability. Algorithms use WMAs to trigger buy/sell signals based on price behaviour.
Smoothed moving average (SMMA)
The smoothed moving average (SMMA) is intended to smooth out price data over a longer period, making it less vulnerable to short-term volatility than other moving averages. The SMMA considers all accessible data points, meaning that older data points are never completely deleted from the calculation but have a decreasing impact over time. This produces a smoother line that mitigates the effects of short-term changes and provides a clearer picture of the underlying trend.
_with_definitions_for_variables_used._Background_is_blue_gradient.jpg)
How to apply SMMAs to different trading styles:
- Spotting long-term trends
A 200-period SMMA filters out short-term volatility and shows the overall market direction.
If the price stays above the 200-period SMMA, the market is likely in an uptrend.
If it’s below, it may be in a downtrend. - Avoiding fake breakouts
SMMAs in swing trading help reduce false signals caused by sudden price spikes or short-term volatility. If price breaks above a resistance level but doesn’t hold above the SMMA, it might be a fake breakout. You can use SMMAs to confirm whether a breakout is real or just noise. - Confirming trends with other indicators
You can SMMAs alongside EMAs or RSI. While EMAs react quickly to price changes, SMMAs provide a steadier view, and both can help confirm the strength and direction of a trend. If both EMAs and SMMAs point in the same direction, it could potentially add confidence to your trade setup.
How do moving averages identify trends and reversals?
Moving averages are trend-following indicators because they show where the market has been heading over time. Here’s how you can interpret them during different price conditions:
- Uptrend: When the price stays above the moving average, it usually means the market is going up. This suggests buyers are in control.
- Downtrend: When the price stays below the moving average, it often signals a downward trend. This means sellers are stronger.
- Trend reversals: A trend might be changing if:
The slope (the direction in which the line is moving on a chart) of the moving average starts to turn in the opposite direction.
A crossover happens, when a short-term moving average crosses above or below a longer-term one (eg 50-day crossing the 200-day).
These signals help you decide when to enter or exit trades, or when to stay out of the market.
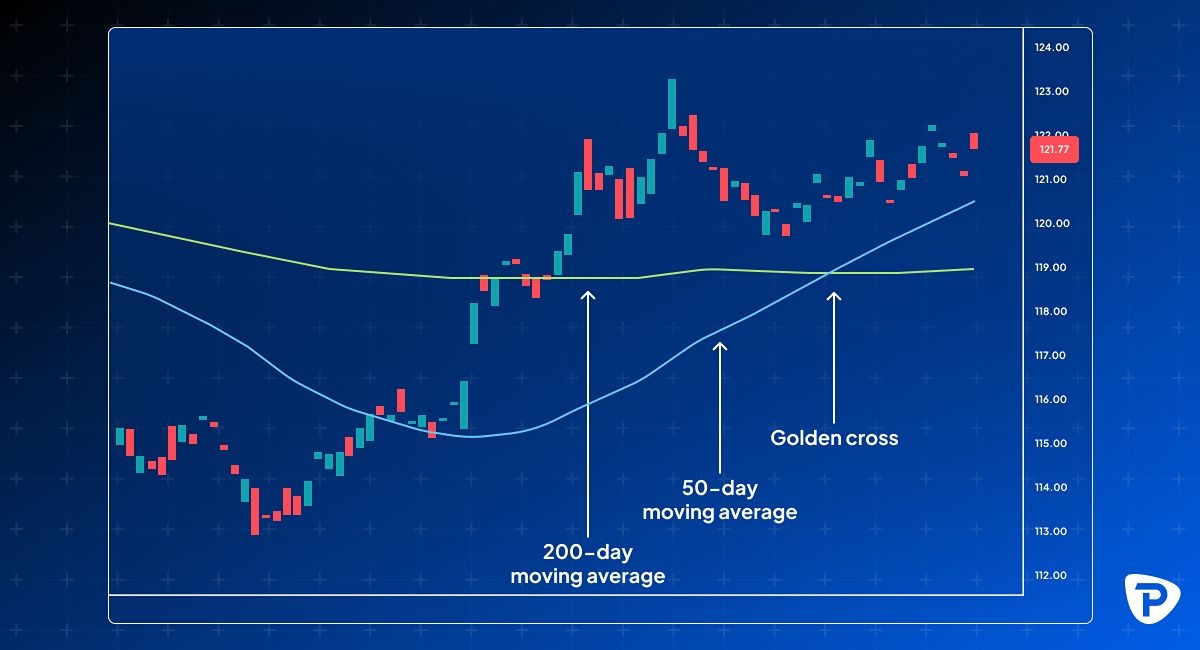
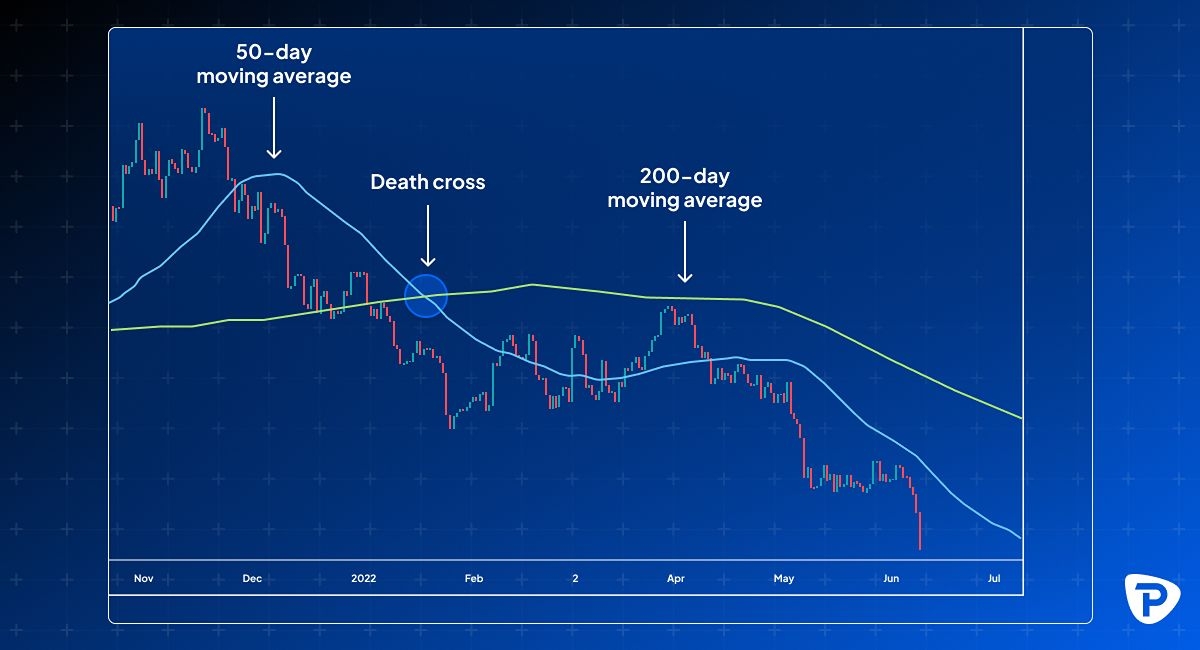
Golden cross and death cross patterns in MA
The golden cross is formed when a short-term moving average crosses over a long-term moving average to the upside. This happens when the short-term average rises faster than the long-term average until they cross. Analysts and traders perceive this as a definitive bullish shift in the market.
A golden cross consists of three stages:
- Ending the downtrend
The market is in a downward phase, but selling pressure gradually fades. This stage signals that the decline is losing momentum and buyers may begin to step in. - The crossover
The short-term moving average (like the 50-day) rises and crosses above the long-term moving average (like the 200-day). This crossover is the core of the golden cross and is seen as a bullish signal. - Start of the uptrend
After the crossover, the market typically enters an uptrend, with prices starting to rise steadily. Traders look for confirmation through higher highs and increased volume.
The death cross is the exact opposite of the golden cross, signalling a downturn in a market. It occurs when the short-term average trends down and crosses the long-term average— basically the opposite of a golden cross, signalling a potential bearish reversal
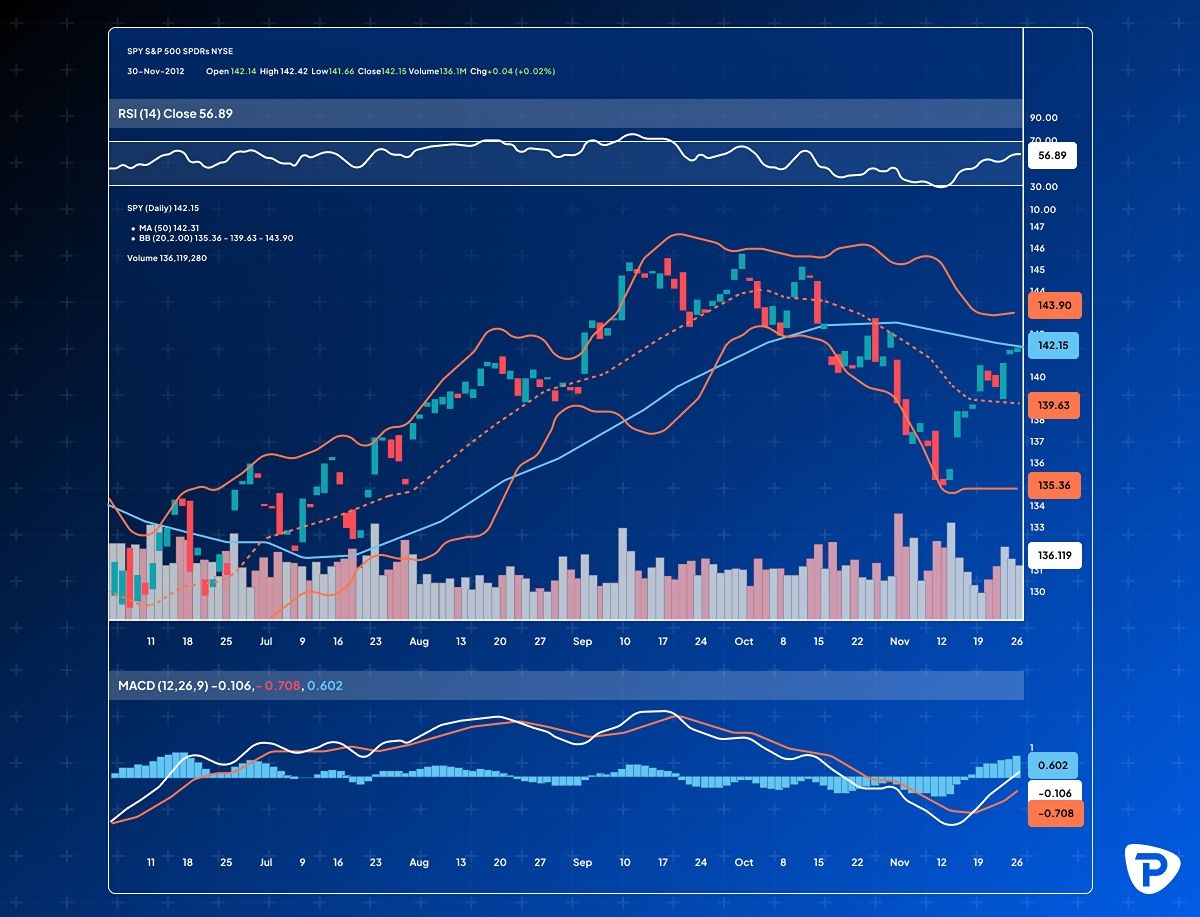
Combining moving averages with other indicators
To reduce false signals and improve accuracy, it is recommended to combine moving averages with other indicators:
- RSI (Relative strength index)
What it does: Measures how fast and how far a price has moved recently.
Why it helps: It shows whether an asset is overbought (price may drop soon) or oversold (price may rise).
How to use it: If a moving average suggests a buy, and RSI shows the asset is oversold, it adds confidence to the trade. - MACD (Moving average convergence divergence)
What it does: Tracks the relationship between two moving averages to measure momentum.
Why it helps: It confirms whether a trend is gaining or losing strength.
How to use it: If a moving average crossover occurs and MACD also crosses its signal line, it strengthens the signal. - Bollinger bands
What it does: Plots bands - drawing two curved lines - around a moving average to show volatility.
Why it helps: It identifies when the market is quiet (bands narrow) or active (bands widen).
How to use it: If price breaks out of the bands and aligns with a moving average signal, it may indicate a strong move.
What is a moving average ribbon?
The moving average ribbon is a technical analysis tool that uses multiple moving averages to assess price trends and market direction. This method involves plotting a series of moving averages with different timeframes, typically short-term to long-term periods, to create a visual representation of trend strength and momentum.
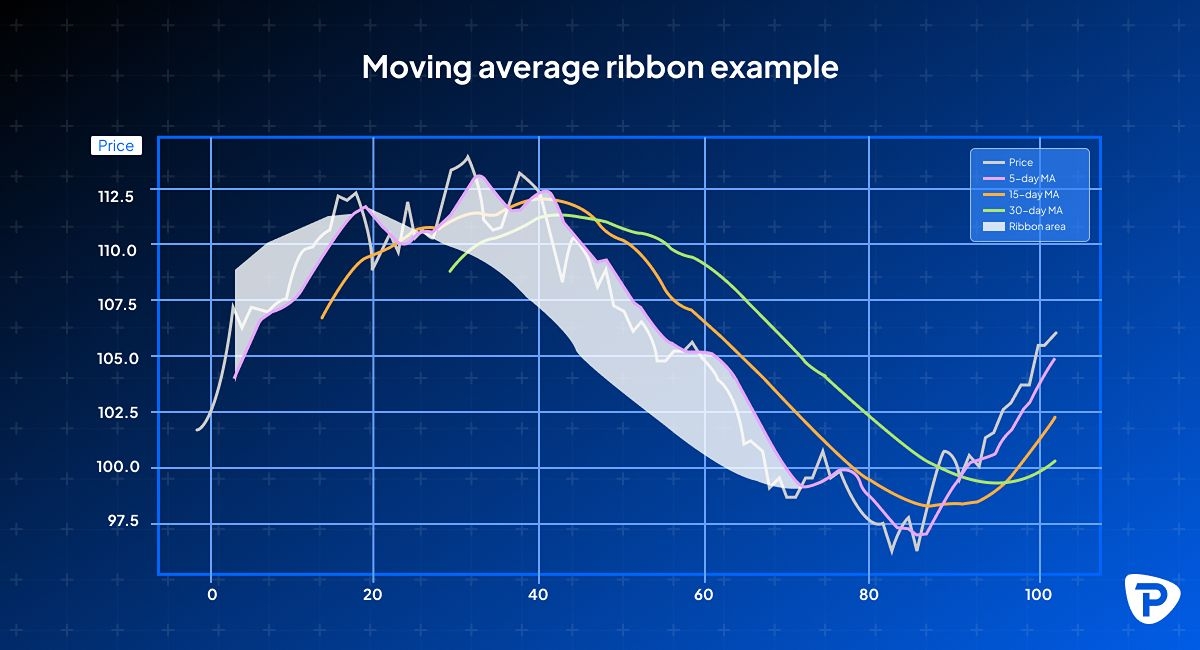
To apply this strategy, you can place several simple moving averages or exponential moving averages on a price chart. The selection of timeframes varies depending on your approach and market conditions. Commonly used periods include 10, 20, 30, 50, and 100 days, though you may adjust them to suit your specific strategies.
The key principle of the moving average ribbon is to analyse the alignment and spacing of the moving averages:
- Uptrend: When short-term moving averages are positioned above long-term ones and spaced out evenly, it shows the market is moving strongly upward.
- Downtrend: When long-term moving averages are positioned above short-term ones and spread evenly apart, it signals a strong downward movement.
Watch for crossovers, contractions, or expansions within the ribbon, as these changes may indicate potential trend reversals or continuations. When the moving averages begin to converge, it could suggest weakening momentum and a possible shift in market direction.
_overlay_price_candlesticks._Arrows_indicate_buy_when_EMAs_cross_upwards_and_sell_when_they_cross_down.jpg)
Moving averages in algorithmic and automated trading
Moving averages (MAs) are widely used in automated trading systems by large financial institutions and hedge funds to build strategies and help identify market trends and make trading decisions.
- High-frequency trading (HFT) firms use short-term EMAs to identify quick momentum changes and act instantly.
- AI-powered trading systems combine MAs with big data analysis for precision trading.
- Systematic trading funds which follow strict rules rather than human judgment, often rely on weighted moving averages to track and follow long-term market trends.
Risks of trading CFDs using moving averages
While moving averages are a popular technical analysis tool in CFD trading, they come with their own limitations and without confirmation from other indicators, they carry various risks:
- Lagging indicator: Moving averages are based on past price date, so they react after price movements occur, often giving signals too late, when the best entry or exit point has passed.
- Over-reliance: Using them alone or applying only one type of MA without confirming with other tools or technical and fundamental indicators can result in poor decision-making.
- False signals: In choppy or sideways markets, moving averages misinterpret short-term price fluctuations as trend changes, triggering unnecessary trades and eventually potential losses.
- Not ideal for all market conditions: Moving averages work better in trending markets and can be unreliable when the market lacks a clear direction.
- Whipsaws: In volatile markets, moving averages can cause whipsaws, quick shifts between buy and sell signals that don’t hold. These are often due to false crossovers, where a signal appears to show a trend but quickly reverses, leading to confusing trades and possible losses.
- Wrong time frames: Moving averages don’t work the same for every asset or market condition. Picking the wrong time frame, like too short or too long, can give poor signals.
- Leverage: CFD trading uses leverage, which magnifies both gains and losses. Relying too much on moving averages, especially without solid risk management can lead to heavy losses in fast-moving markets.
How to optimise your technical analysis using MAs
- Choose the right MA type: EMAs are generally better for short-term trading to get a broader view of trends. SMAs suit long-term analysis, allowing you to react faster to price changes.
- Choose the right time frame: Pick the time frame that fits your trading style. Shorter period MAs (like 10 or 20 days) respond faster but can be noisy. Longer period MAs (like 50 or 200 days) are smoother but slower.
- Combine multiple MAs: Using two or more MAs can help you spot trend changes more clearly. When they cross over each other, it can possibly signal a shift in market direction, making your analysis more reliable than using just one MA.
- Use MAs with other indicators: Don’t rely on moving averages alone. Combine them with tools like RSI, MACD, or volume analysis to validate signals and reduce false trades.
- Backtest your setup: Before using any MA strategy live, fist test it using past price data. This helps you understand how it performs and avoid unpleasant surprises.
- Review and refine your MAs: It’s essential to regularly review your moving average settings to ensure they still align with current market conditions. What worked in the past may not perform well in a changing market.
How to start trading CFDs using moving averages
CFD trading enables you to speculate on the price movements of various assets such as forex, shares, indices and more, without actually owning the asset. Incorporating moving averages into your CFD strategy can simplify data and provide valuable insights into market direction and momentum.
To get started, follow these steps:
- Perform research to ensure you understand the potential market impact.
- Open a Pepperstone account by following our four-step application process.
- Search for the markets you want to trade.
- Set up your charting tools and apply MAs. Locate them on the platform’s indicator list and choose your preferred time frame to start analysing trends.
- Open your position, set your contract size, risk management orders and get familiar with the relevant fees.
How to set up moving averages on trading platforms (MetaTrader & TradingView)
On MetaTrader (MT4/MT5)
- Open MT4 or MT5 and select the chart you want to analyse.
- In the top menu, click Insert > Indicators > Trend > Moving average.
- In the settings window:
• Choose the period (e.g. 50 for a 50-day SMA).
• Select the MA type (SMA, EMA, WMA, or SMMA).
• Apply to: Select the price type (e.g. Close, Open, High, Low). - Adjust the colour and line thickness for clarity.
- Click OK, and the moving average will appear on the chart.
On TradingView
- Open TradingView and select an asset/chart you want to analyse.
- Click on ‘indicators’ at the top of the screen.
- Search for ‘moving average’ and select the one you want (SMA, EMA, etc.).
- Once added to the chart, click on the settings icon next to the indicator name.
- Adjust the settings (length, style, and colour) to your preference.
- Click OK, and your moving average is added.
Conclusion
Moving averages are among the most effective technical indicators. They allow you to identify market trends and reversals, generate buy and sell signals through crossovers and enhance your risk management by defining dynamic stop-loss levels.
However, they should not be used alone since they work best when combined with other indicators and market analysis techniques. Understanding how to use SMAs, EMAs, WMAs, and SMMAs can help you develop robust strategies that cut through the chart noise, simplifying useful price data and improving your decision-making.
The material provided here has not been prepared in accordance with legal requirements designed to promote the independence of investment research and as such is considered to be a marketing communication. Whilst it is not subject to any prohibition on dealing ahead of the dissemination of investment research we will not seek to take any advantage before providing it to our clients.
Pepperstone doesn’t represent that the material provided here is accurate, current or complete, and therefore shouldn’t be relied upon as such. The information, whether from a third party or not, isn’t to be considered as a recommendation; or an offer to buy or sell; or the solicitation of an offer to buy or sell any security, financial product or instrument; or to participate in any particular trading strategy. It does not take into account readers’ financial situation or investment objectives. We advise any readers of this content to seek their own advice. Without the approval of Pepperstone, reproduction or redistribution of this information isn’t permitted.