Pepperstone logo
Pepperstone logo
  • English
  • Ways to trade

    Pricing

    Trading accounts

    Premium clients

    Refer a friend

    Active trader program

    Trading hours

    24-hour trading

    Maintenance

  • Trading platforms

    Trading platforms

    TradingView

    Pepperstone platform

    MetaTrader 5

    MetaTrader 4

    CopyTrading

    cTrader

    Trading integrations

    Trading tools

  • Markets

    Markets to trade

    Forex

    Shares

    ETFs

    Indices

    Commodities

    Currency Indices

    Dividends for index CFDs

    Dividends for share CFDs

    CFD forwards

  • Market analysis

    Market news

    Navigating markets

    The Daily Fix

  • Learn to trade

    Trading guides

    CFD trading

    Copy trading

    Forex trading

    Commodity trading

    Stock trading

    Technical analysis

    Day trading

    Scalping trading

    Upcoming IPOs

    Gold trading

    Oil trading

    Webinars

  • Partners

  • About us

  • Help and support

  • English

Learn to trade

Trading

Should you add FAANG to your portfolio?

Pepperstone
Pepperstone
Trading Guides
Oct 6, 2022
Share

The Big Five

Who are the Big Five? FAANG is an acronym for the five largest big tech companies in the United States. Facebook, now known as Meta Platforms (META), Amazon (AMZN), Apple (AAPL), Netflix (NFLX) and Alphabet (GOOG), previously known as Google.  

They have a combined market cap of $5.448 trillion (as of the 23/09/2022).

Preview

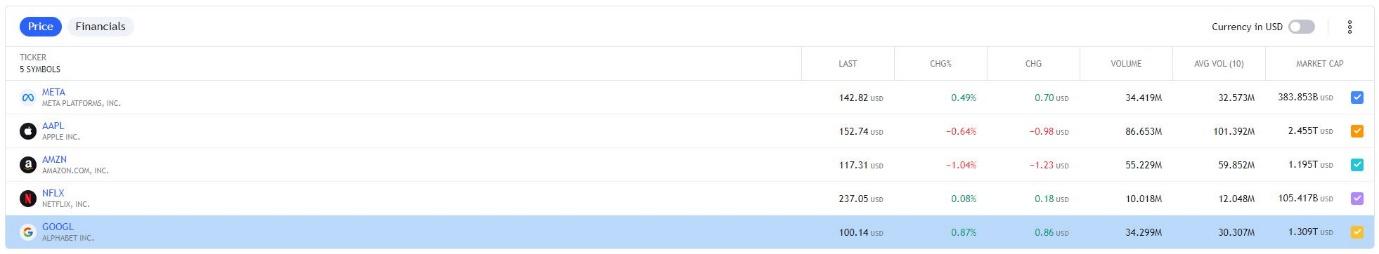
Figure 1 TradingView FAANG 23/09/22

FAANG price comparisons for 2021

Apple is the only FAANG company that has posted an increase in share value for the last 12-month period (+4.72%). Google and Amazon have devalued close to -30% with Meta platforms and Netflix near -60%.

Preview

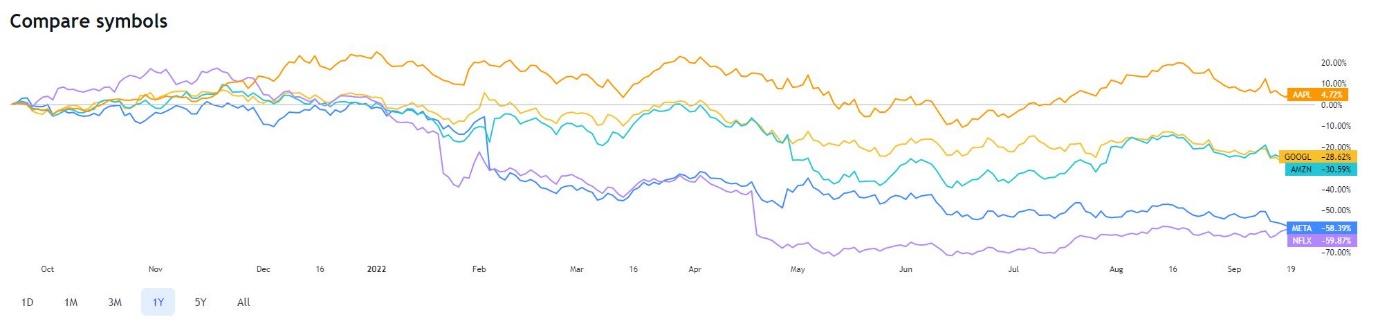
Figure 2 TradingView the past 1-year performance

Why the downturn?

There has been a brutal selloff in the FAANG basket from the 2022 high of 5821. As of the week of 13th June 2022, the decline was over -40%.

Although these companies were clear winners during the lockdown period of the COVID 19, most have seen a dramatic turn around in profits, earnings forecasts and market expectations.

There is also the argument that the quick rise in inflation and interest rates will have a severe dampening effect on global stocks.

Can we expect a turnaround in expectations? With earnings estimates on the low side, this could take some time.

A look from a technical perspective  

The weekly chart highlights the last move lower being in three-waves. This normally dictates that the selloff is corrective. Although we have seen a stalling close to the 61.8% Fibonacci level of 3608 (from 2237-5843), there is no clear indication of a change of trend.

The next clear downside barrier is between 3005 and 2682.

Preview

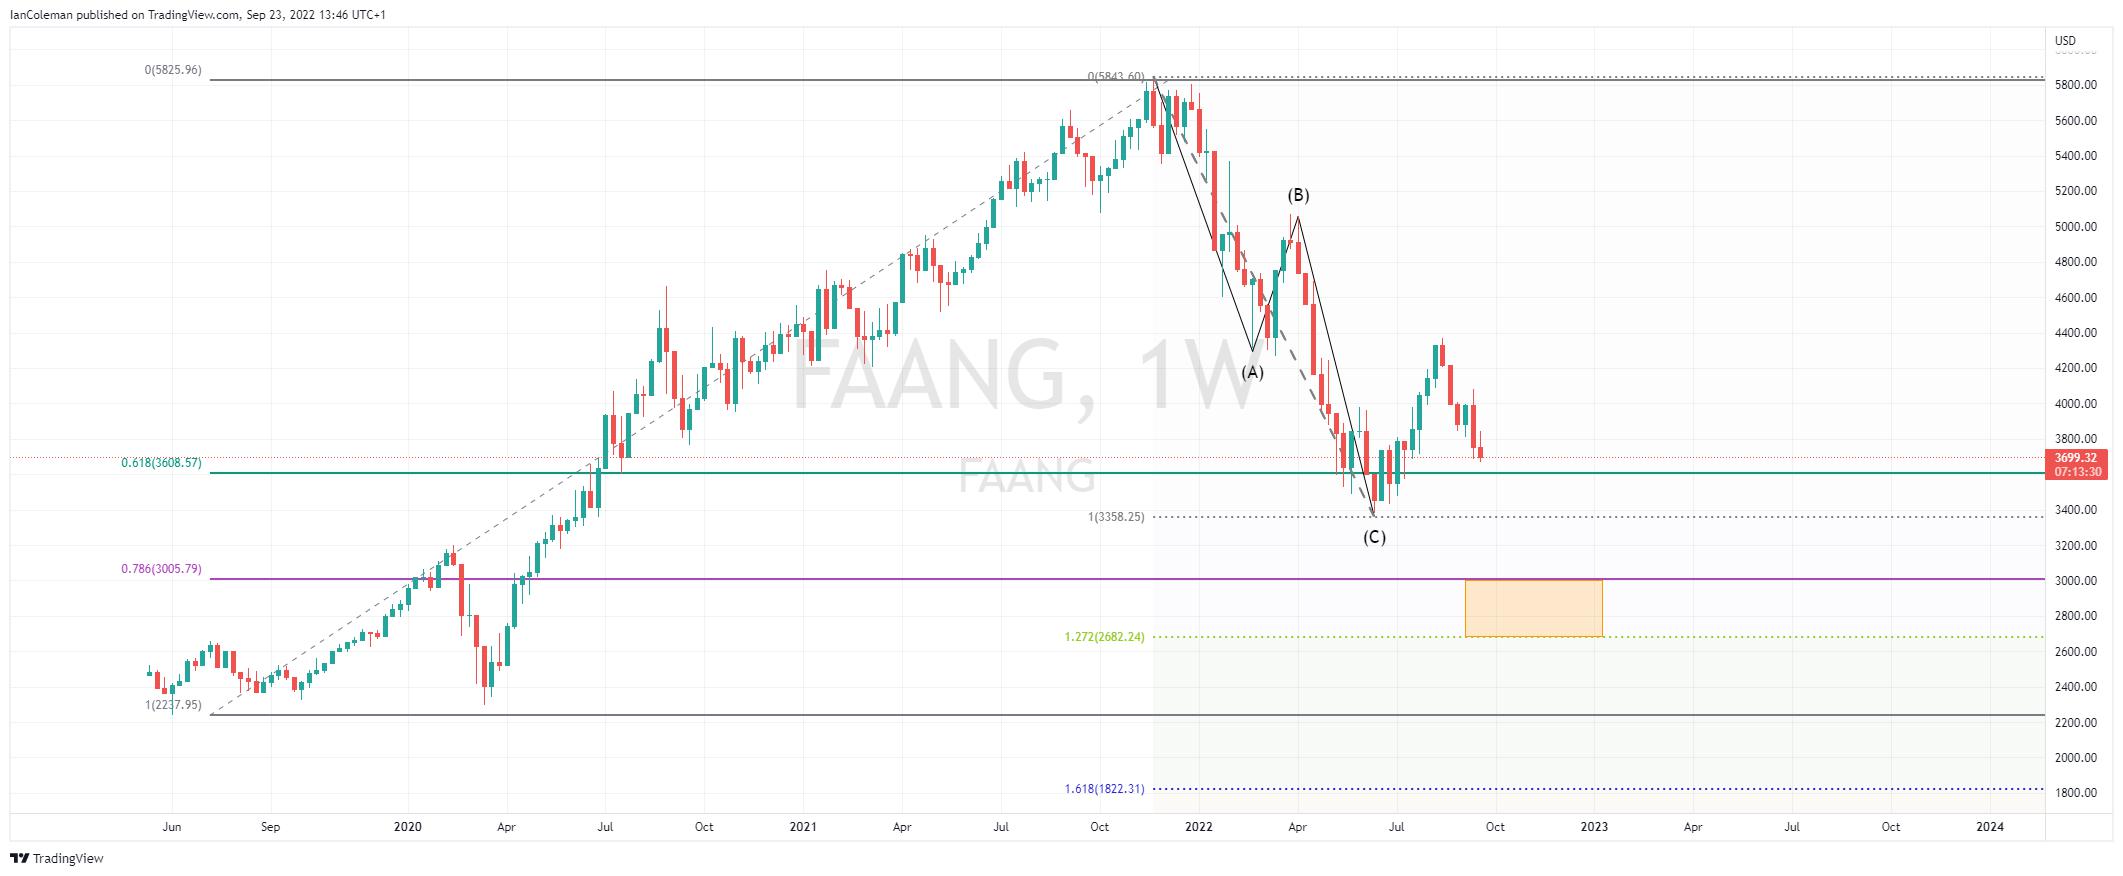
Figure 3 TradingView FAANG weekly chart

Looking at the Nasdaq100 (US100), this chart could suggest another -30% fall towards 7775 and 7466. This will then form a bullish pattern known as a BAT and could suggest a temporary low in place.

Preview

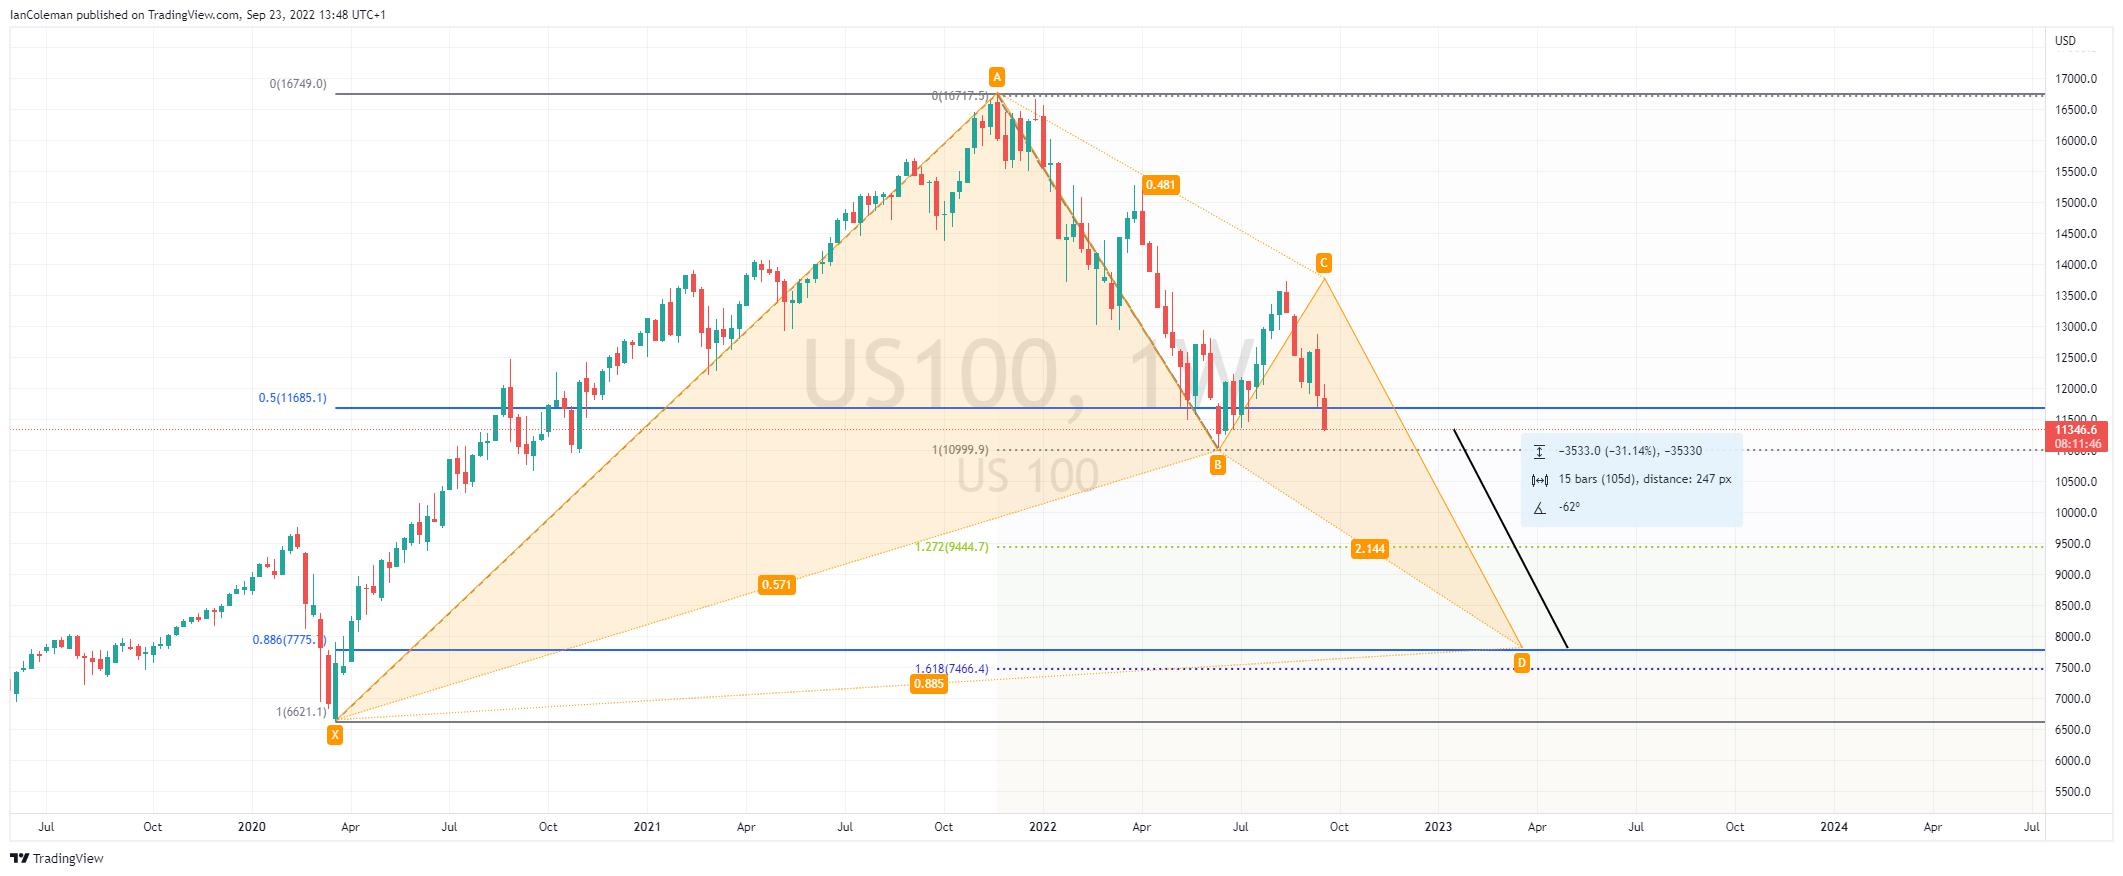
Figure 4 TradingView Nasdaq weekly


Related articles

How did Facebook stock perform in 2022?

How did Facebook stock perform in 2022?

Trading

The material provided here has not been prepared in accordance with legal requirements designed to promote the independence of investment research and as such is considered to be a marketing communication. Whilst it is not subject to any prohibition on dealing ahead of the dissemination of investment research we will not seek to take any advantage before providing it to our clients.

Pepperstone doesn’t represent that the material provided here is accurate, current or complete, and therefore shouldn’t be relied upon as such. The information, whether from a third party or not, isn’t to be considered as a recommendation; or an offer to buy or sell; or the solicitation of an offer to buy or sell any security, financial product or instrument; or to participate in any particular trading strategy. It does not take into account readers’ financial situation or investment objectives. We advise any readers of this content to seek their own advice. Without the approval of Pepperstone, reproduction or redistribution of this information isn’t permitted.

Other sites

  • The Trade Off
  • Partners
  • Group
  • Careers

Ways to trade

  • Pricing
  • Trading Accounts
  • Premium Clients
  • Active trader program
  • Refer a friend
  • Trading hours

Platforms

  • Trading Platforms
  • Trading tools

Markets and Symbols

  • Forex
  • Shares
  • ETFs
  • Indices
  • Commodities
  • Currency indices
  • CFD Forwards

Analysis

  • Navigating Markets
  • The Daily Fix
  • Pepperstone Pulse
  • Meet our Analysts

Learn to Trade

  • Trading Guides
  • Videos
  • Webinars
Pepperstone logo
support@pepperstone.com
+254203893547
The Oval | Ring Road Parklands
P.O.Box 2905-00606 | Nairobi, Kenya
  • Legal documents
  • Privacy policy
  • Website terms and conditions
  • Cookie policy

Risk Warning:

Margin trading products are complex instruments and come with a high risk of losing money rapidly due to leverage. 86% of retail investor accounts lose money when trading on margin with this provider. You should consider whether you understand how margin trading works and whether you can afford to take the high risk of losing your money. You don't own or have rights in the underlying assets. Past performance is no indication of future performance and tax laws are subject to change. The information on this website is general in nature and doesn't take into account your personal objectives, financial circumstances, or needs. Please read our PSF, RDN and other legal documents and ensure you fully understand the risks before you make any trading decisions. We encourage you to seek independent advice.

Pepperstone Markets Kenya Limited 2nd Floor, The Oval, Ring Road Parklands, PO Box 2905-00606 Nairobi, Kenya is licensed and regulated by the Capital Markets Authority.

© 2025 Pepperstone Markets Kenya Limited | Company No.PVT-PJU7Q8K | CMA License No.128