How to trade the Consumer Price Index (CPI)
Inflation is a hot topic currently. The dramatic increase in the price of everyday goods and services affects everyone. CPI measures this change. This guide aims to help make informed decisions when trading data related to inflation.
The Consumer Price Index (CPI) is a measure of the average change over time in the prices paid by consumers for a basket of goods and services. It is calculated by the Bureau of Labor Statistics (BLS) as their measure of inflation. It is usually released around the second Wednesday of every month and references the prior month.
To get access to news feeds with timely data releases consider using free aggregation platforms like PiQ which offer over 100 sources of information from the likes of Reuters and Bloomberg.
How is the CPI defined?
The BLS defines CPI as a measure that examines the average change over time in the prices paid by urban consumers for a basket of consumer goods and services. The CPI is one of the most commonly used indicators for inflation and reflects changes in the cost of living.
What are the components of the CPI basket?
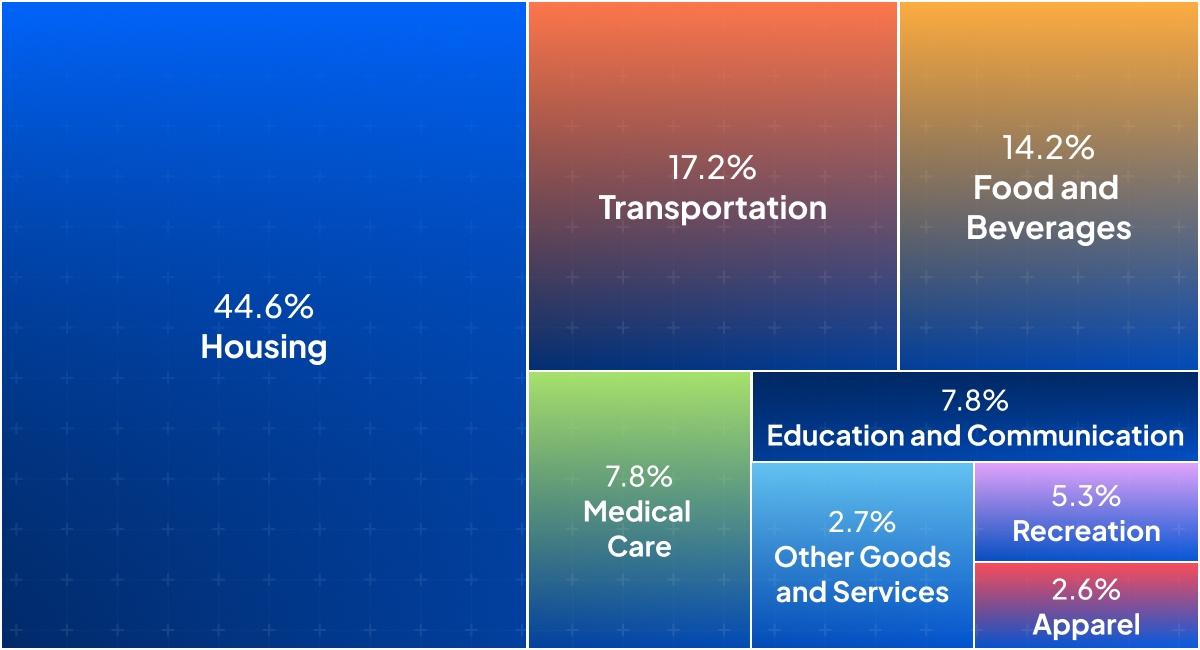
The CPI measures price changes for a fixed market basket of goods and services. This basket includes categories such as food and beverages, housing, apparel, transportation, medical care, recreation, education and communication, and other goods and services. The BLS periodically updates the market basket to reflect changes in consumer spending habits.
How is the CPI calculated?
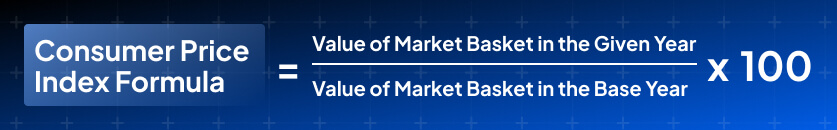
The index is based on prices of a fixed basket of goods and services, with the prices of the goods and services in the base period set equal to 100. The current period’s prices are then compared to the base period’s prices to calculate the index. The percentage change in the index is then used as a measure of inflation.
What impact does the CPI have on financial markets?
CPI can influence monetary policy, interest rates and the value of the currency. It also impacts wages, consumer spending and economic growth. High inflation can lead to economic instability, while low or negative inflation (deflation) can indicate a weak economy.
Here are the key ways CPI affects financial markets:
Interest Rates and Monetary Policy
CPI is a key economic indicator that influences the Federal Reserve’s decisions on interest rates. High inflation (rising CPI) may prompt the Fed to raise interest rates to slow the economy, while low inflation might lead to lower interest rates to stimulate growth. Changes in interest rate expectations based on CPI data can cause fluctuations in bond and stock prices as investors adjust expectations.
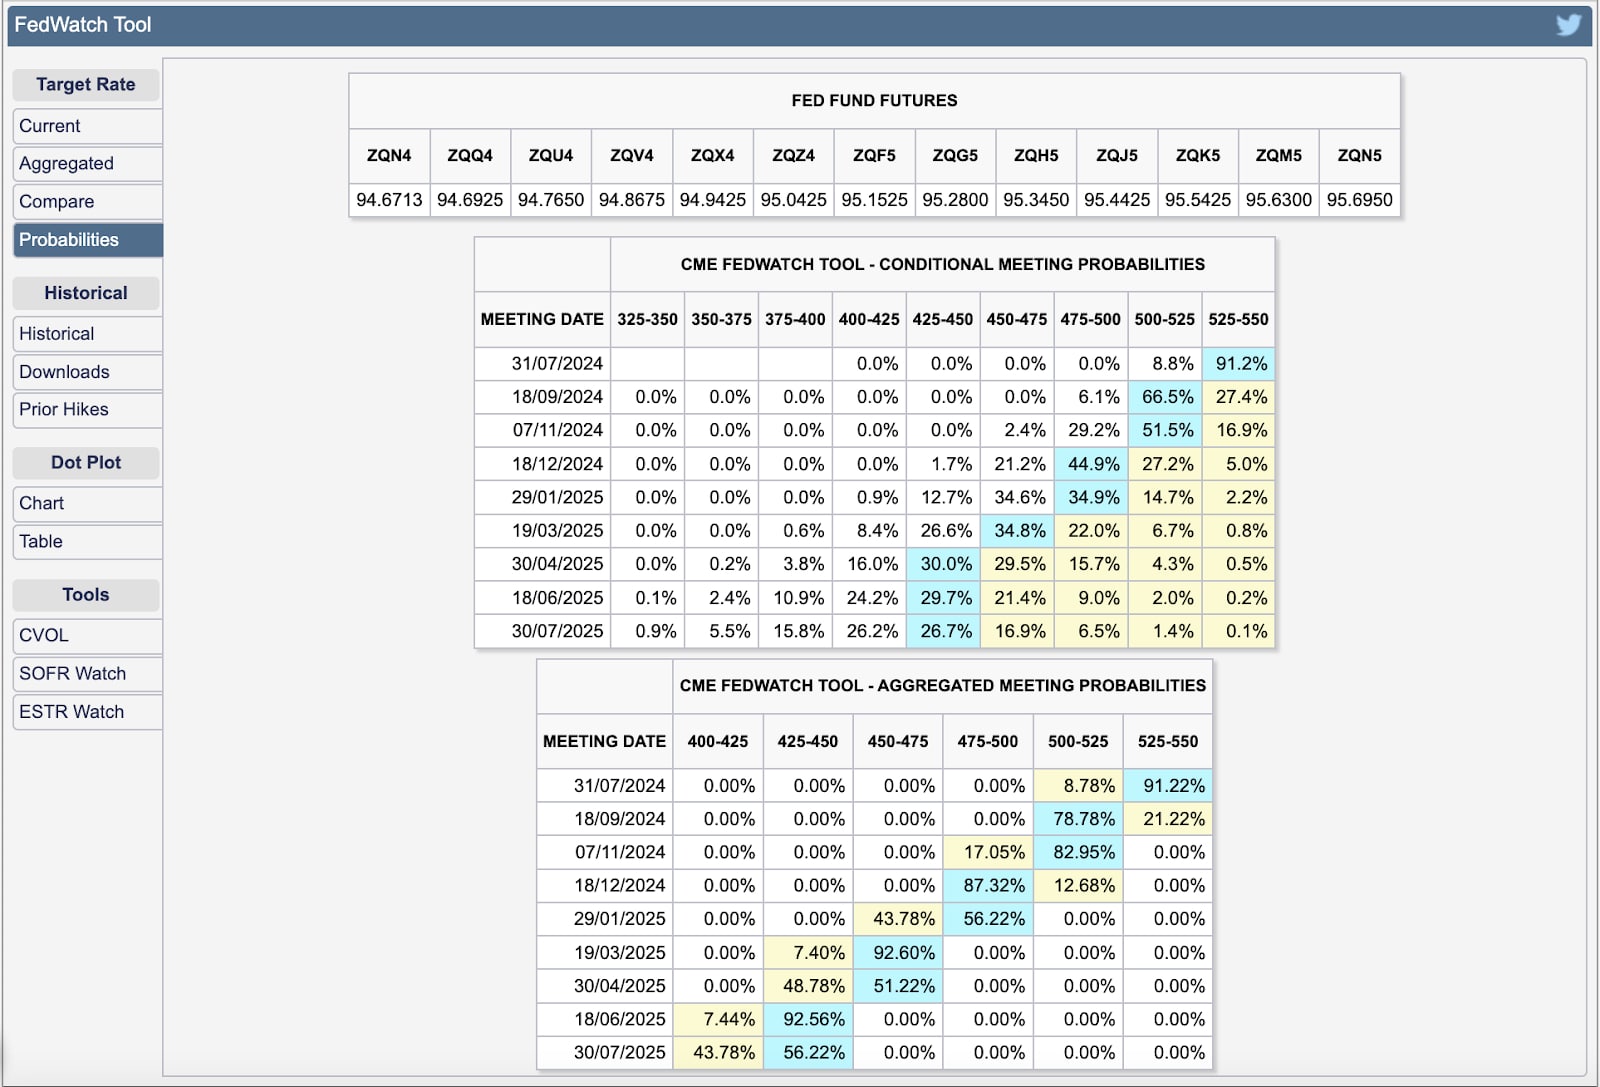
CME’s Fedwatch Tool tracks changes in rate expectations. The Fed Funds Rate implied by the futures contract is equal to 100 - Contract Price. It shows market expectations (expressed in probability terms as a percentage) of the Fed Funds rate at future meetings.
Bond Markets
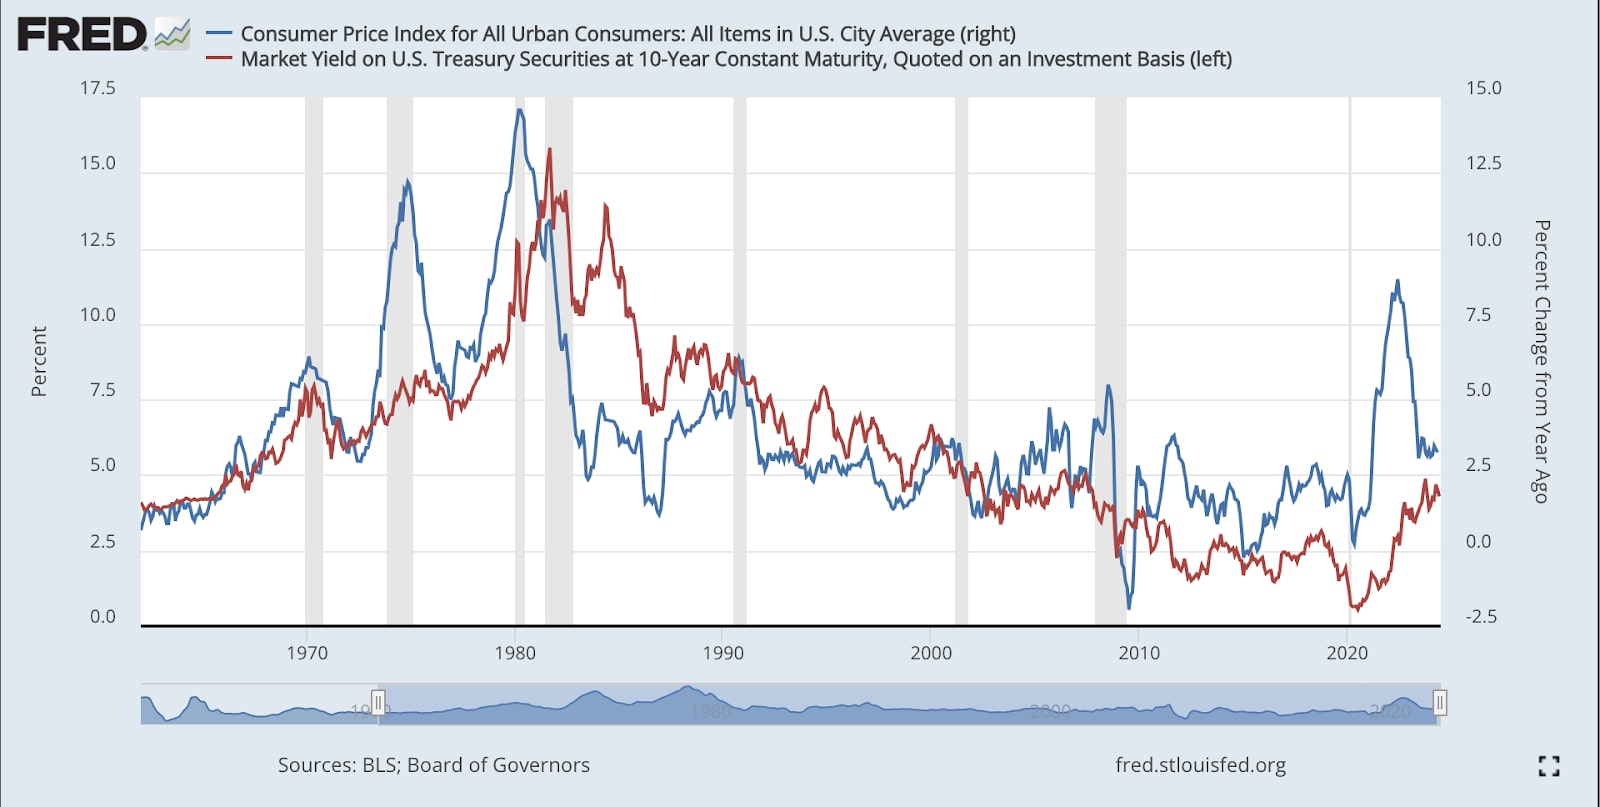
CPI has a major effect on bond yields (red line on the chart below). Higher inflation often leads to higher yields as investors demand more compensation for the decreased purchasing power of future bond payments. The demand for Treasury Inflation-Protected Securities (TIPS) may increase with rising CPI, as these products offer protection against inflation.
The St Louis Fed has thousands of charts on its FRED website (Federal Reserve Economic Database) that allow users to chart all economic data and markets.
Stock Markets
Inflation can impact corporate earnings. Higher inflation increases costs for companies, squeezing profit margins unless they can pass them on to consumers. Different sectors react differently to inflation. For example, consumer staples and utilities may outperform in high-inflation environments due to their ability to pass on costs, while growth sectors like technology might suffer due to higher discount rates on future earnings.
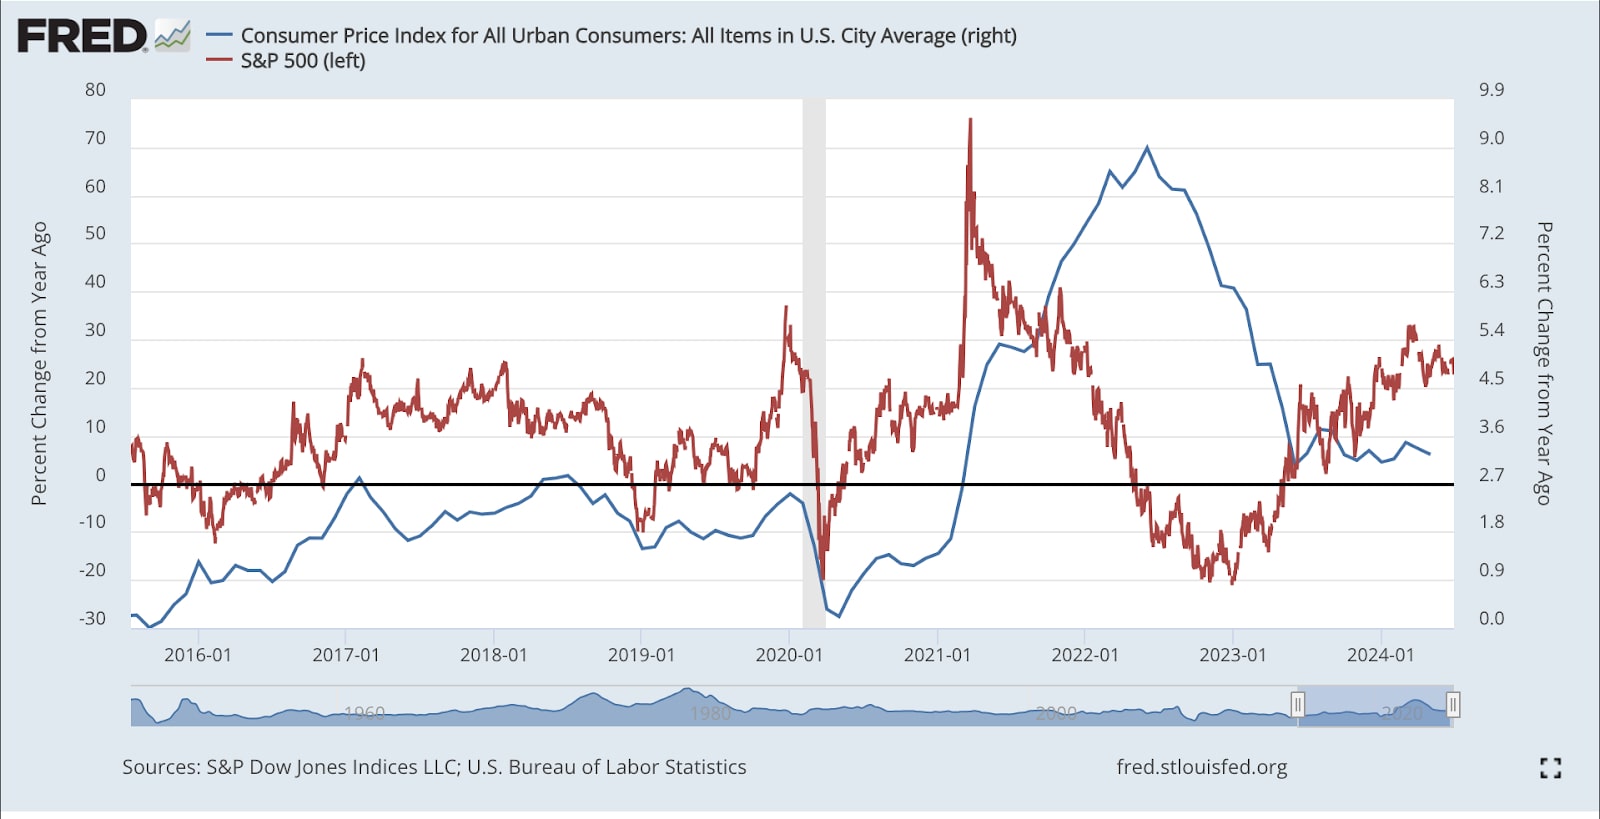
From the chart above, when consumer price inflation (blue line) is accelerating, it has often coincided with periods of stock market declines (red line). This was especially the case in the stagflation of the early-to-mid 1970s as well as from 1987 to 1988 that included the infamous stock market crash.
Currency Markets
Higher inflation can devalue a currency as purchasing power decreases. However, if higher inflation leads to higher interest rates, the currency might appreciate due to increased demand for higher-yielding investments. Currency traders closely monitor CPI data to anticipate central bank actions and make informed decisions.
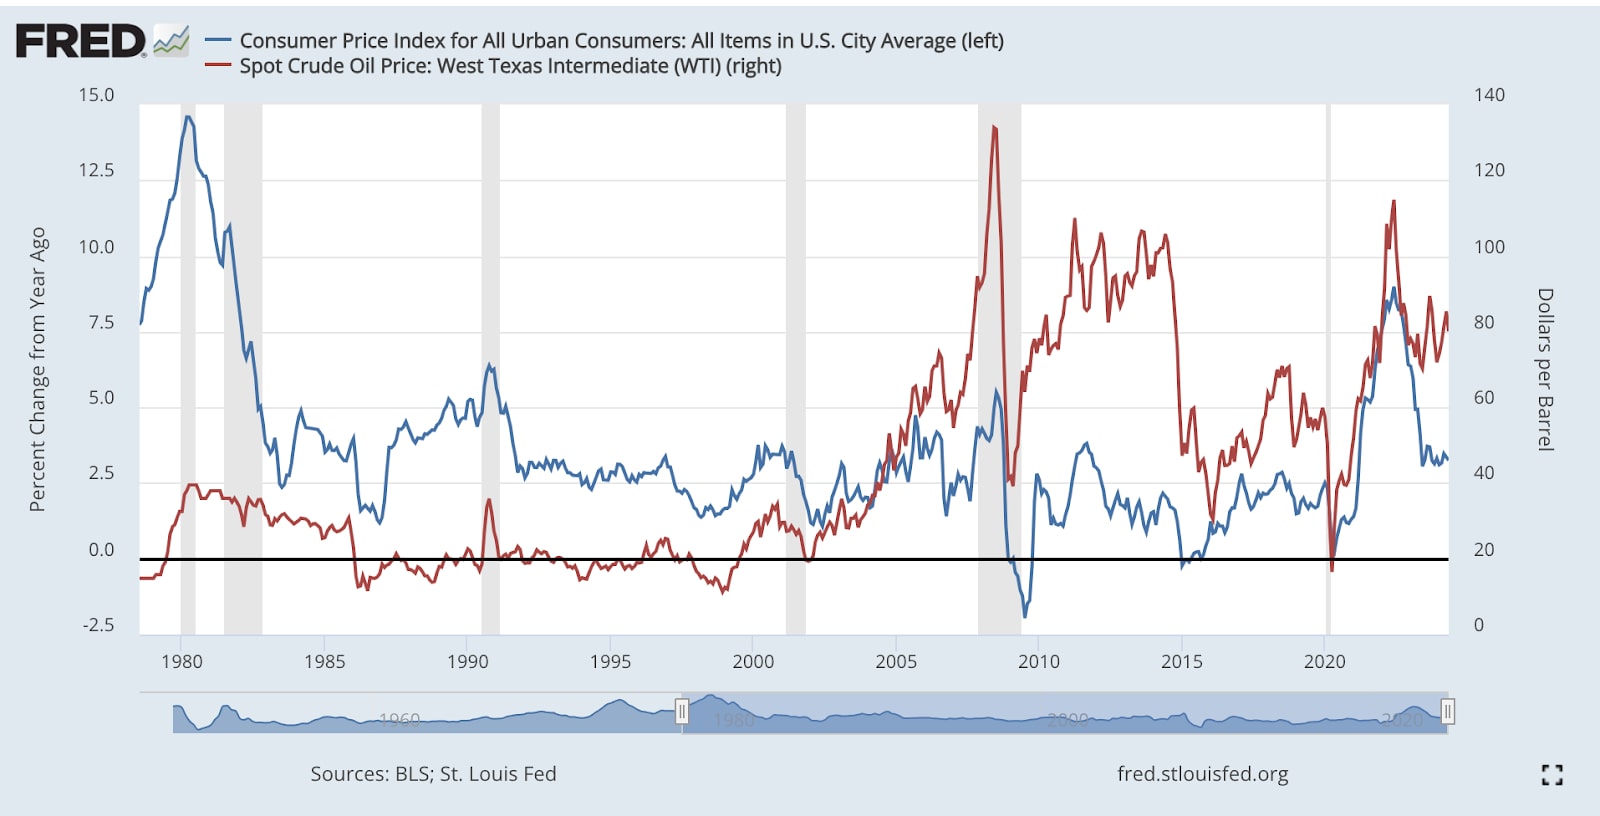
Commodity Markets
Commodities like gold and oil are sensitive to inflation data. Gold is often seen as a hedge against inflation, so a rising CPI might increase demand for gold. Conversely, inflation can affect oil prices both directly (through increased production costs) and indirectly (through changes in monetary policy). Oil prices tend to have a significant effect on the CPI itself, although according to St Louis Fed estimates the correlation between oil prices and inflation is less direct than it used to be in the 1970s. It estimates a correlation of 0.27 between changes in the oil price and inflation. In other words, a sustained 10% rise in oil prices may cause CPI to rise 2.7%. The biggest use of oil is transportation. Therefore, when oil prices rise, all goods which are transported will be affected by higher transport costs. Also, if producer prices rise due to higher oil prices, it can also lead to knock-on effects, for example, a higher price of petrol may encourage workers to seek higher wages. Rising oil prices therefore contribute to increased inflation expectations.
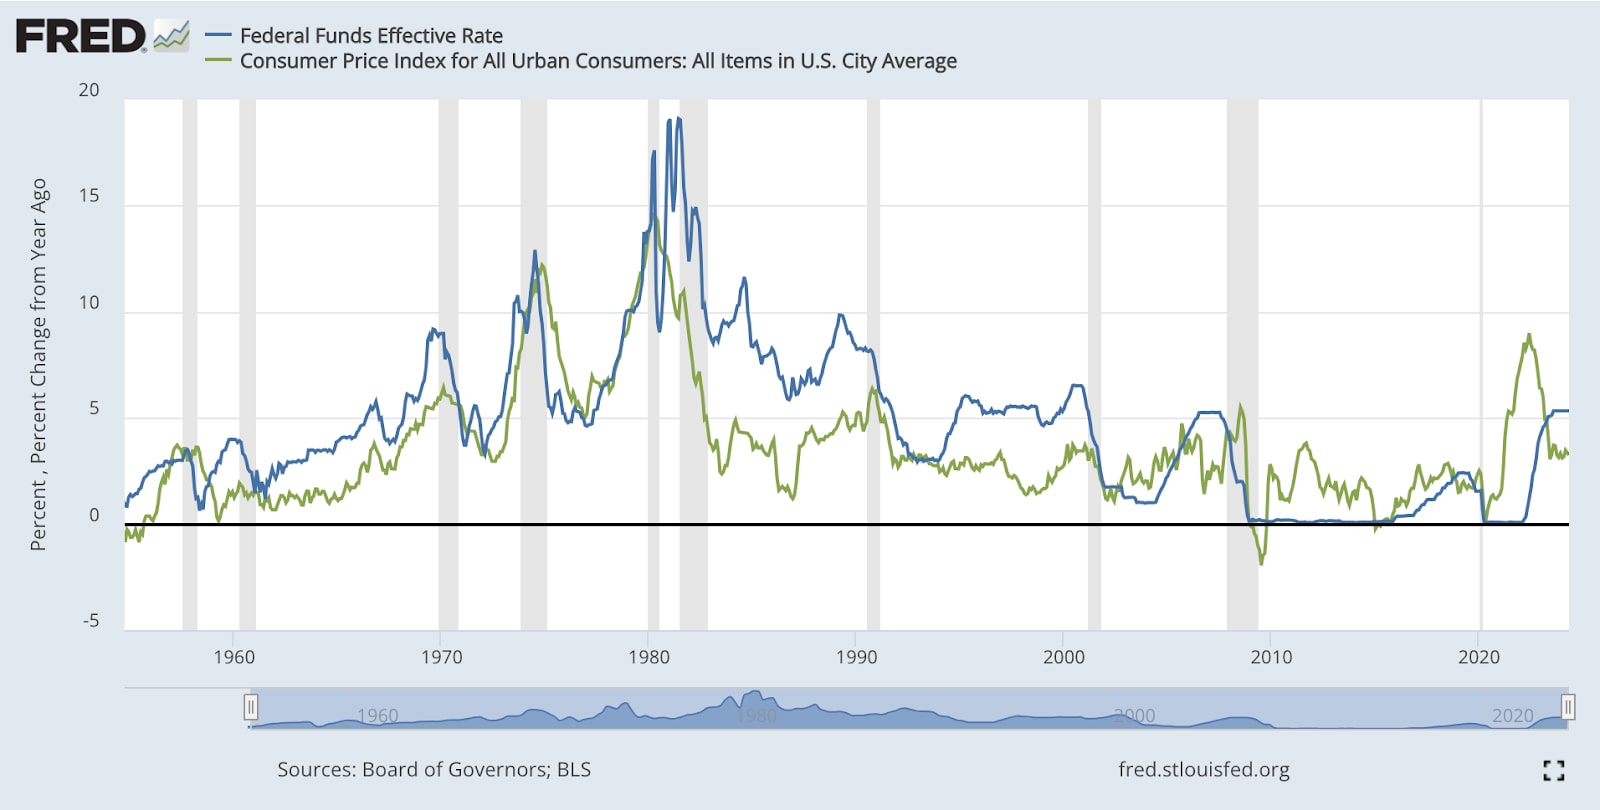
What is the relationship between inflation and interest rates?
The relationship between inflation and interest rates is fundamental to economic theory and monetary policy. This relationship can be measured through several key concepts and mechanisms:
Monetary Policy
Central banks use interest rates as a primary tool to control inflation. This is primarily achieved through RAISING interest rates to combat high inflation to make borrowing more expensive and saving more attractive, which reduces consumer spending and business investment. This decrease in demand helps to bring inflation down. Conversely, when inflation is low or during periods of economic slowdown, central banks may CUT interest rates. Lower rates make borrowing cheaper and saving less attractive, encouraging spending and investment, which can help increase demand and push inflation up.
Expectations and Inflation Targeting
The relationship between interest rates and inflation is also influenced by inflation expectations. If people expect higher inflation, they are likely to demand higher wages and spend more quickly, fueling inflation. Central banks try to manage expectations through actions such as forward guidance. The Fed uses the “dot plot” within their Summary of Economic Projections to guide expectations. Many central banks follow an inflation-targeting framework, where they set a specific inflation rate, i.e., 2%. They adjust interest rates to keep inflation within this target range, in an attempt to enhance predictability and stability in the economy.
Real vs. Nominal Interest Rates
Nominal Interest Rates are the stated interest rates on loans and savings, not adjusted for inflation. Real Interest Rates are nominal interest rates adjusted for inflation. The real interest rate is a crucial determinant of economic behaviour because it reflects the true cost of borrowing and the true return on investment.
How can we analyse inflation trends?
Traders can track trends in inflation by regularly checking the Bureau of Labor Statistics website for the latest releases as well as subscribing to news alerts or economic calendars to stay informed.
Other measures for inflation expectations are available from the NY Fed and the University of Michigan. The NY Fed Survey of consumer expectations gives a monthly reading of consumer inflation expectations a year ahead. Whilst the University of Michigan survey of consumers is a long-run, 5-year inflation component that the Fed uses when calculating its quarterly index of Common Inflation Expectations.
What are the historical trends in inflation rates?
Understanding historical trends helps contextualise current economic conditions and the effectiveness of policy responses. The trajectory of inflation impacts all aspects of the economy, from consumer purchasing power to investment decisions and monetary policy. There have been several periods of inflationary shocks since World War II that have strong similarities with the current environment.
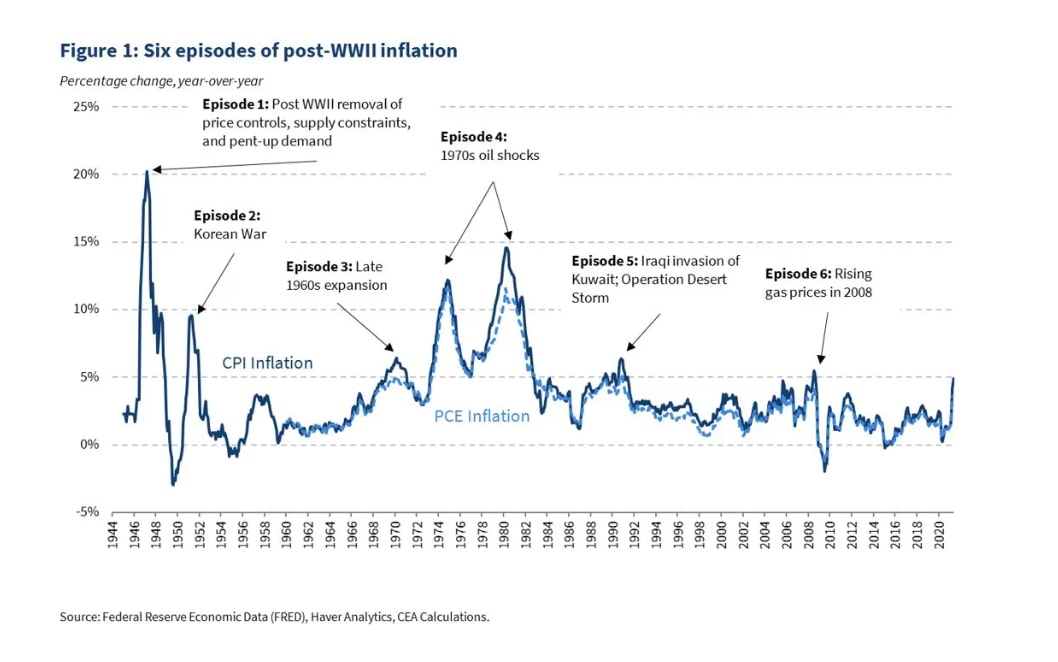
Source: Historical Parallels to Today’s Inflationary Episode
The 1970s was a decade marked by high inflation or stagflation due to the resultant stagnant economic growth. Key factors included oil shocks (1973 oil embargo and 1979 Iranian Revolution) which led to a spike in oil prices, contributing significantly to the inflation rate. The Federal Reserve was slow to react and monetary policy was too loose to combat runaway inflation.
Inflation peaked in the early 1980s as rates reached double digits. The Federal Reserve Chairman at the time, Paul Volcker, implemented a period of extremely tight monetary policy (high interest rates) to control inflation which led to a sharp economic recession.
The Global Financial Crisis of 2007-09 led to a period of deflation as central banks implemented aggressive monetary policies cutting rates to zero and some into negative territory in a bid to prevent deflation. Low rates of inflation remained until the COVID-19 pandemic. Initially the pandemic led to deflationary pressures due to lockdowns. However inflation rates began to rise sharply in 2021 due to supply chain disruptions, increased demand and unprecedented fiscal and monetary stimulus.
Inflation surged to their highest rates in decades during 2022 with supply chain issues persisting, increased demand as economies began reopening post-pandemic and the Russia-Ukraine conflict impacted oil and food prices significantly. Inflation rates have shown signs of stabilisation of late but remain a significant concern. Central banks remain in constant battle balancing inflation control and supporting economic growth.
What factors influence inflation trends?
Inflation trends are influenced by a complex interplay of factors that include demand-side pressures, supply-side conditions and external influences. Understanding these factors helps in anticipating inflationary trends and their potential impact on the economy.
Demand-Side Factors
Demand-pull inflation occurs when aggregate demand in an economy outpaces aggregate supply. Key demand-side factors include:
- Economic Growth: When an economy is growing rapidly, higher demand for goods and services can lead to higher prices. Strong consumer confidence and increased spending can drive this type of inflation.
- Monetary Policy: Central banks influence inflation through their control of interest rates and money supply. Lower interest rates make borrowing cheaper, stimulating spending and investment, which can increase inflation.
- Fiscal Policy: Government spending and tax policies can affect inflation. Increased government spending and tax cuts can boost aggregate demand, leading to higher prices.
- Consumer Confidence: High levels of consumer confidence can lead to increased spending and borrowing, driving up demand and prices.
Supply-Side Factors
Cost-push inflation occurs when the costs of production increase, leading to higher prices for goods and services. Key supply-side factors include:
- Production Costs: Increases in the costs of raw materials, wages, and other inputs can lead to higher prices.
- Supply Chain Disruptions: Events like geopolitical tension, natural disasters or more recently pandemics can disrupt supply chains, leading to shortages and higher prices.
- Technological Advances: Technological improvements can reduce production costs and lower inflation, but technology disruptions can have the opposite effect.
- Regulation and Taxes: Increased regulation and higher taxes can raise production costs, contributing to inflation.
External Factors
External or global factors can also influence domestic inflation:
- Exchange Rates: Changes in exchange rates can affect the prices of imported goods and services. A weaker domestic currency makes imports more expensive, contributing to inflation, while a stronger currency has the opposite effect.
- Global Commodity Prices: Prices of commodities like oil, metals, and agricultural products can significantly impact inflation. Global supply and demand dynamics, as well as geopolitical events, can cause volatility in commodity prices.
- International Trade: Changes in trade policies, tariffs, and international trade relationships can affect the cost of imported and exported goods, influencing inflation.
How can technical indicators be used to analyse inflation data?
It is advisable to use multiple indicators such as fundamental and technical indicators to get a clearer picture before committing to a trade. Here's how technical indicators can be used to analyse inflation data:
Trend Analysis
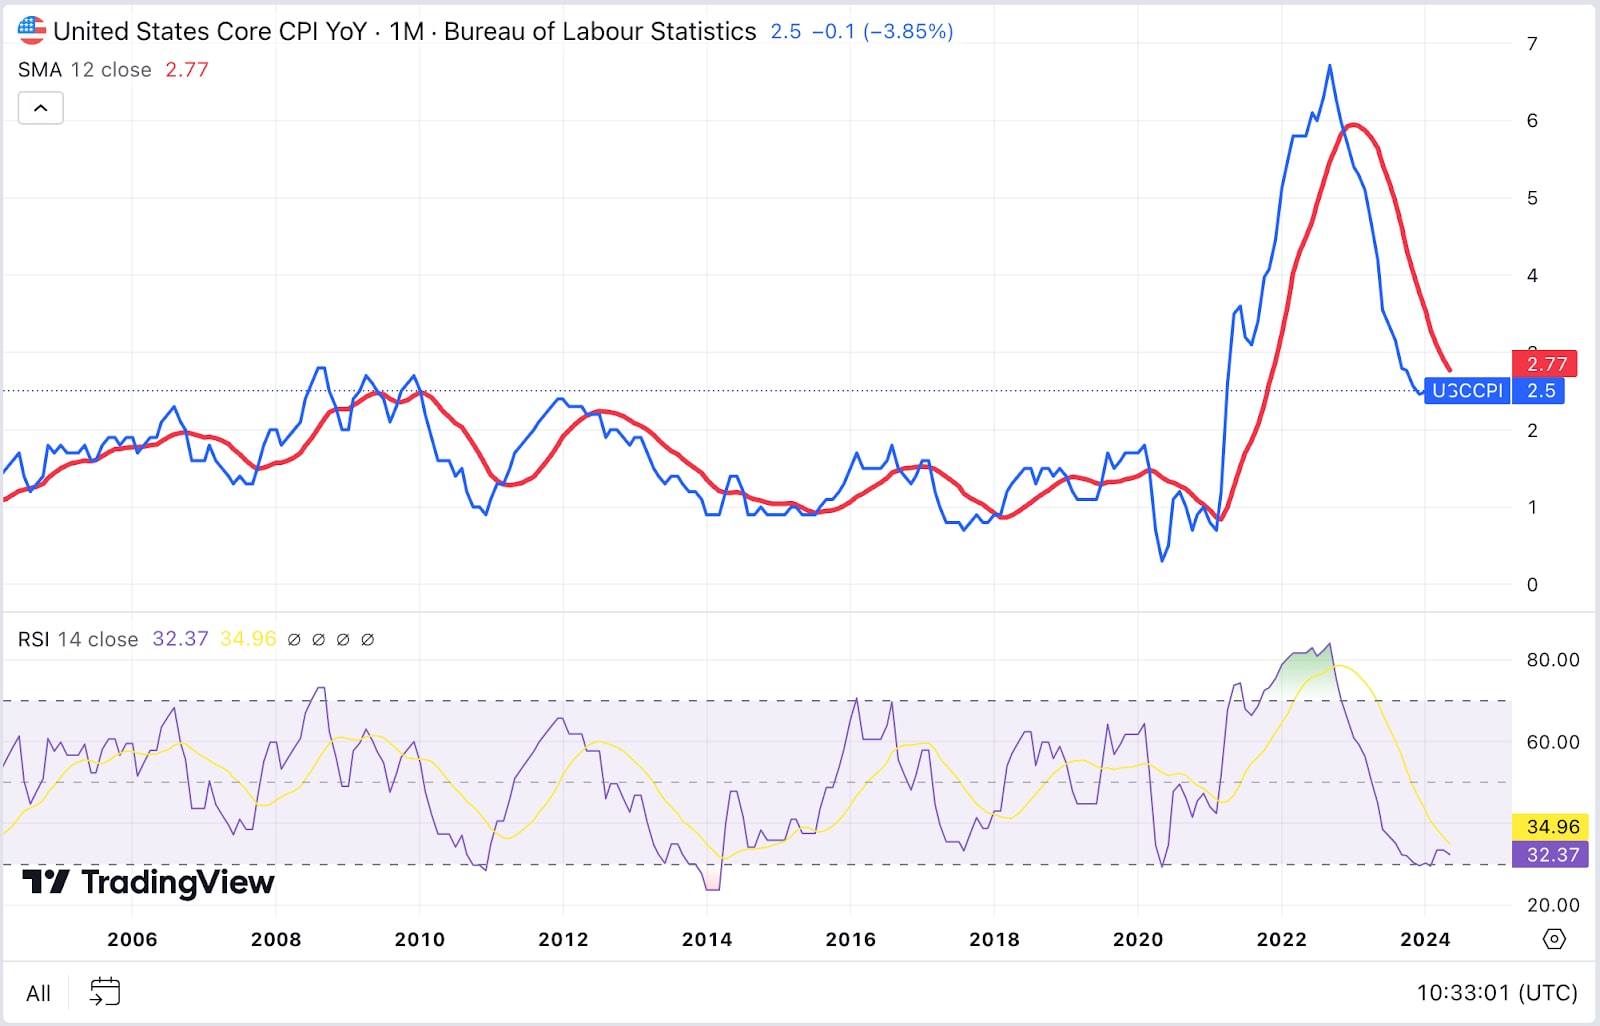
Moving Averages (MA): Simple Moving Average (SMA): Averages the inflation data over a specified period. For example, a 12-month SMA of inflation rates can smooth out short-term fluctuations and highlight longer-term trends.
Exponential Moving Average (EMA): Similar to the SMA but gives more weight to recent data, making it more responsive to new information. Useful for identifying recent changes in inflation trends.
Moving Average Convergence Divergence (MACD): Uses two moving averages (usually the 12- and 26-day EMA) to identify momentum changes. The MACD line crossing above the signal line might indicate rising inflation, while crossing below could suggest falling inflation
Momentum Indicators
Relative Strength Index (RSI): Measures the speed and change of price movements. An RSI above 70 might indicate overbought conditions (potentially indicating high inflation), while an RSI below 30 might indicate oversold conditions (potentially indicating low inflation).
Stochastic Oscillator: Compares a particular closing price of inflation data to a range of its prices over a certain period. It provides signals of potential trend reversals when the indicator crosses specific thresholds (e.g., above 80 or below 20).
Volatility Indicators
Bollinger Bands: Consists of a moving average and two standard deviation lines. When inflation rates move outside the bands, it may indicate that the inflation rate is experiencing high volatility and could revert to the mean.
Average True Range (ATR): Measures market volatility by decomposing the entire range of an asset price for that period. A rising ATR on inflation data suggests increasing volatility in inflation rates.
A more detailed guide to all the Trading Indicators mentioned above.
What are effective trading strategies for CPI releases?
Trading around CPI releases can be profitable but requires a well-thought-out strategy, quick execution, and effective risk management. By combining fundamental analysis, technical strategies, and prudent risk management, traders can navigate the volatility and potentially capitalise on market movements triggered by CPI data. Identify and trade assets that have strong correlations with inflation data:
- Currencies: Inflation data often impacts currency markets significantly. For example, higher than expected CPI can lead to a stronger USD as markets anticipate rate hikes by the Federal Reserve.
- Commodities: Inflation can drive commodity prices higher. For instance, gold often rises during periods of high inflation as investors seek a hedge.
- Equities: Certain sectors like consumer staples and utilities might be less sensitive to inflation, while growth stocks might suffer due to higher interest rates.
It is important to note that these are general guidelines and the reaction can vary according to the economic context within which the numbers are delivered.
Once the asset to be traded is determined consider the following strategies to initiate trades:
- Before Release: Analyse the consensus forecast and market sentiment. If CPI is expected to be higher than expectations, consider long positions in assets that benefit from inflation, like commodities. Use a 90 minute chart to set high and low points (straddle) 10-15 minutes before the release. Although timeframes are a matter of preference. Under such a scenario sell orders are placed below the low (range low minus one pip) and buy orders above the high (range high plus one pip) on the chart using OCO orders. This strategy is used to enter new trades to take advantage of volatility spikes.
- During Release: Implement a breakout strategy, placing buy stop orders above and sell stop orders below key resistance and support levels.
- After Initial Reaction: Monitor the price action for signs of overextension. Consider a reversion to the mean strategy if the initial move appears exaggerated. Use stop-loss orders to protect against adverse movements and limit your position sizes to manage risk effectively.
How can one prepare for CPI announcements?
Pepperstone’s 5 ‘R’s of Trading Preparation
- Research - Researching the markets and keeping track of newsflow. Use platforms such as PiQ and X. Greater understanding of what makes asset prices fluctuate, the greater the chances of identifying trading opportunities.
- Realistic - Be realistic and learn to understand risk and reward per trade. Successful traders have a profit and loss goal before entering a trade. Practice on a demo account.
- Risk - Work out risk tolerance. Risk management tools are available on the Pepperstone trading platforms. See also Five Rules Around Managing Risk.
- Record - Keep a paper or free online trading journal such as TradeBench. Learn from experience. A journal can be as detailed as required but at the bare minimum it should cover the reason behind the trade, profit target/maximum loss & entry/exit levels.
- Rudimentary - Keep it simple. There is no need for complicated algorithms or game theory scenarios. A straightforward and easy to execute strategy according to risk tolerance and trading objectives can be just as if not more profitable.
Pepperstone provides comprehensive previews to help prepare for all major market moving events including CPI. Follow Pepperstone’s senior analysts Chris Weston (@ChrisWeston_PS) and Michael Brown (@MrMBrown) on X (Twitter) for insight into the various caveats to look out for in the releases. It is also useful to have a “cheat sheet” on hand as a quick reference guide when trading on the day.
The material provided here has not been prepared in accordance with legal requirements designed to promote the independence of investment research and as such is considered to be a marketing communication. Whilst it is not subject to any prohibition on dealing ahead of the dissemination of investment research we will not seek to take any advantage before providing it to our clients.
Pepperstone doesn’t represent that the material provided here is accurate, current or complete, and therefore shouldn’t be relied upon as such. The information, whether from a third party or not, isn’t to be considered as a recommendation; or an offer to buy or sell; or the solicitation of an offer to buy or sell any security, financial product or instrument; or to participate in any particular trading strategy. It does not take into account readers’ financial situation or investment objectives. We advise any readers of this content to seek their own advice. Without the approval of Pepperstone, reproduction or redistribution of this information isn’t permitted.