Pepperstone logo
Pepperstone logo
  • English
  • Ways to trade

    Pricing

    Trading accounts

    Premium clients

    Refer a friend

    Active trader program

    Trading hours

    24-hour trading

    Maintenance

  • Trading platforms

    Trading platforms

    TradingView

    Pepperstone platform

    MetaTrader 5

    MetaTrader 4

    CopyTrading

    cTrader

    Trading integrations

    Trading tools

  • Markets

    Markets to trade

    Forex

    Shares

    ETFs

    Indices

    Commodities

    Currency Indices

    Dividends for index CFDs

    Dividends for share CFDs

    CFD forwards

  • Market analysis

    Market news

    Navigating markets

    The Daily Fix

  • Learn to trade

    Trading guides

    CFD trading

    Copy trading

    Forex trading

    Commodity trading

    Stock trading

    Technical analysis

    Day trading

    Scalping trading

    Upcoming IPOs

    Gold trading

    Oil trading

    Webinars

  • Partners

  • About us

  • Help and support

  • English
  • Launch webtrader

  • Ways to trade

  • Trading platforms

  • Markets

  • Market analysis

  • Learn to trade

  • Partners

  • About us

  • Help and support

Help and support

Adding and modifying a chart indicator (mobile)

Adding an indicator to a chart

Indicators are statistics that describe a product’s past price movements and which may be helpful in predicting future price movements. Five indicators are available: Bollinger Bands, stochastics, RSI, MACD and MA. Each can be configured in various ways. For example, the period (or periods) used in calculating values can be defined, and you can choose to overlay an indicator on the price chart or have the indicator replace the price chart.

Tip: An indicator is not specific to the chart it is added to, that is, until it is disabled it will appear on all other charts you display.

1. Display the chart and tap indicators at the bottom left of the chart. The Indicators panel appears, listing the available indicators:

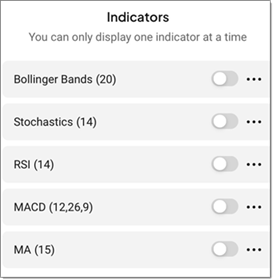
2. Tap on the slider for the indicator you want. The indicator is immediately added to the chart.

Some indicators are labelled on the chart, with various parameters shown in brackets beside the label. In the example below, the RSI indicator is overlaid on a price chart, its period and field parameters (14, HL/2) are shown in brackets, and its current value is highlighted on the vertical axis:

Tip: When an indicator has been enabled, the indicator button below the chart is shown with a blue dot to its right, as in the example above.

3. Tap on the chart to close the Indicators panel.


Modifying an indicator

1. Open any chart.

2. Tap indicator at the bottom left of the chart. The Indicators panel appears.

3. To remove an indicator, tap on its slider.

4. To add an indicator, tap on its slider.

5. To modify an indicator, tap the three dot icon at the right of the indicator. The indicator’s parameters appear. The example below shows the parameters for for RSI:

6. Make whatever changes are required.

7. Tap Save.

8. Tap on the chart to close the Indicators panel.

Other sites

  • The Trade Off
  • Partners
  • Group
  • Careers

Ways to trade

  • Pricing
  • Trading Accounts
  • Premium Clients
  • Active trader program
  • Refer a friend
  • Trading hours

Platforms

  • Trading Platforms
  • Trading tools

Markets and Symbols

  • Forex
  • Shares
  • ETFs
  • Indices
  • Commodities
  • Currency indices
  • CFD Forwards

Analysis

  • Navigating Markets
  • The Daily Fix
  • Meet our Analysts

Learn to Trade

  • Trading Guides
  • Videos
  • Webinars
Pepperstone logo
support@pepperstone.com
+254203893547
The Oval | Ring Road Parklands
P.O.Box 2905-00606 | Nairobi, Kenya
  • Legal documents
  • Privacy policy
  • Website terms and conditions
  • Cookie policy
  • Sitemap

Risk Warning:

Margin trading products are complex instruments and come with a high risk of losing money rapidly due to leverage. 86% of retail investor accounts lose money when trading on margin with this provider. You should consider whether you understand how margin trading works and whether you can afford to take the high risk of losing your money. You don't own or have rights in the underlying assets. Past performance is no indication of future performance and tax laws are subject to change. The information on this website is general in nature and doesn't take into account your personal objectives, financial circumstances, or needs. Please read our PSF, RDN and other legal documents and ensure you fully understand the risks before you make any trading decisions. We encourage you to seek independent advice.

Pepperstone Markets Kenya Limited 2nd Floor, The Oval, Ring Road Parklands, PO Box 2905-00606 Nairobi, Kenya is licensed and regulated by the Capital Markets Authority.

© 2025 Pepperstone Markets Kenya Limited | Company No.PVT-PJU7Q8K | CMA License No.128