- English

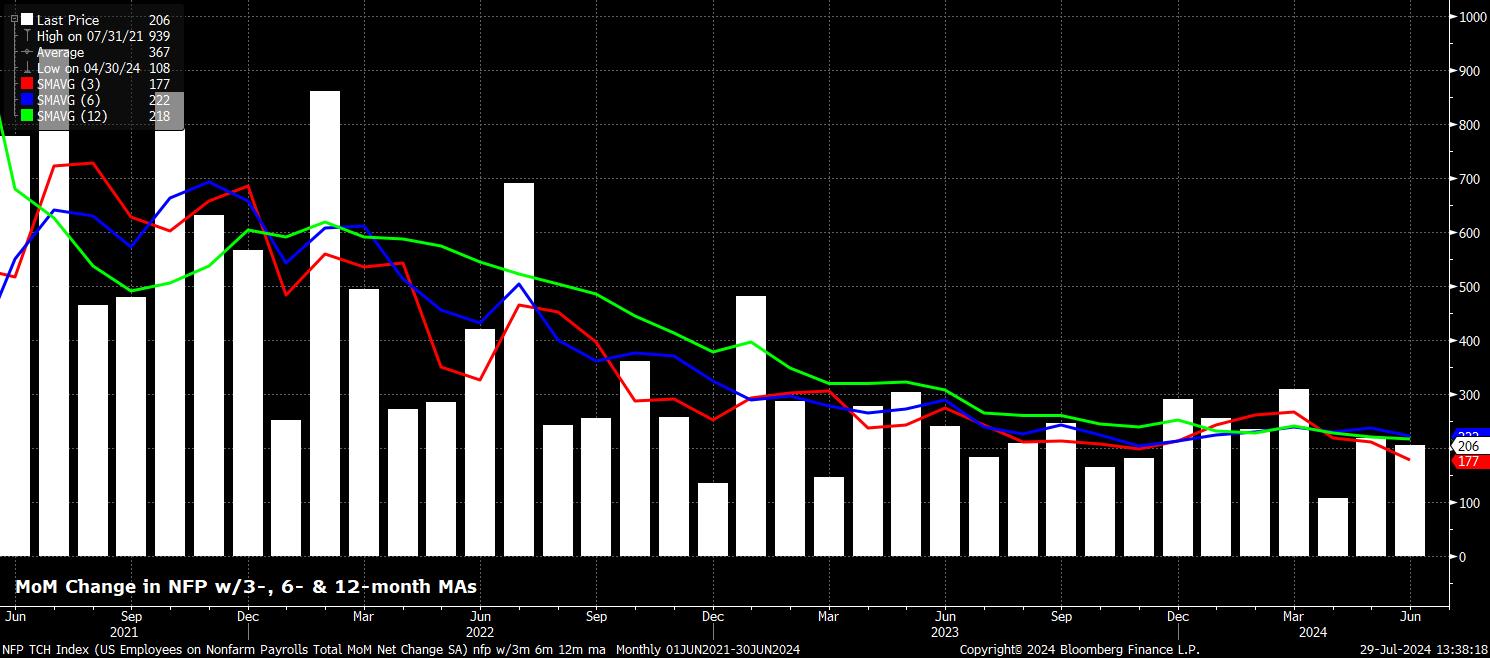
Headline nonfarm payrolls are set to have risen by +178k in July, a touch below the +206k pace seen in June (pending revisions), and broadly in line with the 3-month average of job gains at +177k, though this average currently resides at its lowest level since the beginning of 2021. While the range of estimates, at +70K to +225k, is typically wide, a print within this band would still represents a pace of job creation that remains some way below the ‘breakeven’ payrolls pace, of around +250k, required for employment growth to keep pace with growth in the size of the labour force.
Given the timing of this month’s labour market report, some of the usual leading indicators, such as the ISM PMI surveys, aren’t available at the time of writing, shan’t have been released by the time the BLS unveil the jobs data on Friday.
Nevertheless, one could argue that risks to the NFP consensus are marginally biased to the downside, primarily owing to the uncertain impact of Hurricane Beryl on employment, with the storm having made landfall in the USA during the survey week. This will, likely, have more of a negative impact on the establishment survey, than on the household survey metrics.
Meanwhile, initial jobless claims remained largely unchanged between the June and July survey weeks, though continuing claims did rise +19k over that period, and remain close to the highest level since 2021.
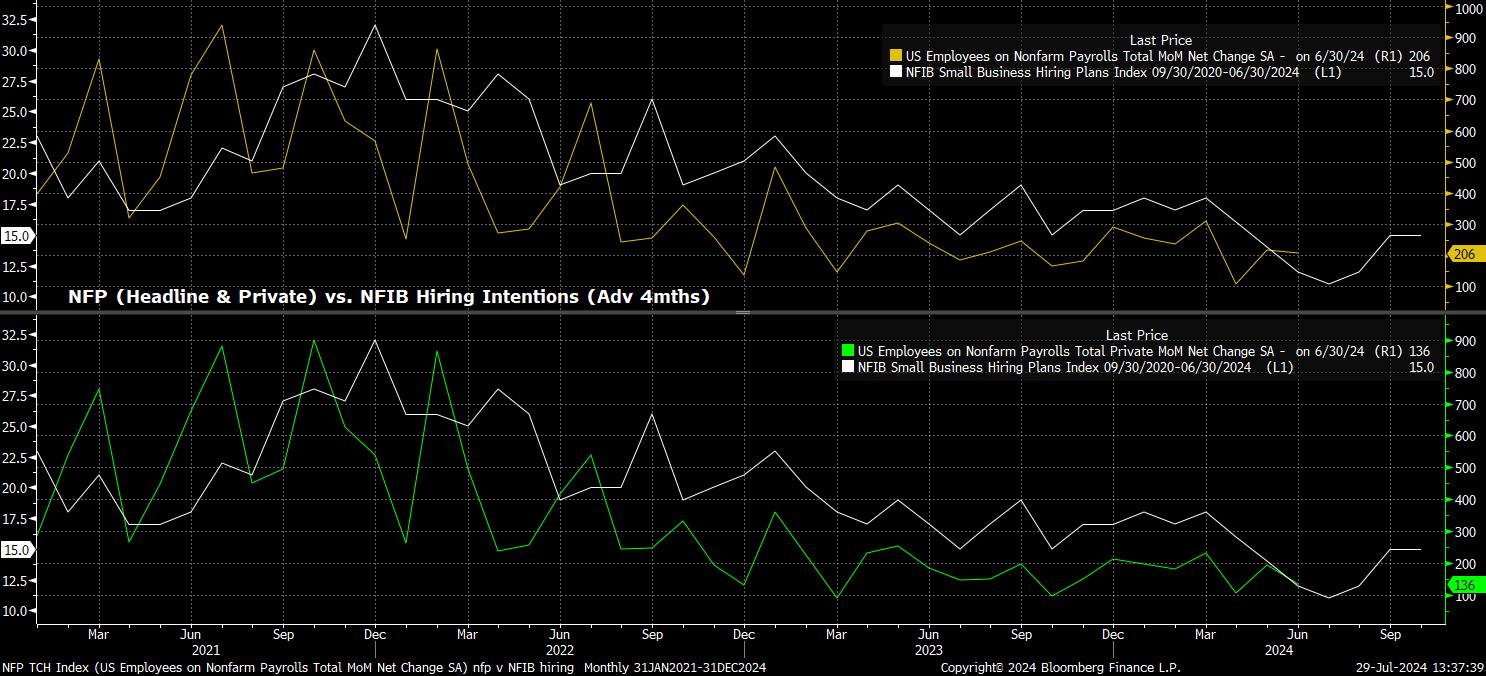
The latest NFIB hiring intentions survey also points to potential downside risks for the payrolls print, and has been a remarkably accurate indicator, particularly of private payrolls growth, this cycle. For both private, and headline, job creation, the NFIB survey points to a rise of around +100k, right towards the bottom of the aforementioned forecast range.
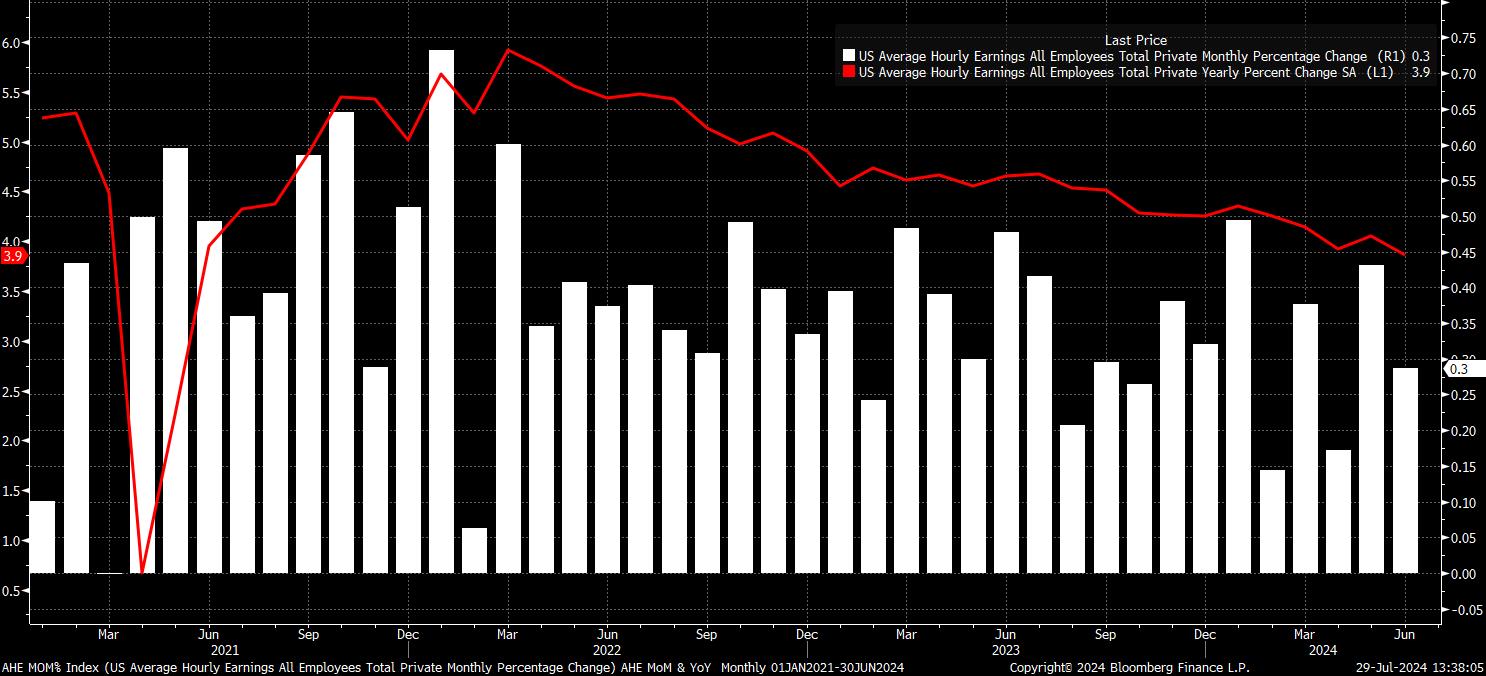
Sticking with the establishment survey, average hourly earnings are set to have risen by 0.3% MoM in July, unchanged from the pace seen a month prior. On an annual basis, owing largely to base effects from 2023’s data, this would see earnings growth cool to 3.7% YoY, down 0.2pp on the pace seen in June.
Clearly, such a cooling in annual earnings growth, even if partly owing to statistical quirks, would be welcomed by FOMC policymakers, while also representing a continued cooling in wage pressures, and a rate of earnings growth that is becoming increasingly compatible with a sustainable return to the 2% inflation target over the medium term. In turn, such data should provide the FOMC with further ‘confidence’ that rate cuts can soon be delivered.
Turning to the household survey, headline unemployment is expected to remain unchanged at its highest level since November 2021, at 4.1%, in the July jobs report, while labour force participation should also hold steady at 62.6%, marginally below the cycle highs seen in the middle of 2023.
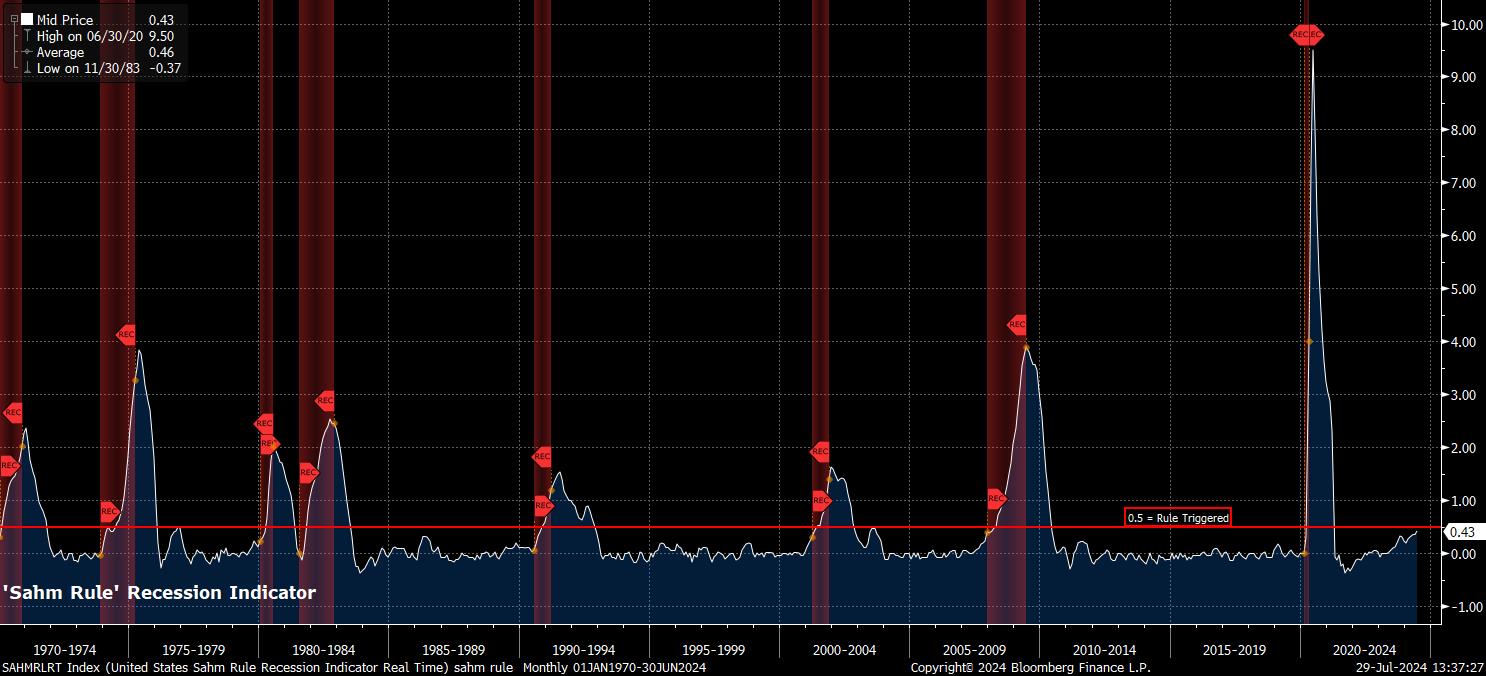
However, it is worth noting that a rise in joblessness to 4.2% would result in the so-called ‘Sahm Rule’ being triggered as, in such an instance, the 3-month moving average of unemployment would then have risen by 0.5pp from the 12-month low. While no economic indicator, or signal, is foolproof, the ‘Sahm Rule’ has been noted for its accuracy, having been triggered in advance of every US recession since 1970. That said, with US GDP having grown by an annualised pace of over 2% in 7 of the last 8 quarters, maybe this cycle is the one when the rule will be broken.
Zooming out, it seems unlikely that the July jobs report will be a game-changer in terms of the FOMC policy outlook, though of course this is said pending comments from the Committee on Wednesday, where the statement, and post-meeting press conference, should both lay the groundwork for a 25bp cut in September.
While a hotter-than-expected print, particularly in terms of the earnings component, may spark some concern about the potential stubbornness of price pressures, such data would likely not be enough to deter the FOMC from beginning to normalise policy sooner rather than later, given a reluctance to over-react to one single data point, and a longstanding view that inflation returning to target does not require substantial labour market weakness.
On the other hand, cooler-than-expected data would merely fit with the broader theme of recent jobs data, representing a further slow and steady cooling of labour market conditions, and likely further cementing the case for a cut at the next FOMC meeting in September.
For financial markets, however, the jobs report will likely once more prove a significant vol event, with participants set to view the figures through the lens of the longer-run policy outlook, and the cumulative easing that the FOMC are likely to deliver this year. Here, upside USD risks present themselves, with the OIS curve discounting over 65bp of cuts – i.e., implying a 60% chance of 3x 25bp cuts this year – by the end of December. Such a pace seems considerably more rapid than the FOMC would likely deliver, hence said cuts are likely to be priced out, sparking some USD demand in the process, over the medium-run.
Related articles


The material provided here has not been prepared in accordance with legal requirements designed to promote the independence of investment research and as such is considered to be a marketing communication. Whilst it is not subject to any prohibition on dealing ahead of the dissemination of investment research we will not seek to take any advantage before providing it to our clients.
Pepperstone doesn’t represent that the material provided here is accurate, current or complete, and therefore shouldn’t be relied upon as such. The information, whether from a third party or not, isn’t to be considered as a recommendation; or an offer to buy or sell; or the solicitation of an offer to buy or sell any security, financial product or instrument; or to participate in any particular trading strategy. It does not take into account readers’ financial situation or investment objectives. We advise any readers of this content to seek their own advice. Without the approval of Pepperstone, reproduction or redistribution of this information isn’t permitted.