- English
Crude Oil:
Crude has been rocketing higher after positive news flow with regards to omicron. Early evidence from South Africa indicates that ICU and oxygen usage are lower than previous waves at similar points on the timeline as well as those in hospital being largely unvaccinated. Based on this small sample size of evidence (which makes me still cautious) this leads one to believe omicron seems more transmissible, but less severe. Fauci (Biden’s Chief Medical Adviser) also shared optimism over the weekend stating that early signals show not a whole lot of severity. GlaxoSmithKline Plc also announced from their recent research that their Covid-19 antibody treatment is effective against mutations in omicron. Risk assets, which oil is falls into got a boost from this and current price action indicates some hot money has flowed back into the black liquid. Adding fuel to the bullish fire we had news that Iran-US Nuclear talks have stumbled a bit.
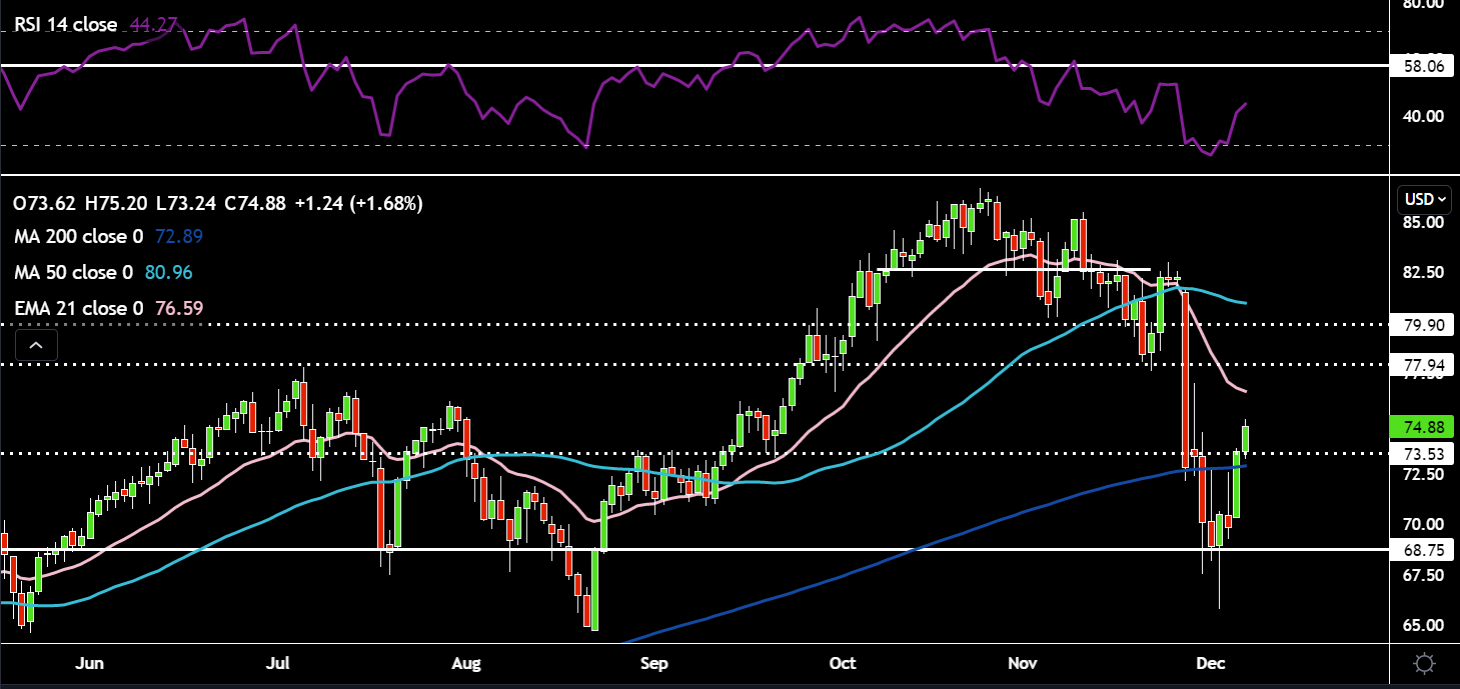
Looking at the daily chart, technicals are strong with an oversold bounce having taken place with $68 support holding. Price is now above its 200-day SMA. Targets wise, on the upside the 21-day EMA around $76 and $78 will be important. On the downside $73.5 (just above the 200-day SMA) will be key.

(Source: TradingView - Past performance is not indicative of future performance.)
AUDUSD:
The RBA left their policy settings unchanged as expected by the market. On the technicals, looking at the 1-hour chart here we can see price is facing some resistance in the form of the intersection of the 200 period SMA, downtrend line and 61.8% Fibonacci level. The RSI is in overbought territory. Could we see a dip lower towards the 0.705 area between the 21 period EMA and the 50 period SMA. On the upside 0.715 would be important.
EURJPY:
EURJPY on the 1 hour chart has been fluctuating between the 128.5 and 127.5 range bounds. Keep this one on your radar if you like playing the range.
Related articles
Ready to trade?
It's quick and easy to get started. Apply in minutes with our simple application process.
The material provided here has not been prepared in accordance with legal requirements designed to promote the independence of investment research and as such is considered to be a marketing communication. Whilst it is not subject to any prohibition on dealing ahead of the dissemination of investment research we will not seek to take any advantage before providing it to our clients.
Pepperstone doesn’t represent that the material provided here is accurate, current or complete, and therefore shouldn’t be relied upon as such. The information, whether from a third party or not, isn’t to be considered as a recommendation; or an offer to buy or sell; or the solicitation of an offer to buy or sell any security, financial product or instrument; or to participate in any particular trading strategy. It does not take into account readers’ financial situation or investment objectives. We advise any readers of this content to seek their own advice. Without the approval of Pepperstone, reproduction or redistribution of this information isn’t permitted.
.jpg)

