- English


AMD Q3 Earnings Preview: Can AMD Q3 Earnings Preview: Can Confidence in AI Growth Hold Up After the Selloff?

Strong Growth Is Already Built Into Expectations
Consensus estimates point to revenue of $13 billion and adjusted earnings per share of $1.94, representing year-on-year growth of approximately 41% and 62%, respectively. The adjusted earnings consensus stands at the same level, while unofficial estimates are $1.98. These figures already reflect expectations of operational improvement. Strong growth alone may therefore be insufficient to support the stock unless accompanied by a positive outlook for the coming period.
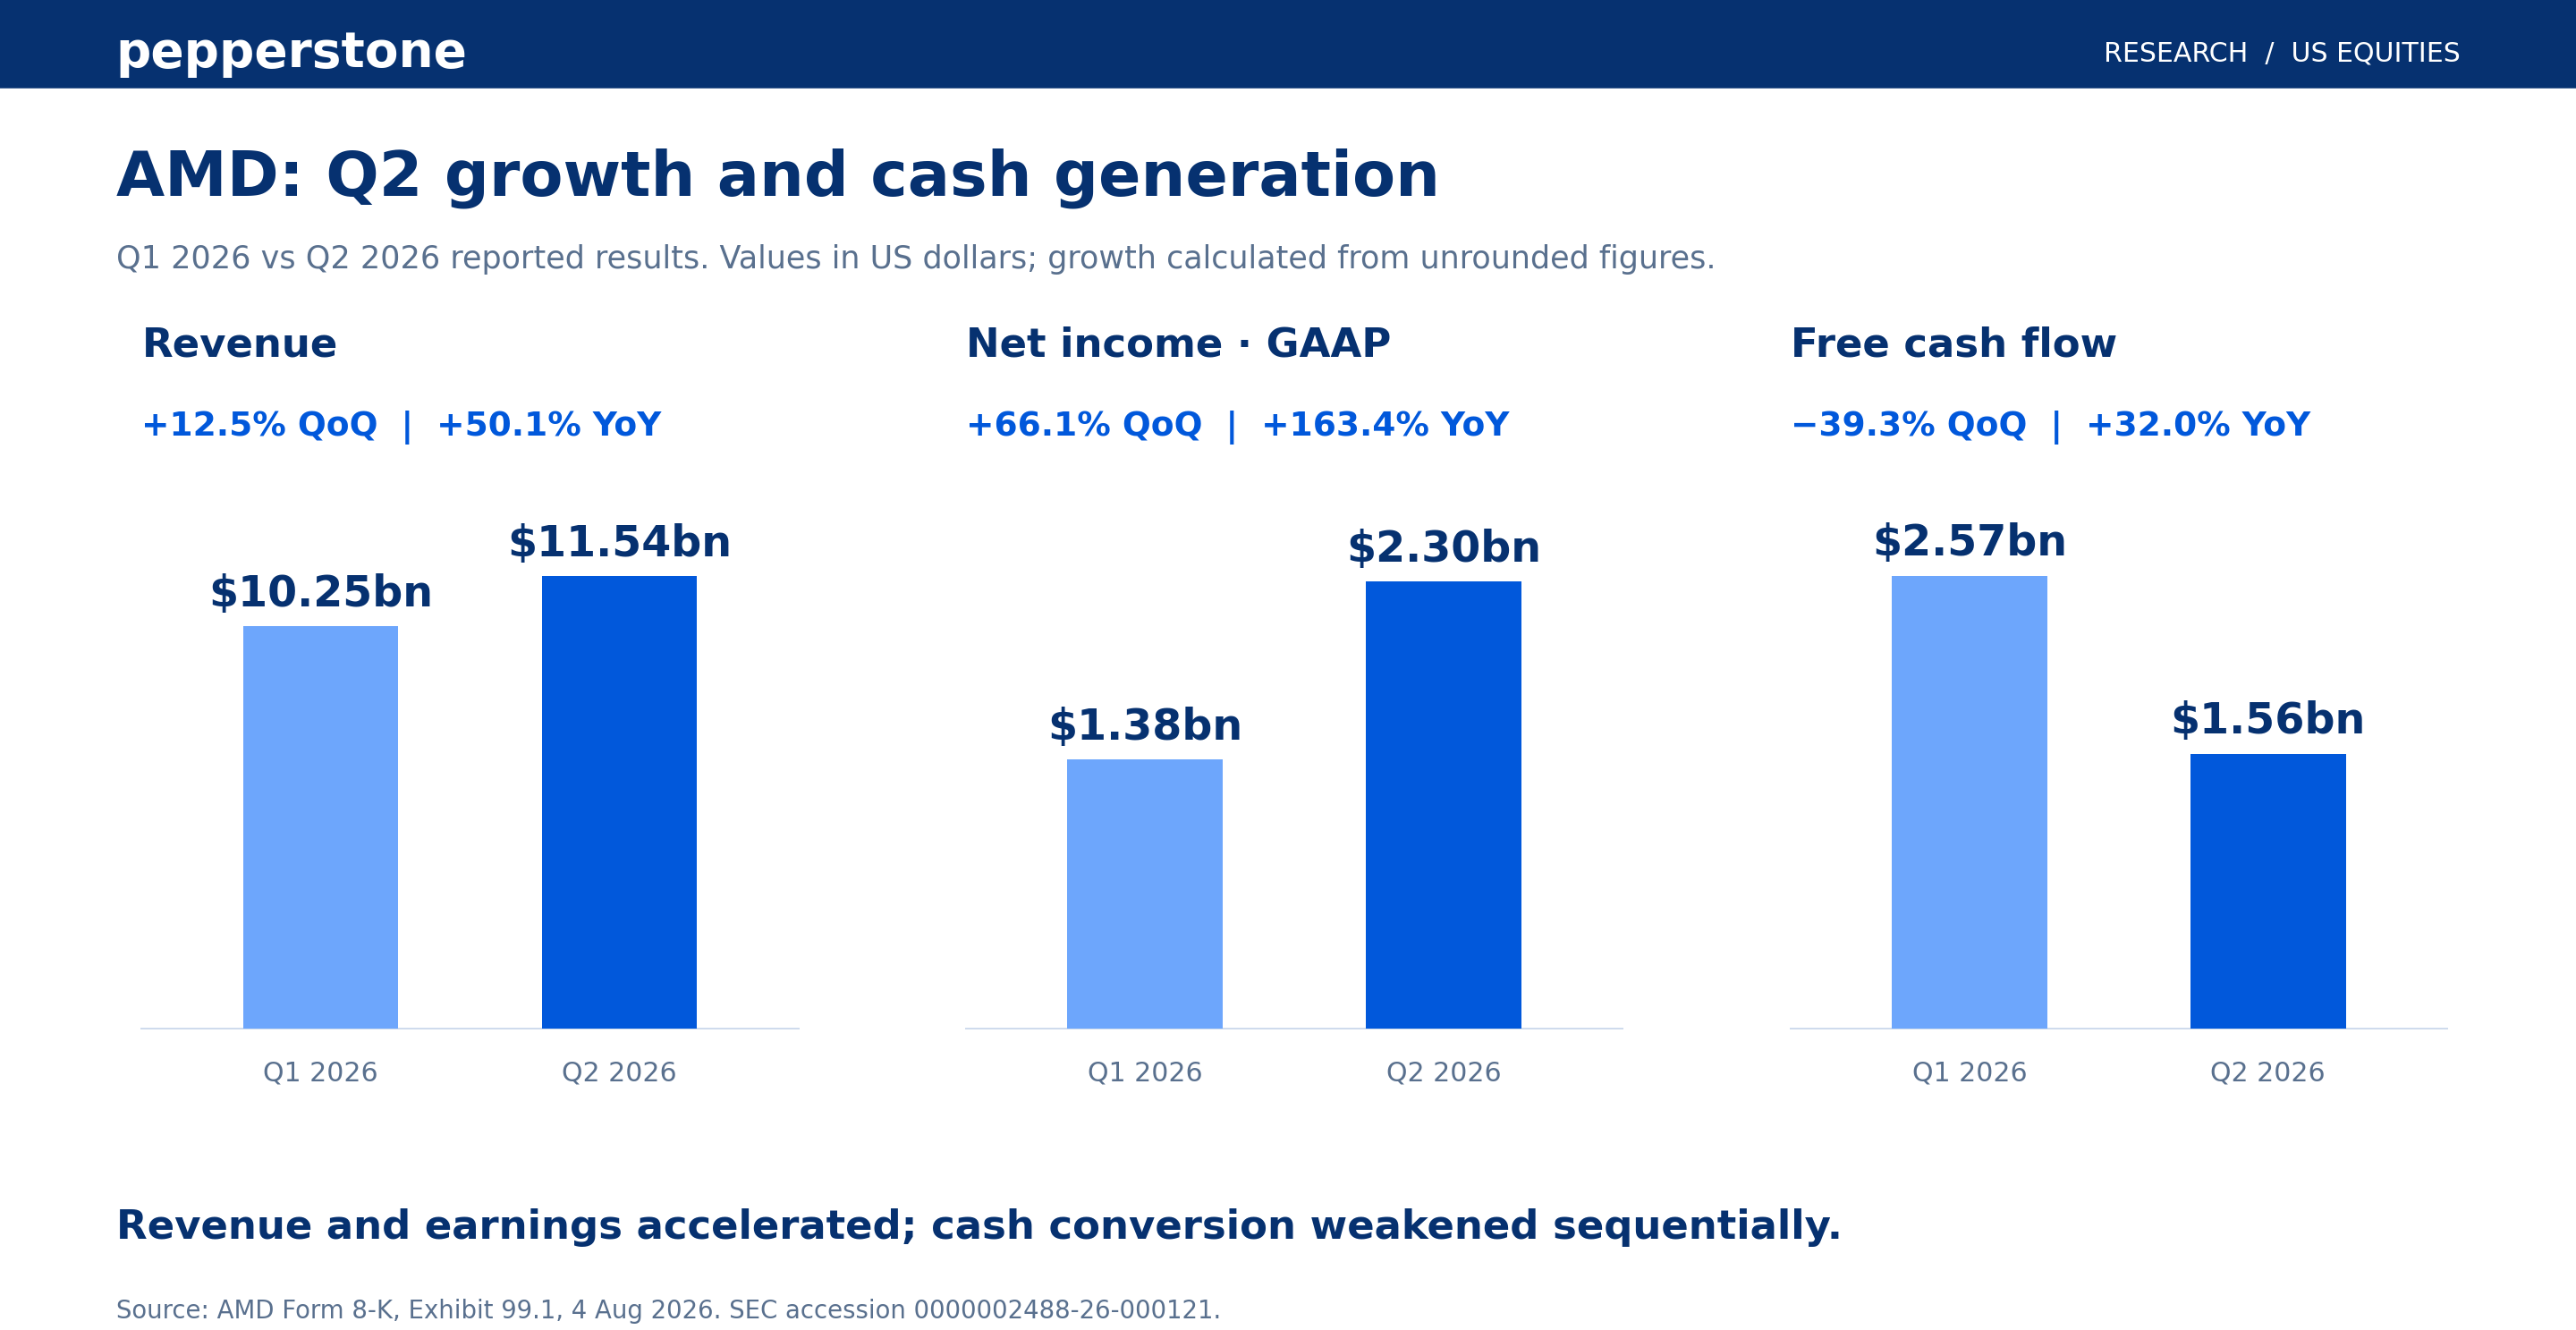
Revenue expectations sit marginally above the $13 billion midpoint of AMD’s guidance range of $12.7 billion to $13.3 billion. Revenue approaching the upper end would therefore reflect successful execution but would remain within the framework management has already outlined and the share priced in after the last earning call. A more convincing positive surprise would combine stronger sales, resilient profitability and an improved outlook. The company previously guided for an adjusted gross margin of approximately 56%, making the quality of incremental revenue an important test alongside its scale.
Data Centres: From Customer Commitments to Revenue
Second-quarter data centre revenue reached $6.7 billion, up 107% year on year and accounting for 58% of total company revenue. This concentration means AMD’s overall performance increasingly depends on contributions from EPYC server processors and accelerators. Distinguishing between the two businesses is important as strong demand for server processors supports earnings, but does not, on its own, demonstrate that the company is capturing a larger share of AI accelerator spending. Clearer disclosure of each business’s contribution would strengthen confidence in the sustainability of growth.
Management previously highlighted the launch of Helios rack-scale systems, the MI400 accelerator family and expanding customer relationships. The upcoming earnings call should help clarify how these announcements translate into actual deployment schedules and recognised revenue. The distinction between a multiyear investment commitment and near-term shipments has direct significance for investors. Customer adoption of AMD’s technology supports the strategic opportunity, but installation schedules, system readiness and the conversion of demand into sales determine how quickly that opportunity feeds through to the income statement. Specific delivery milestones will carry more weight than further broad statements about the size of the AI market.
Margins and Cash Flow Test the Quality of Growth
Margins will help reveal the economics of this expansion. A larger contribution from data centres should support profitability, although product-generation transitions and the costs of scaling deliveries of integrated systems could affect quarterly results. The conversion of earnings into cash deserves similar attention. AMD generated $1.56 billion in free cash flow in the second quarter, compared with $2.57 billion in the first quarter, despite higher revenue. This alone is insufficient to conclude that conditions are deteriorating, but it raises important questions about inventory, receivables and working capital requirements. Sales growth becomes more valuable when cash flow improves alongside it.
Other businesses provide a complementary indication of the breadth of demand. In the second quarter, PC revenue increased 23% to $3.1 billion, while gaming revenue declined 31% to $779 million. Embedded revenue rose 19% to $977 million. Continued resilience outside data centres could support earnings if the pace of AI shipments fluctuates. Conversely, weaker consumer demand or gaming activity would increase pressure on the AI business to deliver both growth and profitability, making the investment outlook more dependent on a single spending cycle.
Share Price Action Reflects a More Cautious Market
AMD shares closed the 23 October session at $516, recovering after declines in previous sessions. Nevertheless, the stock remained approximately 136% lower since the beginning of the year, having fallen from a recorded high of $658. The retreat partly reflects broader concerns, as semiconductor shares came under significant pressure amid investor doubts about the returns on substantial AI spending. The correction may have eased some positioning-related pressures, but it does not automatically mean earnings expectations have become conservative.
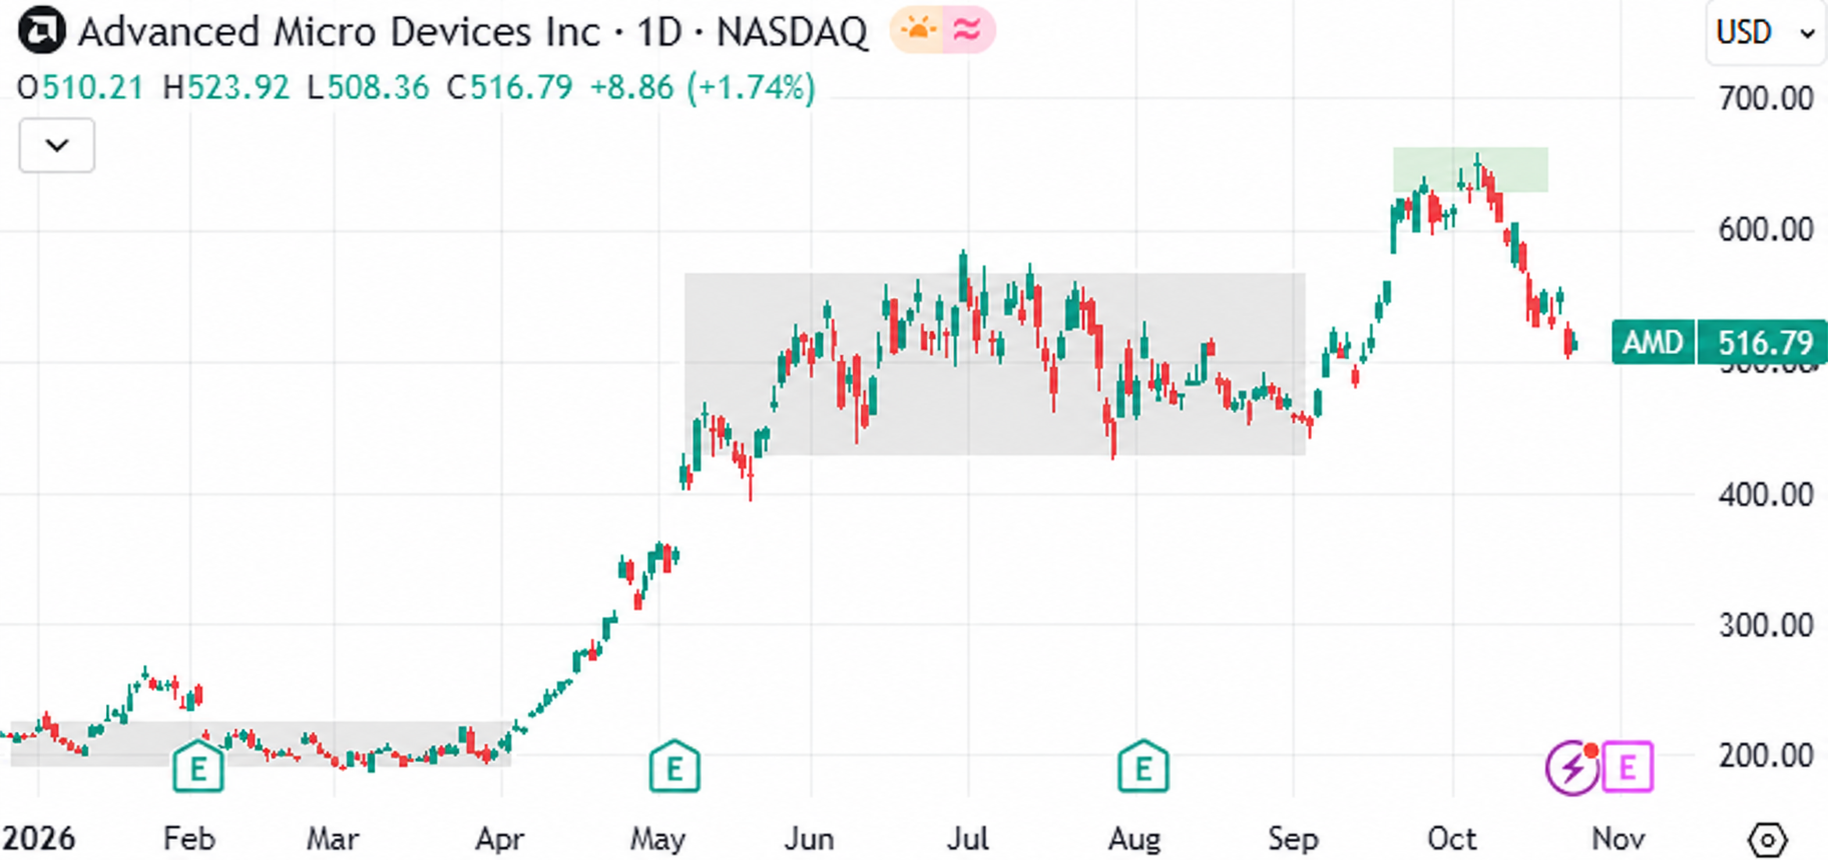
From current levels, $500 represents a nearby psychological reference point, rather than a soild technical support level. Trading below it after the results could indicate that investors are demanding a larger valuation adjustment. On the upside, the $570–571 area, close to the 14 October closing price, provides a reference area for recovering part of the losses incurred during the correction. Reclaiming this area would offer stronger evidence of improving confidence than a brief rebound in after-hours trading.
Forward Guidance Will Determine the Prospects for Sustaining Confidence
The strongest outcome would combine revenue above expectations, stable or improving margins, greater clarity on AI shipments and convincing forward guidance. An earnings beat accompanied by cautious commentary could still disappoint the market. AMD’s opportunity remains substantial, but the upcoming report needs to explain how deployment momentum translates into sustainable earnings and cash flow. That evidence will determine whether the recent correction sets the stage for a recovery or reflects a more lasting reassessment.
Sources:
SEC AMD report filling
Visuals by OpenAI
AMD investor center for management commentary insights
The material provided here has not been prepared in accordance with legal requirements designed to promote the independence of investment research and as such is considered to be a marketing communication. Whilst it is not subject to any prohibition on dealing ahead of the dissemination of investment research we will not seek to take any advantage before providing it to our clients.
Pepperstone doesn’t represent that the material provided here is accurate, current or complete, and therefore shouldn’t be relied upon as such. The information, whether from a third party or not, isn’t to be considered as a recommendation; or an offer to buy or sell; or the solicitation of an offer to buy or sell any security, financial product or instrument; or to participate in any particular trading strategy. It does not take into account readers’ financial situation or investment objectives. We advise any readers of this content to seek their own advice. Without the approval of Pepperstone, reproduction or redistribution of this information isn’t permitted.