- English


Q2 2026 Baseline
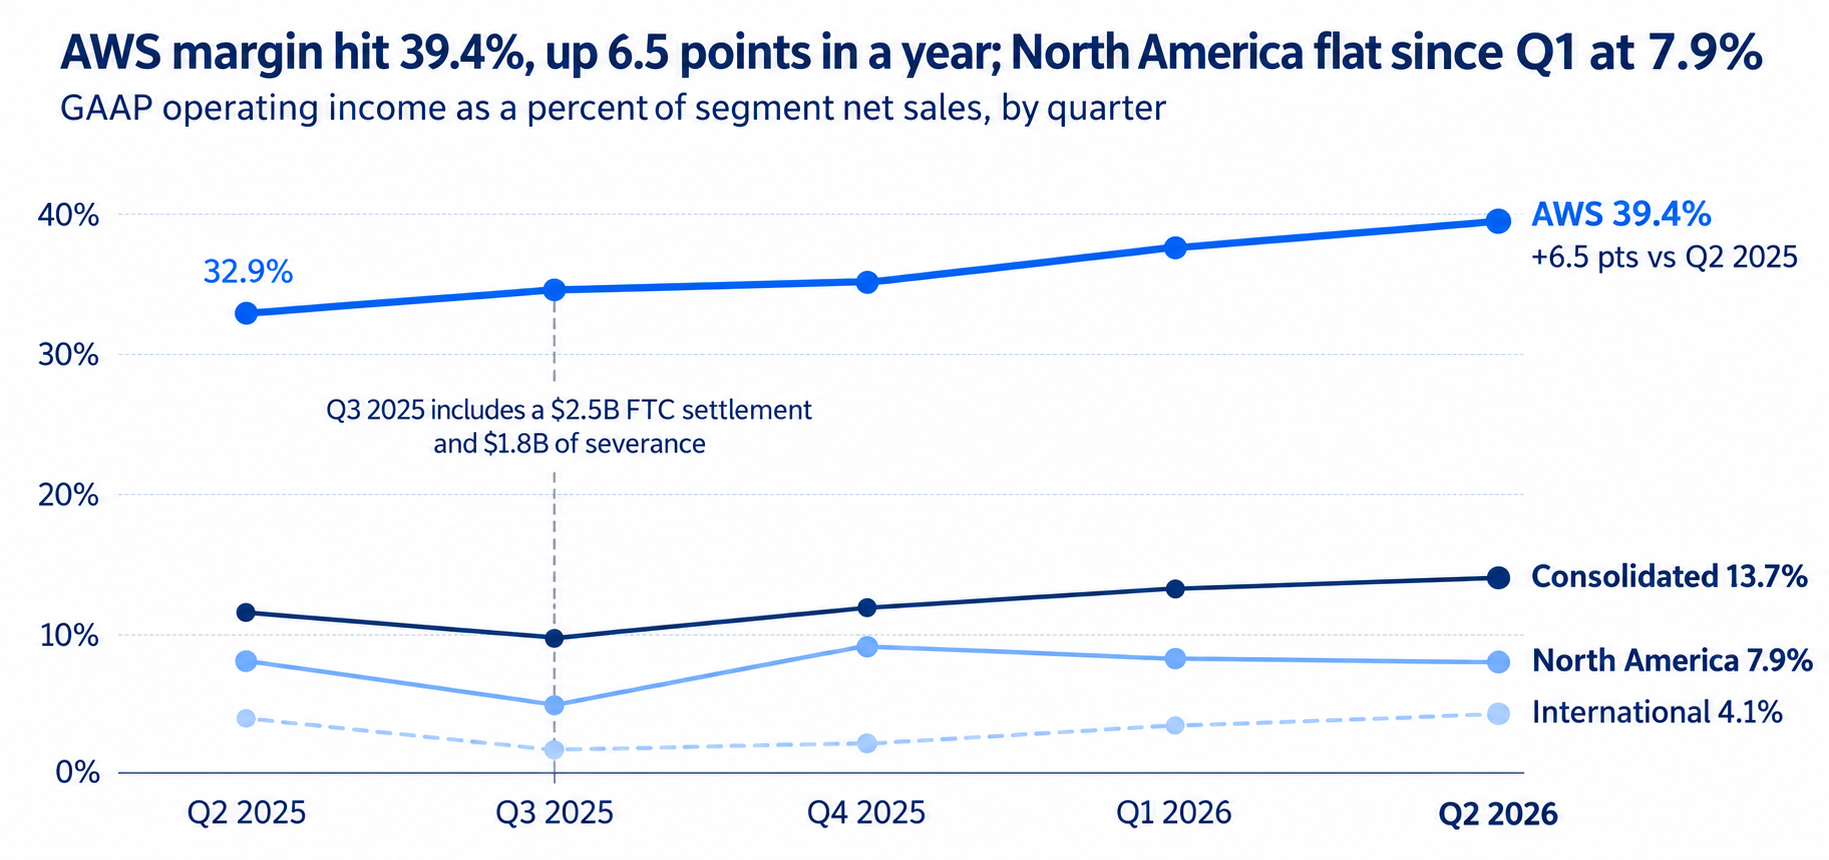
Amazon’s Q2 2026 report set a high bar as sales rose 20% to $200.6B and operating income rose 43% to $27.5B, a 13.7% margin against 11.4% a year earlier. Both beat guidance and consensus. AWS grew 37% to $42.2B, which is its fastest pace in 18 quarters at a 39.4% margin, and advertising grew 26% to $19.8B.
Earnings quality was mixed, net income of $62.6B (EPS $5.75) included a $53.4B pre-tax gain. Excluding other income, EPS was about $1.95, or $1.87 without roughly $1.15B of one-off expense benefits (tariff refunds and an energy-contract gain), against $1.81-1.83 expected.
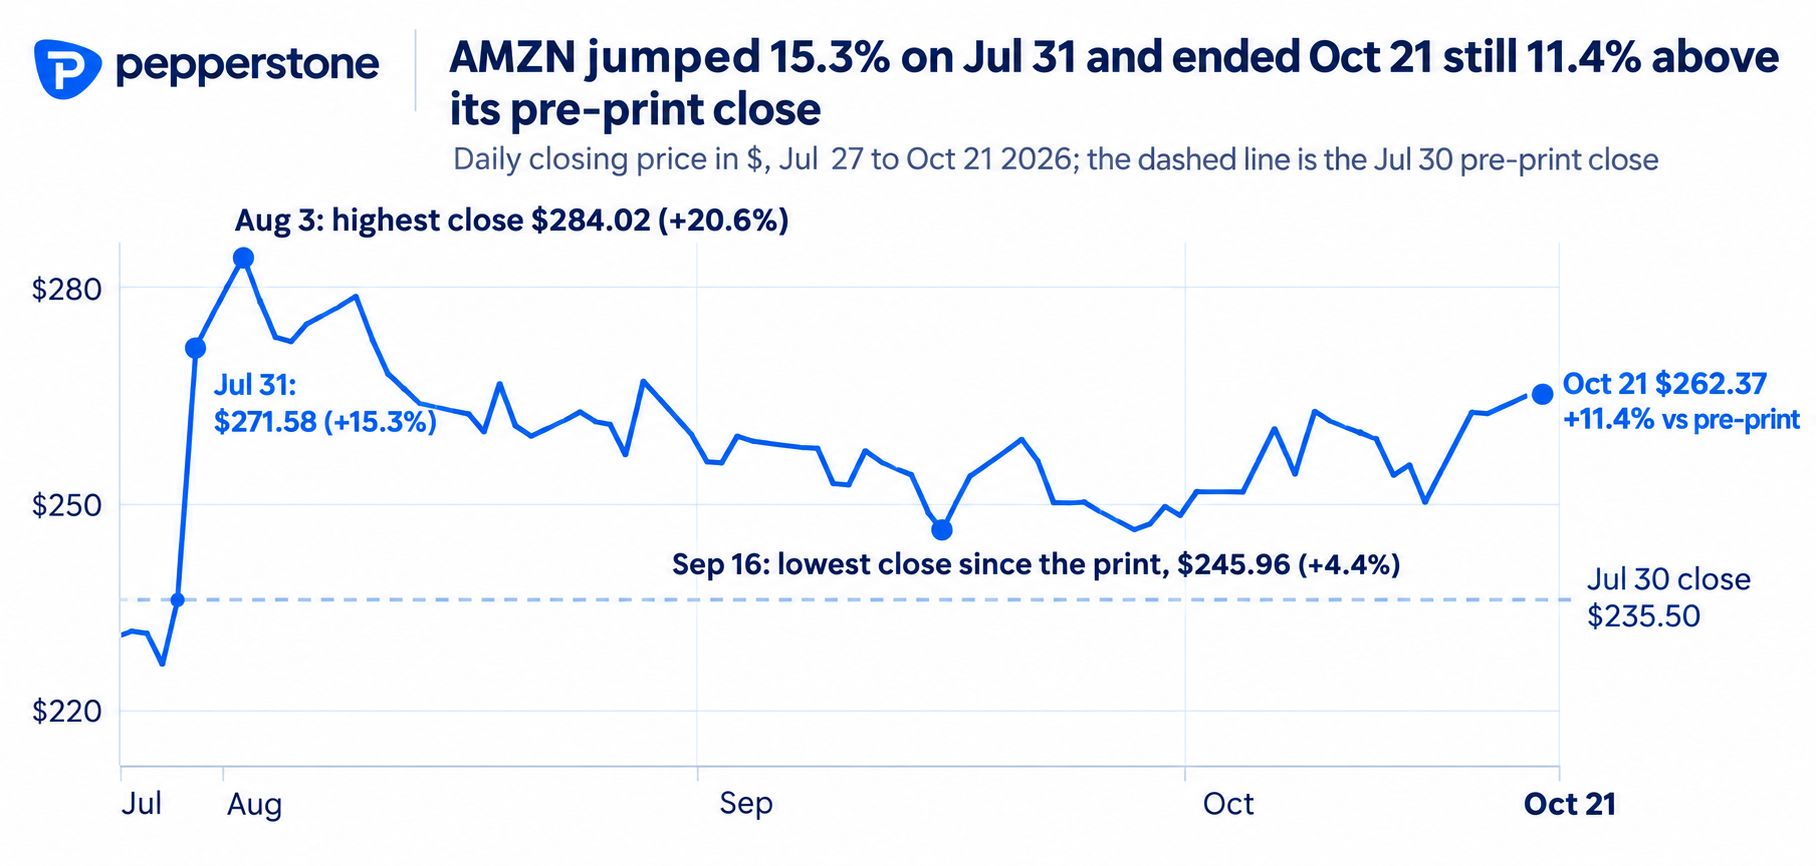
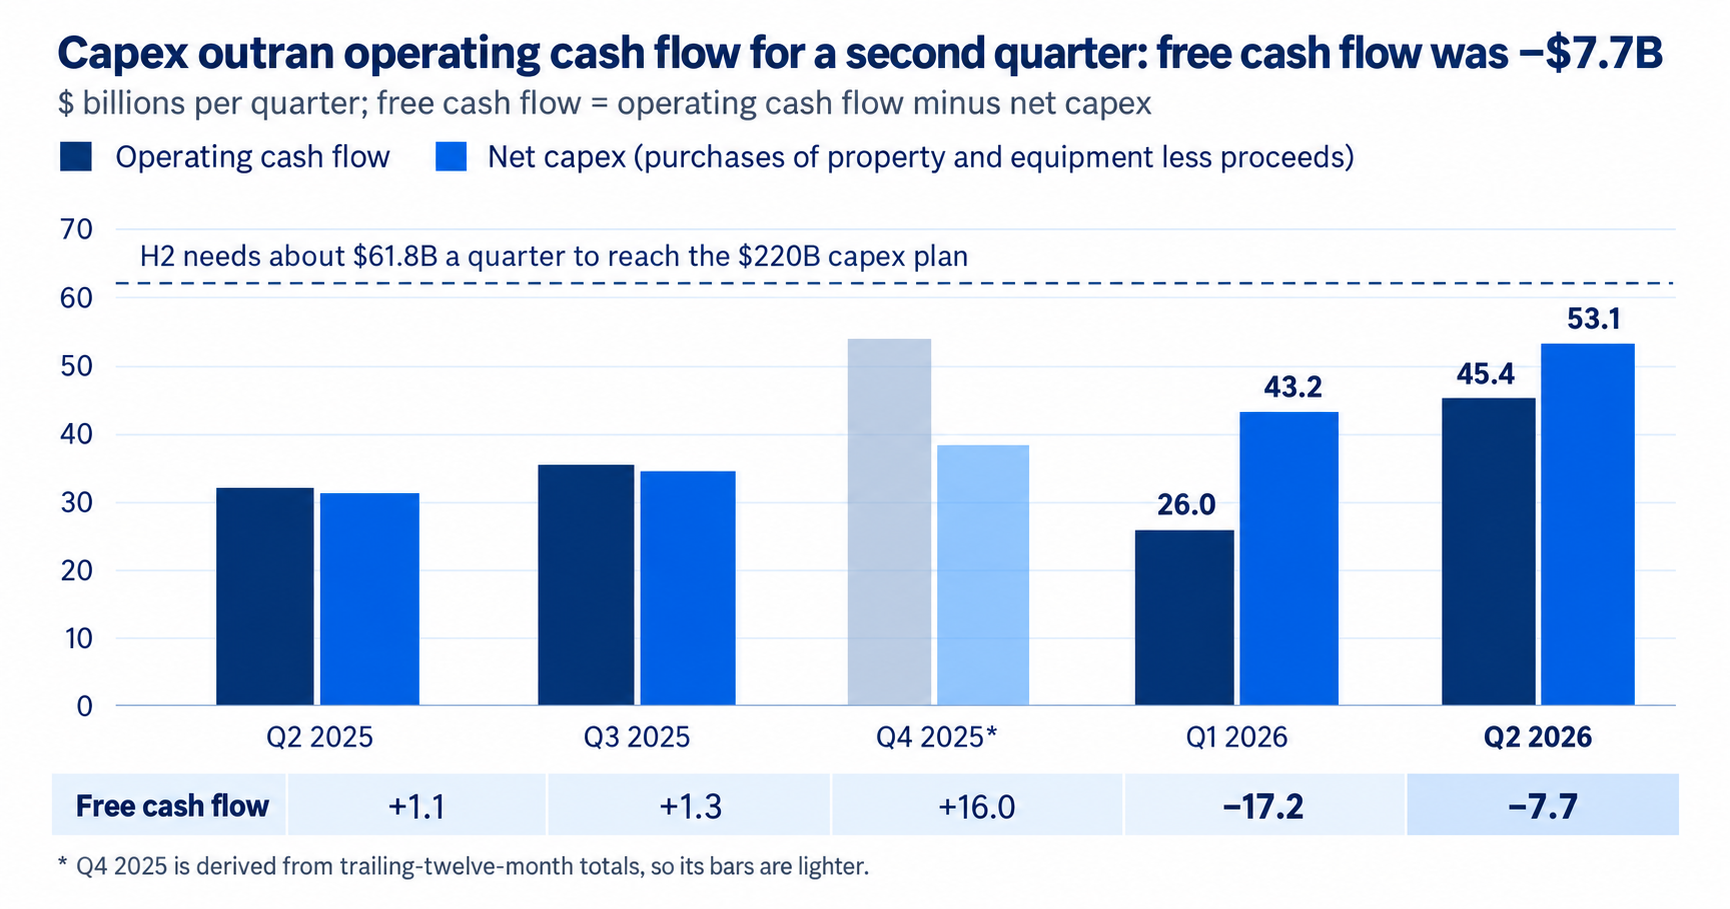
Cash was the weak spot with net capex reached $53.1B, the 2026 plan rose to about $220B from $200B, and trailing free cash flow turned negative at −$7.6B. Shares jumped 15.3% the next day and closed at $262.37 on 21 October.
Consensus and Guidance
Consensus EPS is $1.96 on revenue of around $202B, against $1.95 and $180.17B a year ago. That implies revenue growth of about 12% but EPS growth of only 0.5%.
Amazon guided sales to $197 - 202 B, up 9-12% including about 80 basis points of currency headwind, and operating income to $22.5 - 26.5B. Consensus revenue therefore sits just above the top of the range. Amazon beat its Q2 guidance on both lines, which explains why analysts lean high for Q3.
Two adjustments are important, Prime Day moved into Q2, so Q3 growth would be nearly 400 basis points higher without the shift. And last year's $17 B operating income included a $2.5B FTC settlement and $1.8B of severance, so the guidance midpoint is about 13% above the underlying base of Q2. Consensus EPS also excludes Anthropic marks, which is why Q2 consensus was $1.82 against reported EPS of $5.75.
AWS and AI
Analysts expect AWS growth of around 35%, a step down from Q2, which can be the number that decides the reaction. A slowdown would partly reflect a larger base of $42.2B and less about weaker demand.
Demand indicators remain strong as backlog was about $496B, growing at triple-digit rates, and Amazon's AI and chips businesses each run above $25B a year. Management said power capacity will stay short through 2027, so growth is limited by supply more than orders.
Margin is the second test as Q2's 39.4% included $551M of energy-contract gains. Without them AWS would be about 38%, so a result near that level would show stable underlying profitability. Azure and Google Cloud grew faster from smaller bases in Q2, so market-share commentary will also draw attention.
Retail, Advertising and Subscriptions
Retail growth will look softer year on year because Prime Day left Q3. North America grew 16% and International 15% in Q2, and both should decelerate, although underlying trends are healthy: third-party seller services grew 16% and online stores 15%.
Advertising grew 26% in Q2, up from 22% excluding currency a quarter earlier, helped by AI ad tools and Prime Video live sports. The Prime Day shift may temper Q3 growth, but a rate above 20% would confirm the trend. Subscriptions grew 12% to $13.7B and are the steadiest line.
Costs need watching, management cited higher transportation costs from fuel inflation, and the roughly $600M of North American tariff refunds that helped Q2 is unlikely to repeat.
Profitability, Cash Flow and Capex
The operating income guide midpoint of $24.5B is below Q2's $27.5B. On the $199.5B sales midpoint it implies a margin of about 12.3%, against 13.7% reported in Q2 and 13.1% without the one-off items. Amazon has beaten the top of its operating income guidance before, but the range assumes no energy-derivative remeasurement.
Capex is the larger debate with $220B 2026 plan implies about $61.8B a quarter in the second half, 17% above Q2's $53.1B. Free cash flow should stay negative, and long-term debt already rose to $128.9B from $65.6B at year-end. The $21.3B invested in OpenAI after 30 June will appear in investing cash flow, not free cash flow. Investors will look for any further capex increase after July's $20B rise, which management attributed to higher memory costs.
Key Risks and Wildcards
- Anthropic marks. Amazon's Anthropic holdings were carried at $190.4B at 30 June. Any new pricing event, such as the reported IPO talk, could move GAAP EPS.
- High expectations. The stock closed at $262.37 on 21 October, still 11.4% above its pre-Q2 close.
- Capex and funding. A further capex rise or more debt issuance would deepen free cash flow concerns.
- Cost inflation. Fuel, memory prices and tariffs could pressure margins.
A reasonable base case is revenue at or just above the top of the $197-202B guide, operating income in the upper half of $22.5–26.5B, and AWS growth in the mid 30s. That would meet consensus but not produce another 15% jump. The stock reaction will hinge on AWS growth, the capex outlook and how much of the margin is repeatable.
The material provided here has not been prepared in accordance with legal requirements designed to promote the independence of investment research and as such is considered to be a marketing communication. Whilst it is not subject to any prohibition on dealing ahead of the dissemination of investment research we will not seek to take any advantage before providing it to our clients.
Pepperstone doesn’t represent that the material provided here is accurate, current or complete, and therefore shouldn’t be relied upon as such. The information, whether from a third party or not, isn’t to be considered as a recommendation; or an offer to buy or sell; or the solicitation of an offer to buy or sell any security, financial product or instrument; or to participate in any particular trading strategy. It does not take into account readers’ financial situation or investment objectives. We advise any readers of this content to seek their own advice. Without the approval of Pepperstone, reproduction or redistribution of this information isn’t permitted.