- English
- عربي
Analysis
Trading commodities in times of high volatility and global uncertainty
(US Dollar Index) losing steam from highs above 99.40 to reaching current lows around the 98.00 level. The general market sentiment is also being dented by fears the potential coronavirus pandemic could further hurt the US economies’ growth story for 2020. Next weeks’ US ISM data is sure to be watched closely by traders as any economic weakness may rattle the broader markets.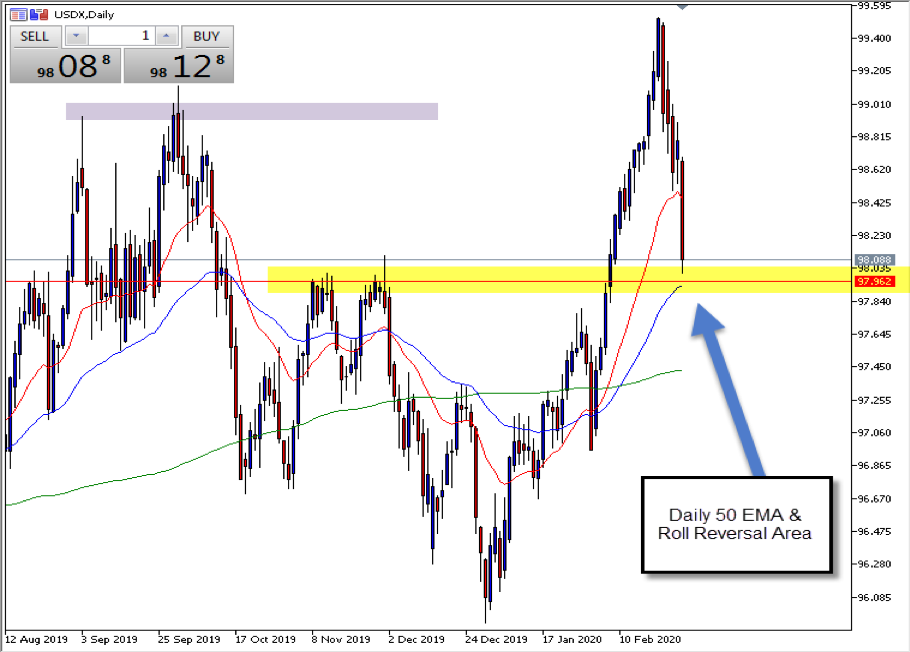 The USDX has fast approached the 50 EMA on the daily chart. This level presents a roll reversal area, with previous resistance levels that formed last October and November now acting as a probable support area for the market to consolidate.
Global economic health and potential early insights trading copper
Copper is a well-known base metal that is associated with a broad range of applications including heavy industry, transport, communication and utilities projects. What is not as well known is the link between copper and broader economic health. In the last 30 years, the growth rate of copper usage globally has only been negative over a period of five years. Interestingly, an economic slowdown was present in four of those five years, signaling that a slowdown in copper consumption can be a leading indicator to a global slowdown in growth and a weakening economy.Coppers’ technical love affair with round numbers
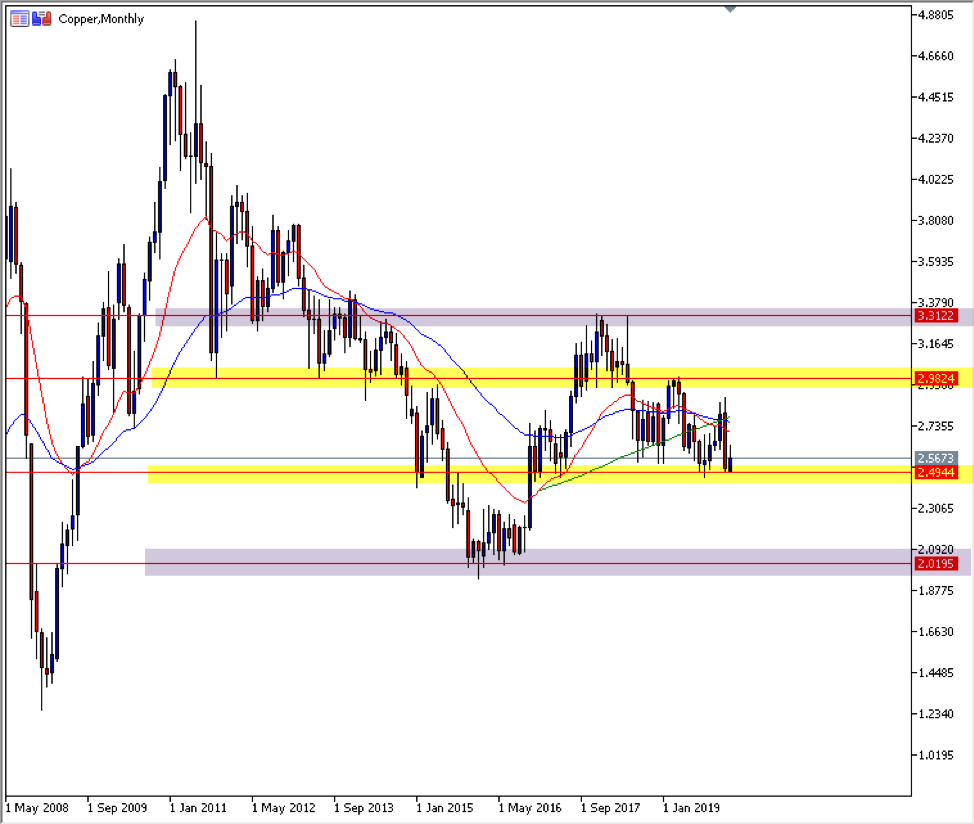
The copper monthly chart above demonstrates some interesting key areas that copper often trades within. What’s more interesting is that when one of these key levels is broken, the market generally gravitates to a price of around fifty cents lower or higher.
Trading commodities during highly volatile periods
Poor US economic figures and the potential of the coronavirus becoming a
global pandemichave seen significant rises in volatility over the past week. Commodities are often heavily affected during these times and key support or resistance zones are generally broken, leading to potential trading opportunities. Below is some commentary about XTIUSD and the technical indicators leading into its recent weakness.
XTIUSD weekly support has broken
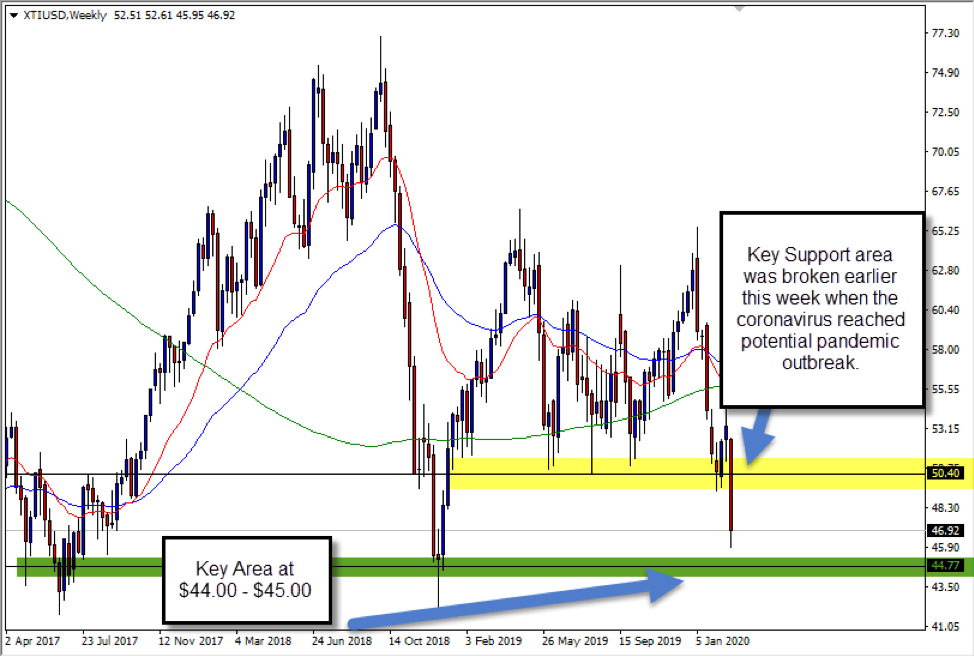 The chart above displays a new lower low on the XTIUSD Weekly chart, exposing XTIUSD to further weakness. The 2018 lows of $44.00 - $45.00 a barrel (highlighted in green) could now become the next level of significant support in the coming weeks.
XTIUSD daily - A shooting star bodes badly for oil bulls
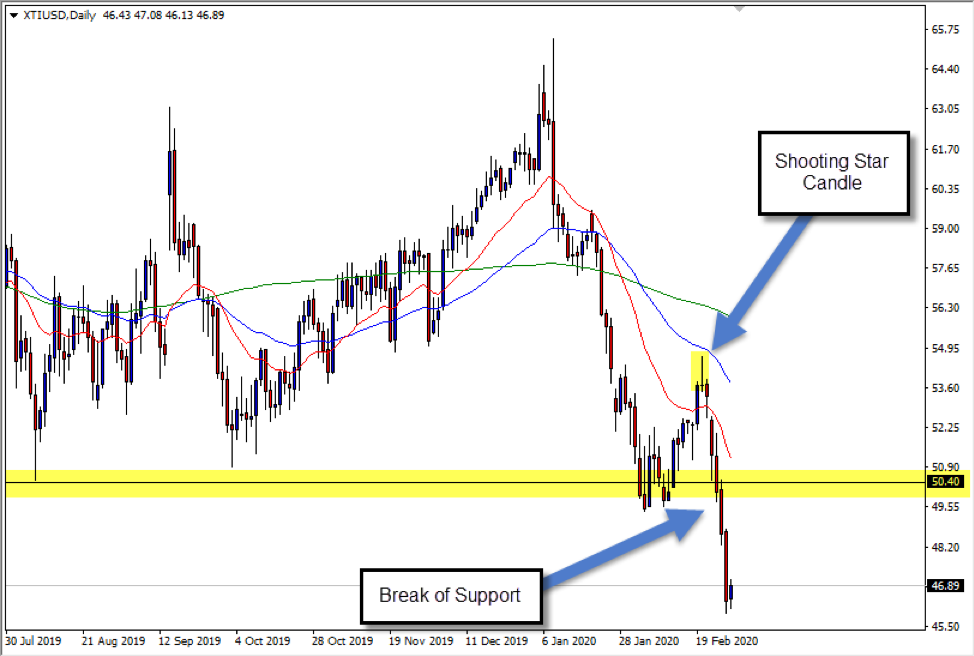
The chart above displays a shooting star candle formation that took place at the price of $53.60. A shooting star is considered a bearish reversal signal and can be very influential, especially when it presents in the direction of the prevailing long-term trend. The price gap on Monday this week highlighted the fact that the sellers were firmly in control, with the support at $50.40 broken soon after, exposing the 2018 weekly lows mentioned earlier.
Aggressive trend, aggressive technical opportunities
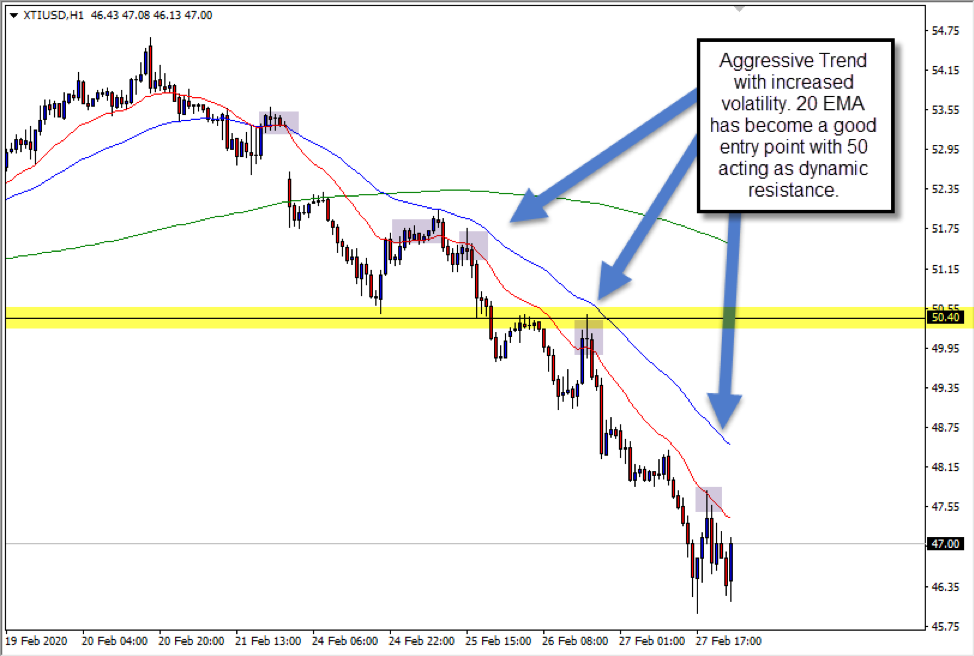 XTIUSD was already in a downtrend on the 1hr chart above, but you can see the 20/50 EMA cross signaled an opportunity to start trading a trend of dynamic resistance. Once there were two touches of the 20 EMA followed by bearish momentum, traders could start to use the technical analysis method to target the 20 EMA as dynamic resistance while the trend remains intact. The 50 EMA can also act as a dynamic resistance marker for a potential trailing stop loss.
Commodities links to the broader global economy
It is clear to see that when volatility in the market increases, many commodities also become volatile. It is important to understand that a break of key levels can add to the significance of the opportunity. As was demonstrated with XTIUSD and Copper, breaks of key levels can lead to fast and sharp movements in the market as price reaches the next level of support or resistance.Ready to trade?
It's quick and easy to get started. Apply in minutes with our simple application process.
The material provided here has not been prepared in accordance with legal requirements designed to promote the independence of investment research and as such is considered to be a marketing communication. Whilst it is not subject to any prohibition on dealing ahead of the dissemination of investment research we will not seek to take any advantage before providing it to our clients.
Pepperstone doesn’t represent that the material provided here is accurate, current or complete, and therefore shouldn’t be relied upon as such. The information, whether from a third party or not, isn’t to be considered as a recommendation; or an offer to buy or sell; or the solicitation of an offer to buy or sell any security, financial product or instrument; or to participate in any particular trading strategy. It does not take into account readers’ financial situation or investment objectives. We advise any readers of this content to seek their own advice. Without the approval of Pepperstone, reproduction or redistribution of this information isn’t permitted.