- English
- عربي

Why are investors so enthusiastic about Tesla stock?
Tesla released its fourth quarter results of the back of an already positive report causing much fanfare amongst not only Elon Musk supporters but Wall Street professionals. The news of their falling production costs of about 7% last year, improved sales of 15 percent and an increase in deliveries has shown everyone that the company is again on the right track. The speed of their Shanghai factory producing vehicles and another under construction in Europe just took an already fever pitch excitement to the next level causing a six-day multibillion-dollar super rally.
Tesla’s mania rally similar to the likes of Bitcoin
Tesla shares have experienced a cryptocurrency like move with similarities between the meteoric rise of the likes of Bitcoin and Ethereum during 2017. The only problem with a rise this fast is how we as technical traders attempt to take advantage of such a situation and what signals we can look for to assess how long the run might last?
Using moving averages to trade a runaway stock
One of the main technical indicators often used during a large move on any pair are moving averages. A moving average (MA) is a popular dynamic indicator used by technical analysts to help smooth out price action by calculating a line based on a defined number of time periods. The two main types of moving average that most traders will use are a simple moving average (SMA) and an exponential moving average (EMA). EMA’s are more sensitive than SMA’s, as their calculation gives a greater weight to the more recent periods.
Some common moving averages used in the stock and currency markets are the 20 EMA and 50 EMA, and for this exercise we'll focus on these two indicators to help understand how a trader can join an existing rallying trend. Generally, the 20 EMA acts as dynamic support or resistance when analysing an aggressive trend and can be used effectively on the 1hr, 4hr and daily timeframes. Before looking at a stock like Tesla, it's always important to consider other large breakout moves. Researching previous aggressive tech stock moves from the US market can help a trader formulate a plan to trade a similar scenario. Below we have some examples to look at before assessing Tesla.
The rise of Adobe Systems (4hr chart)
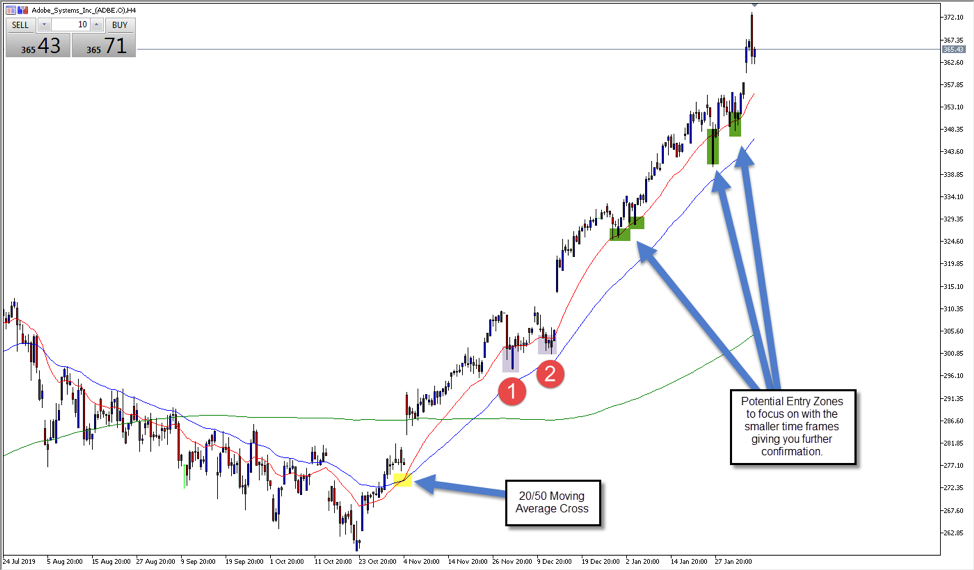
As we can see in the chart above Adobe presented a common 20/50 cross to begin its upward momentum, followed by a move that did not pullback to the 20-moving average until the price of $300 was reached. Once there were two touches of the 20 moving average followed by bullish momentum, a trader could start to use technical analysis to target the theory of the 20 EMA acting as dynamic support while the trend remains intact. Traders could also choose to use the 50 EMA as a level of dynamic support for a trailing stop loss, as the price has failed to pierce this level, and is a well-respected moving average amongst professional traders.
The rise of Apple Inc (4hr chart)
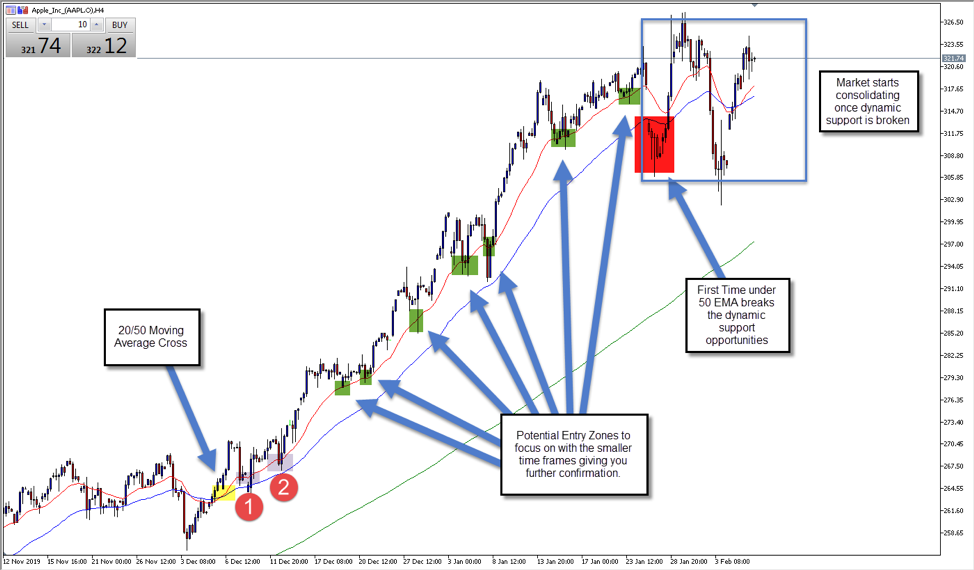
Apple was already in an uptrend during this following chart, but you can see the new 20/50 EMA cross became the opportunity to start seeing a trend of dynamic support. Once there was evidence of two touches of the 20 EMA followed by bullish momentum, traders can start to use technical analysis to target the theory of the 20 EMA acting as dynamic support while the trend remains intact. In the case of Apple, the 20 EMA provided several great buying opportunities to join the existing trend and until the level of $320 was reached, the momentum remained strong. By following the trade with the 50 EMA, it became apparent that the failure to pierce this level meant that any break below the 50 EMA would most likely signal the beginning of a new consolidation zone or the transition into a downtrend. In this case Apple has remained in a consolidation zone and a trader can adjust their strategy based on current price action for this stock.
The rise of Tesla Inc (4hr chart)
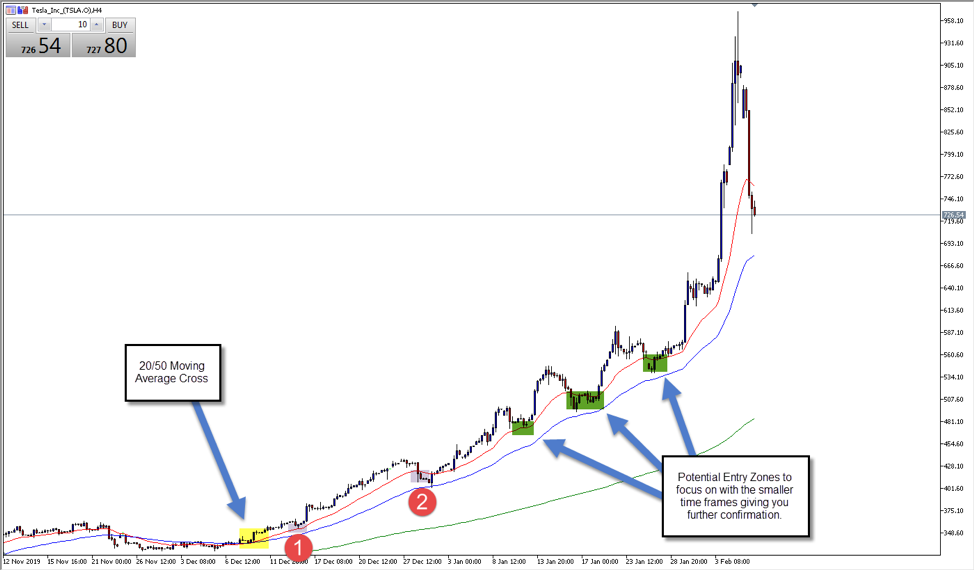
Tesla was also already in an uptrend during the chart above, but you can see the new 20/50 EMA cross signaled the opportunity to start seeing a trend of dynamic support. Once there was evidence of two touches of the 20 EMA followed by bullish momentum, traders can start to use technical analysis to target the theory of the 20 EMA acting as dynamic support while the trend remains intact. As mentioned earlier, traders could also use the 50 EMA as a level of dynamic support.
Trading any sort of aggressive breakout can be difficult because a stock or currency may be acting irrationally due to fundamental hype or even FOMO (fear of missing out). By recognising consistent zones such as the 20 and 50 EMA’s traders can join existing trends and just as importantly, maintain their position for as long as possible.
Ready to trade?
It's quick and easy to get started. Apply in minutes with our simple application process.
The material provided here has not been prepared in accordance with legal requirements designed to promote the independence of investment research and as such is considered to be a marketing communication. Whilst it is not subject to any prohibition on dealing ahead of the dissemination of investment research we will not seek to take any advantage before providing it to our clients.
Pepperstone doesn’t represent that the material provided here is accurate, current or complete, and therefore shouldn’t be relied upon as such. The information, whether from a third party or not, isn’t to be considered as a recommendation; or an offer to buy or sell; or the solicitation of an offer to buy or sell any security, financial product or instrument; or to participate in any particular trading strategy. It does not take into account readers’ financial situation or investment objectives. We advise any readers of this content to seek their own advice. Without the approval of Pepperstone, reproduction or redistribution of this information isn’t permitted.