Learn to trade
Why is the dip lower after the merge completes?
The much-hyped Ethereum merge has completed. This has resulted in proof-of-stake being replaced by proof-of-work, cutting the energy use by 99.95%, while making mining unnecessary. So why has ETHUSD lost -10% of its value against the US Dollar on the day of completion?
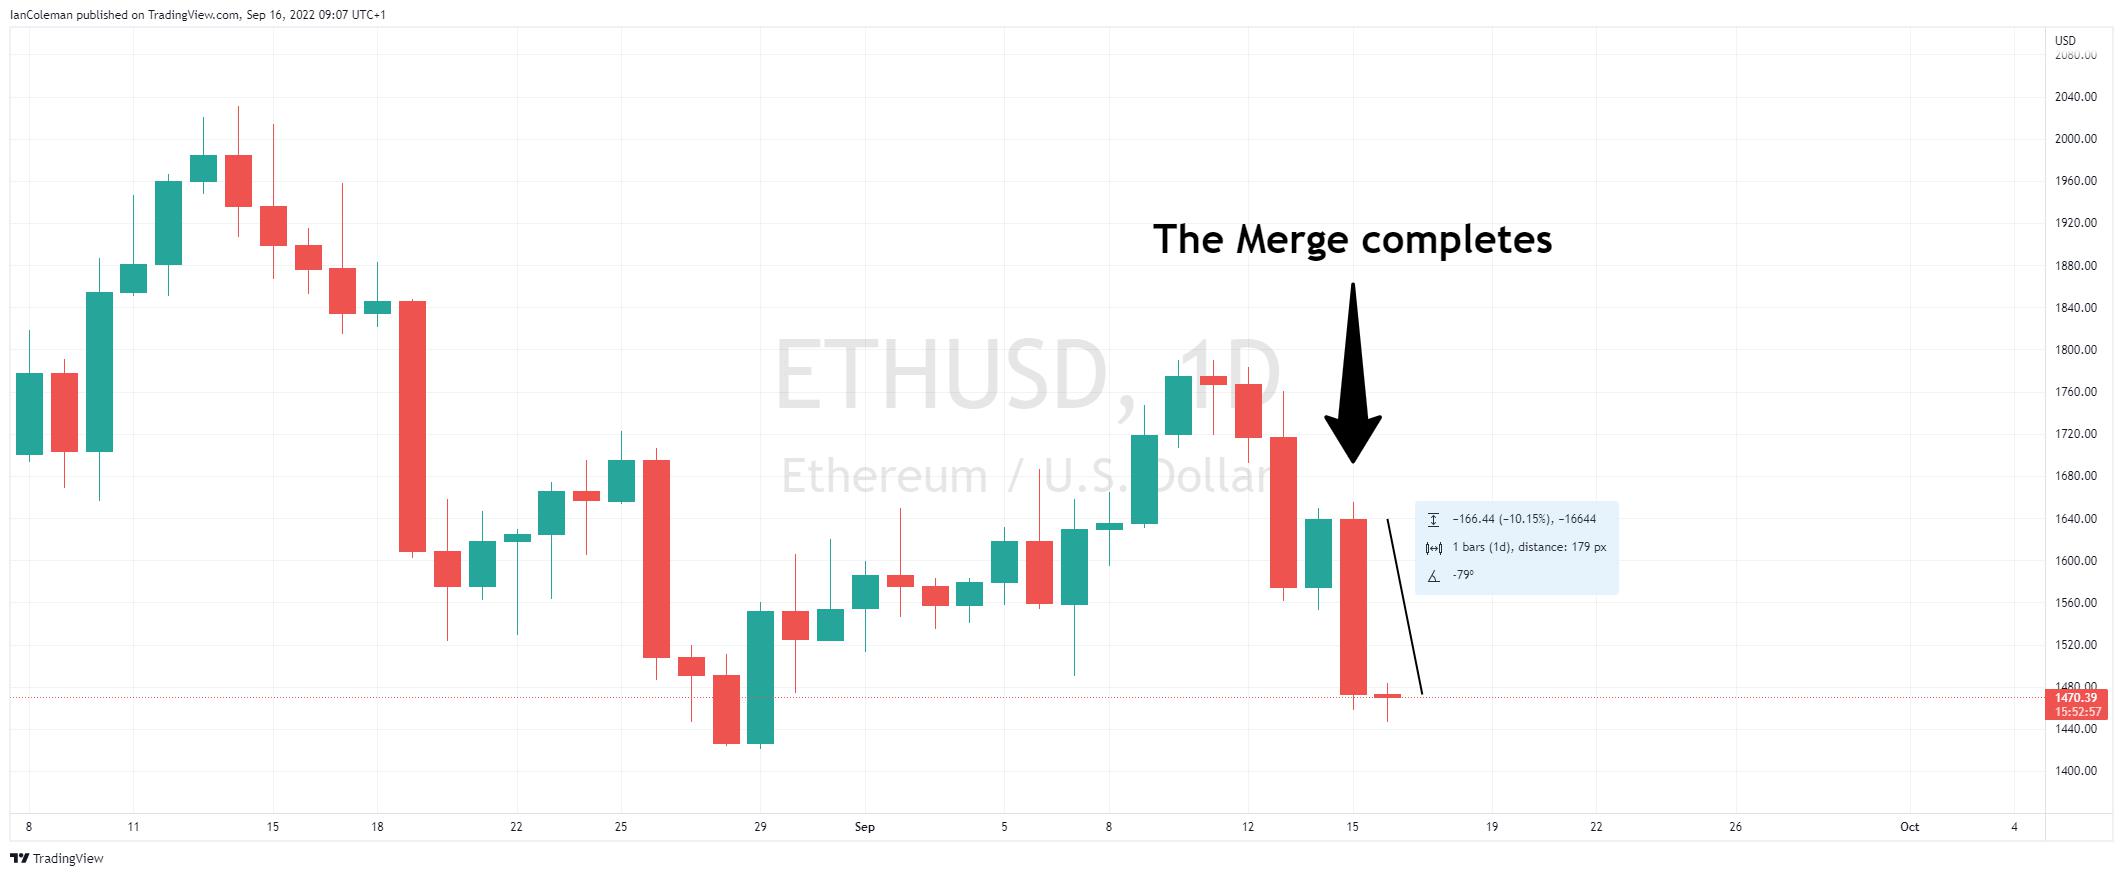
Figure 1 Trading View ETHUSD -10%
There is an old money market saying that goes ‘buy the rumour, sell the fact’. What does that mean?
It can mean that investors were already long Ethereum going into yesterday’s announcement. This was in anticipation of a rally to the upside on completion, expecting other investors to jump on board.
When there are no more buyers, the rules of supply and demand would suggest a dip lower.
Trading against the US Dollar
ETHUSD is Ethereum traded against the US Dollar. Although the Federal Reversal has been hiking rates to try and stall inflation, with this week’s Consumer Price Index figures coming in higher than expected at 8.3 year-on-year (exp. 8.1%), they are fighting an upward battle.
Is there scope for a ‘buy the dip’ scenario?
Let us first look at the US Dollar. We have the FED interest rate decision and policy statement on Wednesday the 21st of September. The consensus is for a hike in rates to 3.25% (from 2.25-2.5%). Will they surprise the market?
Stay ahead of upcoming global events with the Pepperstone economic calendar.
Let us look at the DXY (US Dollar Basket) from a technical view.
We have stalled close to a 78.6% pullback level of 110.17 on the monthly chart (from 120.91-70.71). This is a technical level that will often attract some selling interest or profit taking.
We can also note that we have broken higher through the trend line resistance of the Ending Wedge pattern. However, we have another two weeks until the end of the month. Will sellers emerge to highlight a spike and price rejection? The wedge has an eventual bias to beak lower.
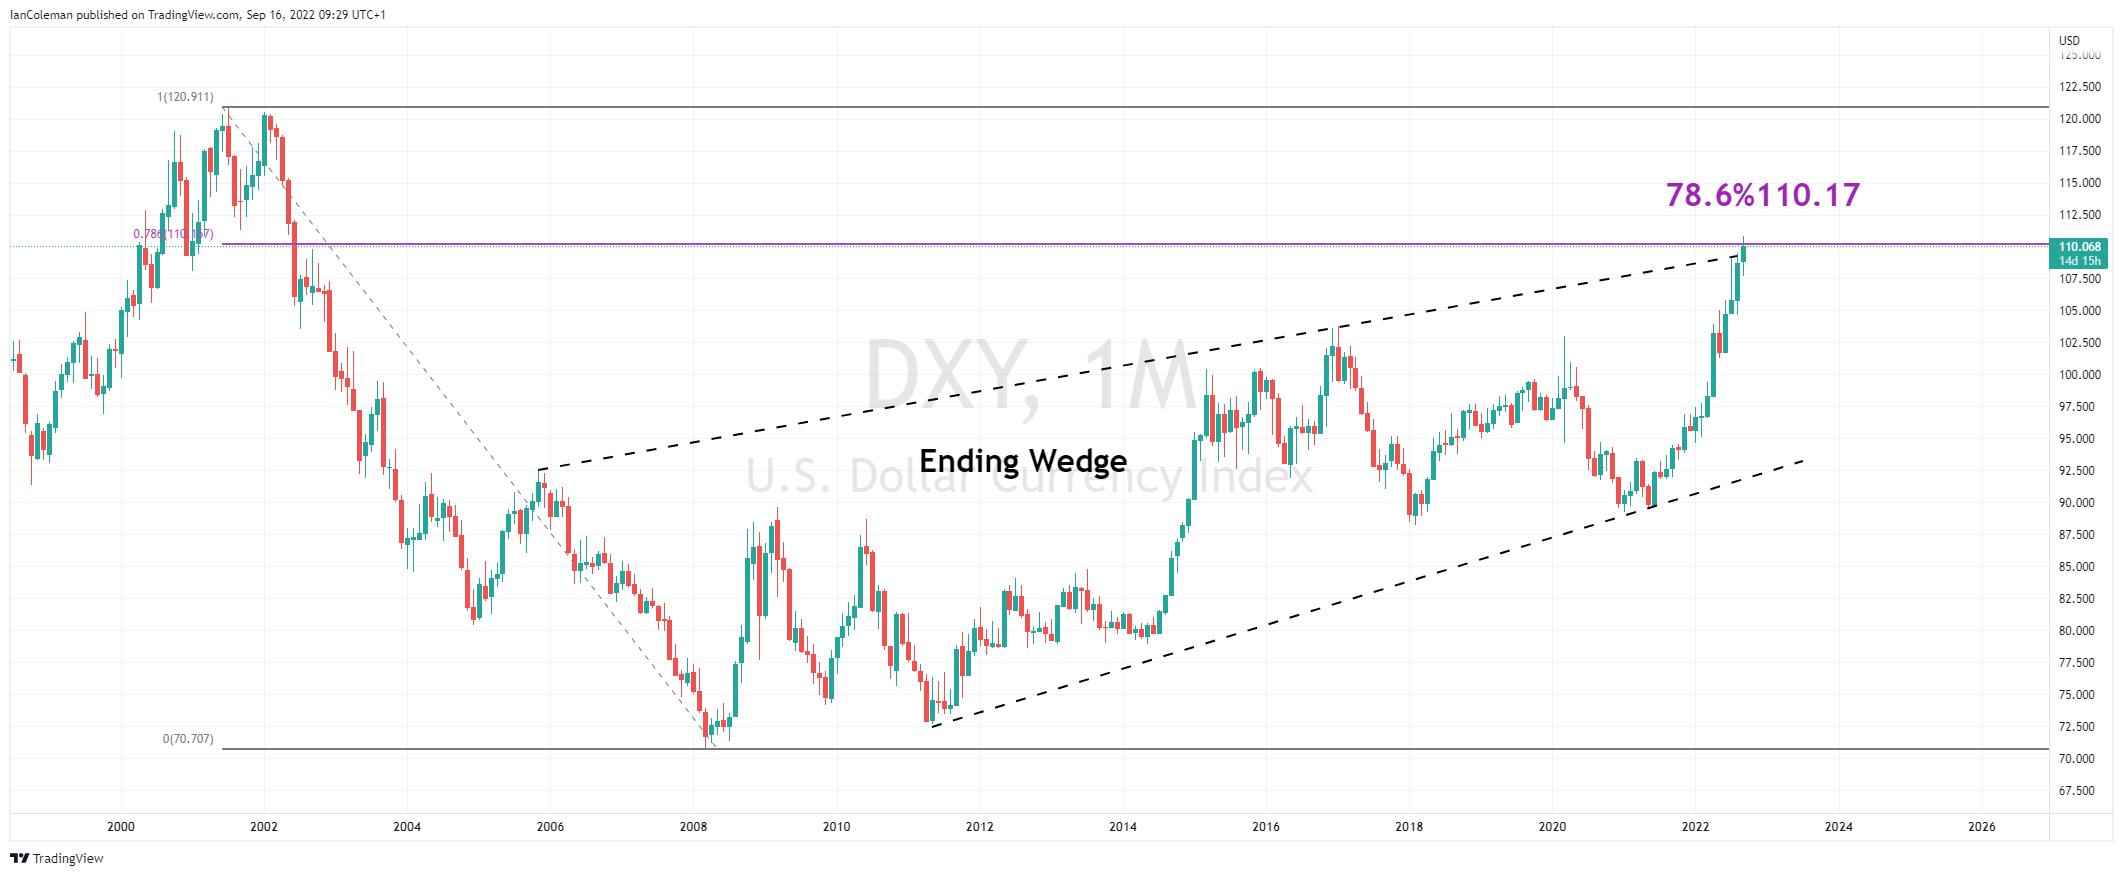
Figure 2 Trading View DXY Ending Wedge
What about Ethereum against the USD?
The weekly chart highlights the completion of a flag formation on the 18th of June at 879.80.
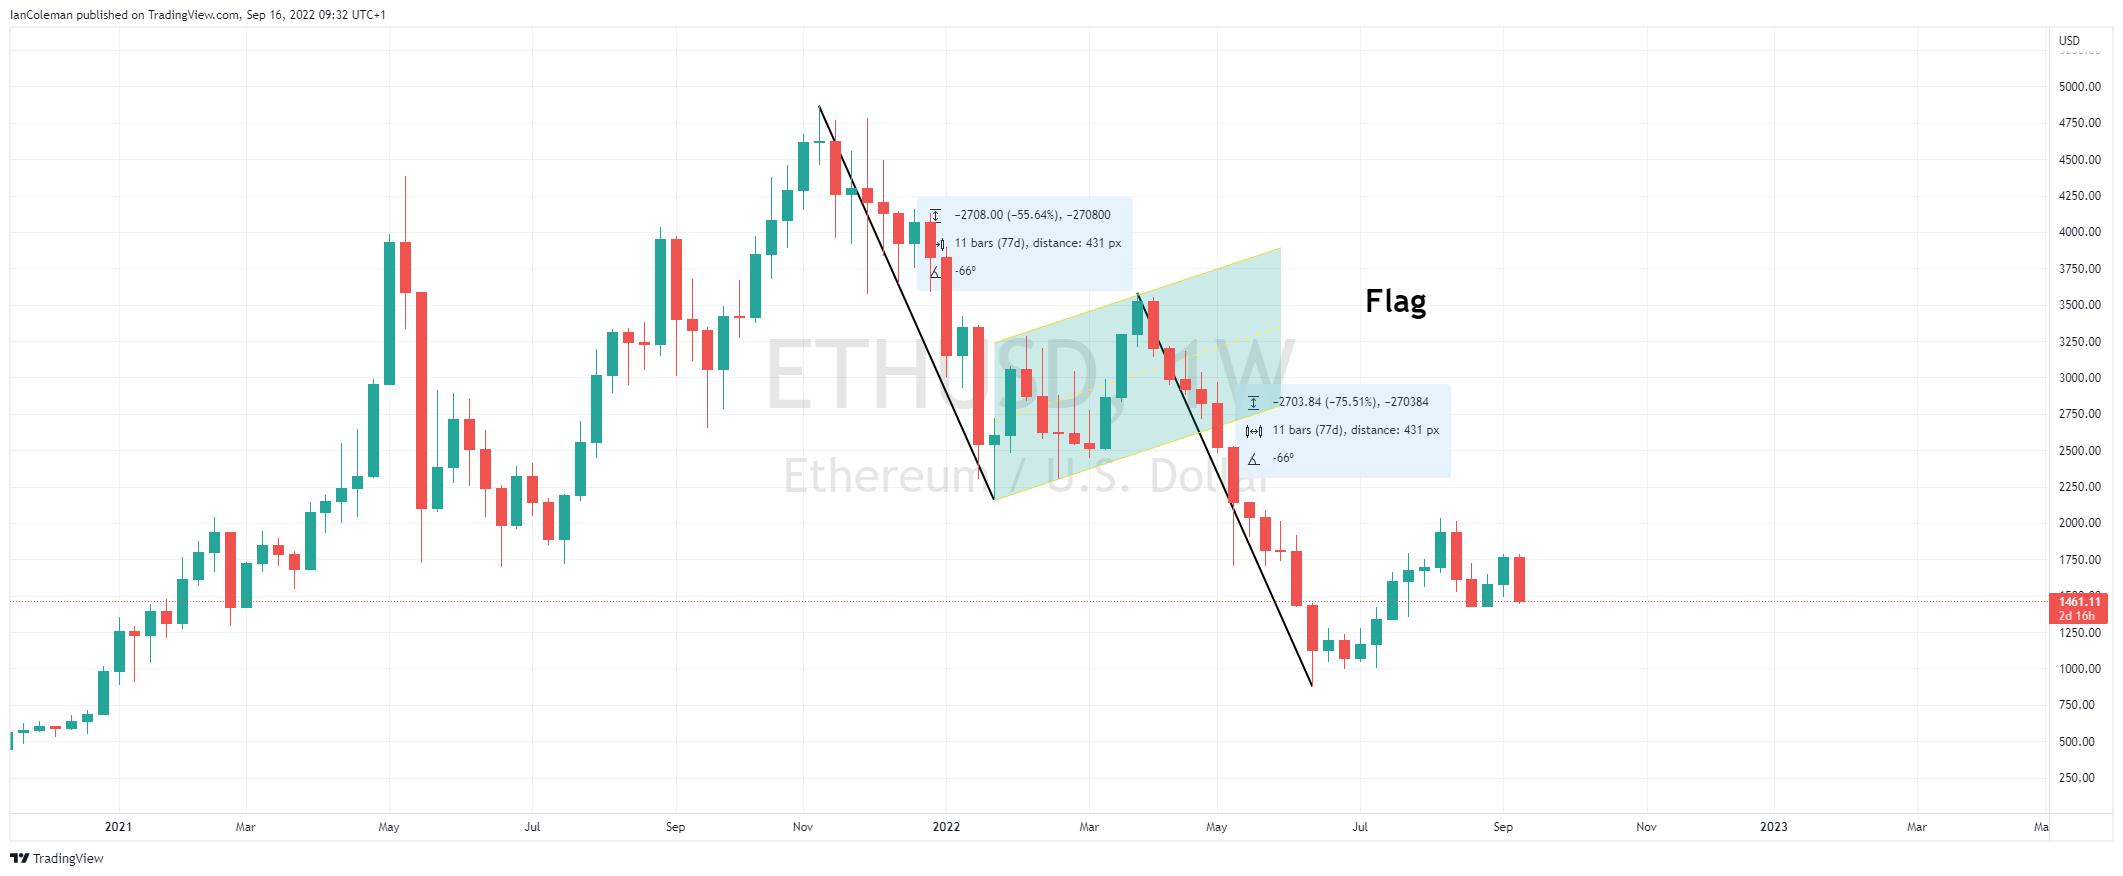
Figure 3 Trading View ETHUSD Flag completes
After yesterday’s selling pressure, the intraday chart highlights the completion of a cypher pattern known as a bullish BAT at 1461.80. Is the correction lower now complete?
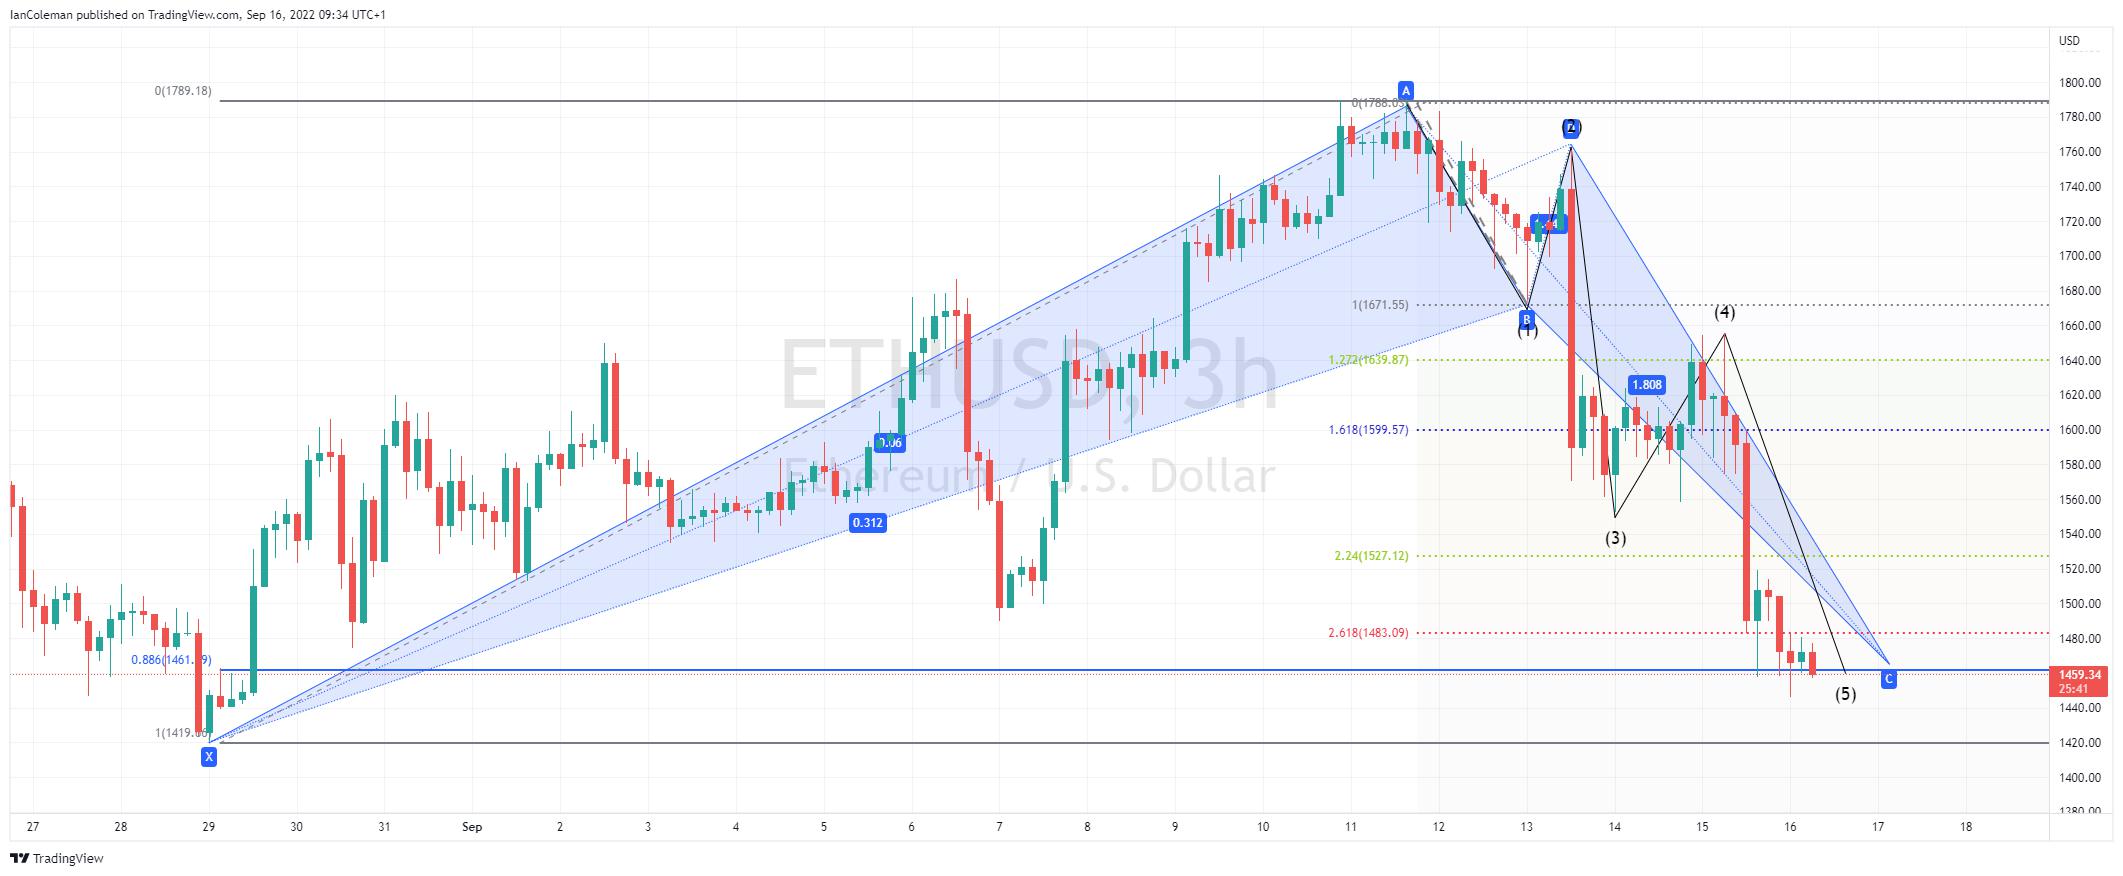
Figure 4 Trading View ETHUSD Bullish Bat formation
Related articles
The material provided here has not been prepared in accordance with legal requirements designed to promote the independence of investment research and as such is considered to be a marketing communication. Whilst it is not subject to any prohibition on dealing ahead of the dissemination of investment research we will not seek to take any advantage before providing it to our clients.
Pepperstone doesn’t represent that the material provided here is accurate, current or complete, and therefore shouldn’t be relied upon as such. The information, whether from a third party or not, isn’t to be considered as a recommendation; or an offer to buy or sell; or the solicitation of an offer to buy or sell any security, financial product or instrument; or to participate in any particular trading strategy. It does not take into account readers’ financial situation or investment objectives. We advise any readers of this content to seek their own advice. Without the approval of Pepperstone, reproduction or redistribution of this information isn’t permitted.

