


We got as high as 3153 in the S&P 500 cash, just shy of filling Monday's gap lower into 3181, although we closed at 3124, but holding the 5-day EMA. Digging below the surface we see cyclicals outperforming defensives sectors, growth has outperformed value and we see solid turnover through both the cash and futures market (2.97m contracts traded).
With that background, I can certainly paint it as a fairly rosy picture. Although, consider S&P 500 futures were up a sizeable 3% just before the S&P 500 cash open (at 11:30am AEST) and we were staring at far more prolific gains. So the bulls just haven’t quite made it count and if we go cross-asset we can paint a somewhat hazy picture on the day.
Asian equity futures are a mixed picture and again we should consider that S&P 500 futures were +1.4% when we closed off yesterday in Japan and Australia, so equity markets were already pricing in an upbeat US session. Hence when we look at Aussie SPI futures, they are up just 0.6%, while we see modest downside in Nikkei 225 and Hang Seng futures. My bias remains that the ASX 200 will reclaim 6000 near-term, perhaps not today, but certainly this week.
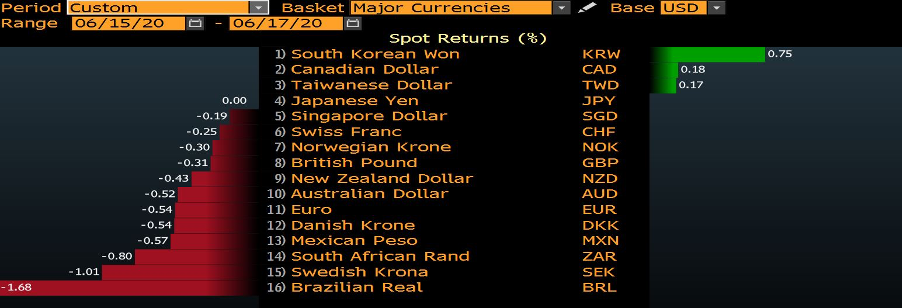
In margin FX markets, we’ve seen some covering of USD shorts and the greenback is up vs nearly all major currencies on the session. Some have labelled this risk aversion, perhaps driven by headlines that China is closing a number of schools, as well as headlines on casualties in the India-China border clashes, all at the backdrop of North Korea blowing up an intra-Korean liaison office.
(Source: Bloomberg)
In reality, I am not sure these headlines really have worried margin FX markets too greatly though. Consider that margin FX implied vol has actually moved on the session in 1-week and 1-month vols, so it’s hard to say this was a sell-off driven by panic – that is untrue.
I would be watching for the BRL to act somewhat independently of broad risk semantics, with the country recording 34,918 new COVID-19 cases in the past 24 hours. I have no exposure, but I wouldn’t rule out upside for USDBRL in the near-term.
We see a slight move lower in equity vol too, with the VIX index settling -0.73 vols at 33.7% - so broadly, there has been no bid in traders making a play in hedging downside risk and anticipating greater movement in the market over a short- to medium-term period. This is true in credit, where credit spreads haven’t really moved on either investment grade or high yield, and there is no doubt equity investors would have liked to have seen real follow-through to see ever tighter spreads to spur further life into the equity move. In fact, LQD ETF (investment grade credit ETF) closed 0.3% lower after hitting a record high of 134.90.
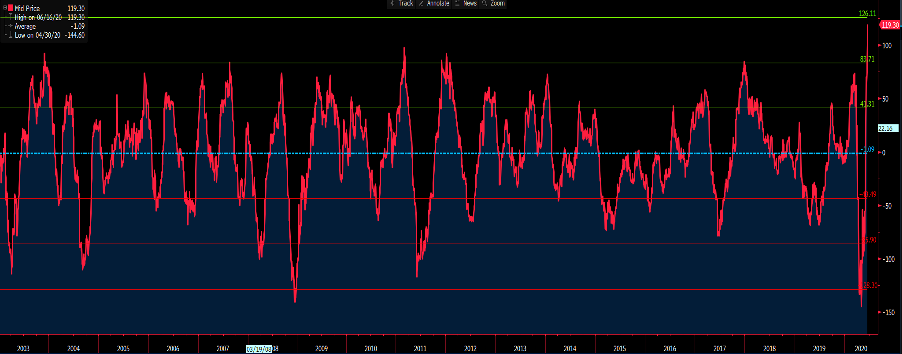
In Treasuries, there has been a slight sell-off in 10s and 30s, resulting in a slightly steeper yield curve. Perhaps this has driven a slight short covering in the USD and in years gone by, I’d argue this with conviction, but times have changed – however, consider May retail sales destroyed expectations with a +17.7% MoM increase (consensus +8.4%MoM). We can look at it on a year-on-year basis and see a decline of -6.1%, however, this is clearly a strong improvement from the -19.9% seen in April and fits nicely with the rebound seen in the US labour market. In fact, if we look at the broad trend in US economic data, we can see the Citigroup economic surprise index at an all-time high – this index effectively goes up when data is beating consensus expectations and vice versa.
(Source: Bloomberg)
The cynics will, of course, say this is because economists have been so poor at forecasting. Perhaps, but the more interesting issue is that the recovery story that equities and credit have been portraying is coming to fruition and the massive disconnect between asset values and the real economy is converging; albeit there is a lot of room to move.
The question then is with global share CFDs at current levels, having priced in a decent element of recovery is what happens now? Do earnings start to matter?
Related articles


做好交易准备了吗?
只需少量入金便可随时开始交易。我们简单的申请流程仅需几分钟便可完成申请。
Pepperstone不保证这里提供的材料准确、最新或完整,因此不应依赖这些信息。这些信息,无论来自第三方与否,不应被视为推荐;或者买卖的要约;或者购买或出售任何证券、金融产品或工具的邀约;或者参与任何特定的交易策略。它不考虑读者的财务状况或投资目标。我们建议阅读此内容的任何读者寻求自己的建议。未经Pepperstone批准,不得转载或重新分发这些信息。