• 首页
  • 合作伙伴
  • 帮助和支持
  • 简体中文
Pepperstone logo
Pepperstone logo
  • 交易方式
    • 交易账户

      根据您的交易策略,选择两种账户类型之一

    • 优质客户

      专属奖励与定制化礼遇,尽享高频交易者尊贵特权

    • Pepperstone 定价

      探索我们的超低点差,以及所有其他可能费用

    • 交易时间
    • 维护
    • 入金和出金
  • 市场
    • 外汇差价合约

      在主要货币对(如 EUR/USD)、次要货币对以及冷门货币对上享受超值报价

    • 商品差价合约

      交易金属、能源及农产品,原油点差低至 2 美分起

    • 股票差价合约

      低佣金股票差价合约

    • ETF 差价合约
    • 指數差價合約
    • 货币指数差价合约
    • 指数差价合约的股息
    • 股票差价合约的股息
    • 差价合约远期
  • 交易平台
    • TradingView

      通过享誉全球的超级图表进行交易,享受极具竞争力的价格

    • MetaTrader 5

      探索我们先进执行技术带来的极致自动化交易体验

    • Pepperstone 平台
    • MetaTrader 4
    • 跟单交易
    • cTrader
    • 交易工具
  • 市场分析
    • 驾驭市场

      获取专家团队带来的最新新闻与分析

    • 每日新闻

      定期掌握关键事件一览

    • 会见分析师

      我们的全球团队,为您的交易赋能

  • 学习
    • 交易指南

      交易指南与教育资料

    • 网络研讨会

      拓展你的知识

  • 关于我们
    • 会见分析师

      Pepperstone源自于让交易体验更优的愿景

    • 公司新闻
    • 公司荣誉
    • 保护在线客户
    • 交易账户

      根据您的交易策略,选择两种账户类型之一

    • 优质客户

      专属奖励与定制化礼遇,尽享高频交易者尊贵特权

    • Pepperstone 定价

      探索我们的超低点差,以及所有其他可能费用

    • 交易时间
    • 维护
    • 入金和出金
    • 外汇差价合约

      在主要货币对(如 EUR/USD)、次要货币对以及冷门货币对上享受超值报价

    • 商品差价合约

      交易金属、能源及农产品,原油点差低至 2 美分起

    • 股票差价合约

      低佣金股票差价合约

    • ETF 差价合约
    • 指數差價合約
    • 货币指数差价合约
    • 指数差价合约的股息
    • 股票差价合约的股息
    • 差价合约远期
    • TradingView

      通过享誉全球的超级图表进行交易,享受极具竞争力的价格

    • MetaTrader 5

      探索我们先进执行技术带来的极致自动化交易体验

    • Pepperstone 平台
    • MetaTrader 4
    • 跟单交易
    • cTrader
    • 交易工具
    • 驾驭市场

      获取专家团队带来的最新新闻与分析

    • 每日新闻

      定期掌握关键事件一览

    • 会见分析师

      我们的全球团队,为您的交易赋能

    • 交易指南

      交易指南与教育资料

    • 网络研讨会

      拓展你的知识

    • 会见分析师

      Pepperstone源自于让交易体验更优的愿景

    • 公司新闻
    • 公司荣誉
    • 保护在线客户
Trading

Why is the stock market down today?

Pepperstone
Pepperstone
Trading Guides
2022年9月8日
Share

More sellers than buyers

Working in the London financial markets, I would hear traders ask, “why is the stock market down today?” Someone would always answer with the same sarcastic statement, “more sellers than buyers!” Although this is not the case, there is an element of truth behind the saying.

A more accurate synopsis is that there has been more ‘selling’ than ‘buying’. The volume of sell trades outweighs the amount of buy trades. The simple theory of supply and demand driving the market lower.

Volume – an important indicator

Volume indicators are an important factor when looking at stock market moves. Often, technical traders will look for confirmation that there are large orders going through the market.

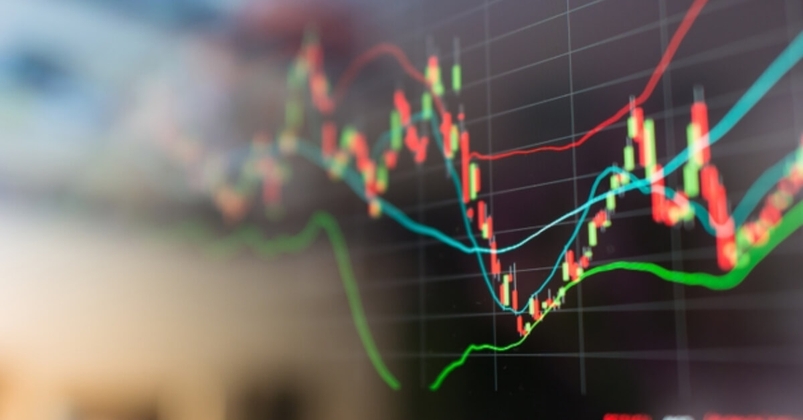
In the chart below we can clearly see the high-volume spikes. The first happened just after the US stock market opened, with the accompanying initial selloff. The second, just before the market closed, pushing the index to the low of the day.

Preview

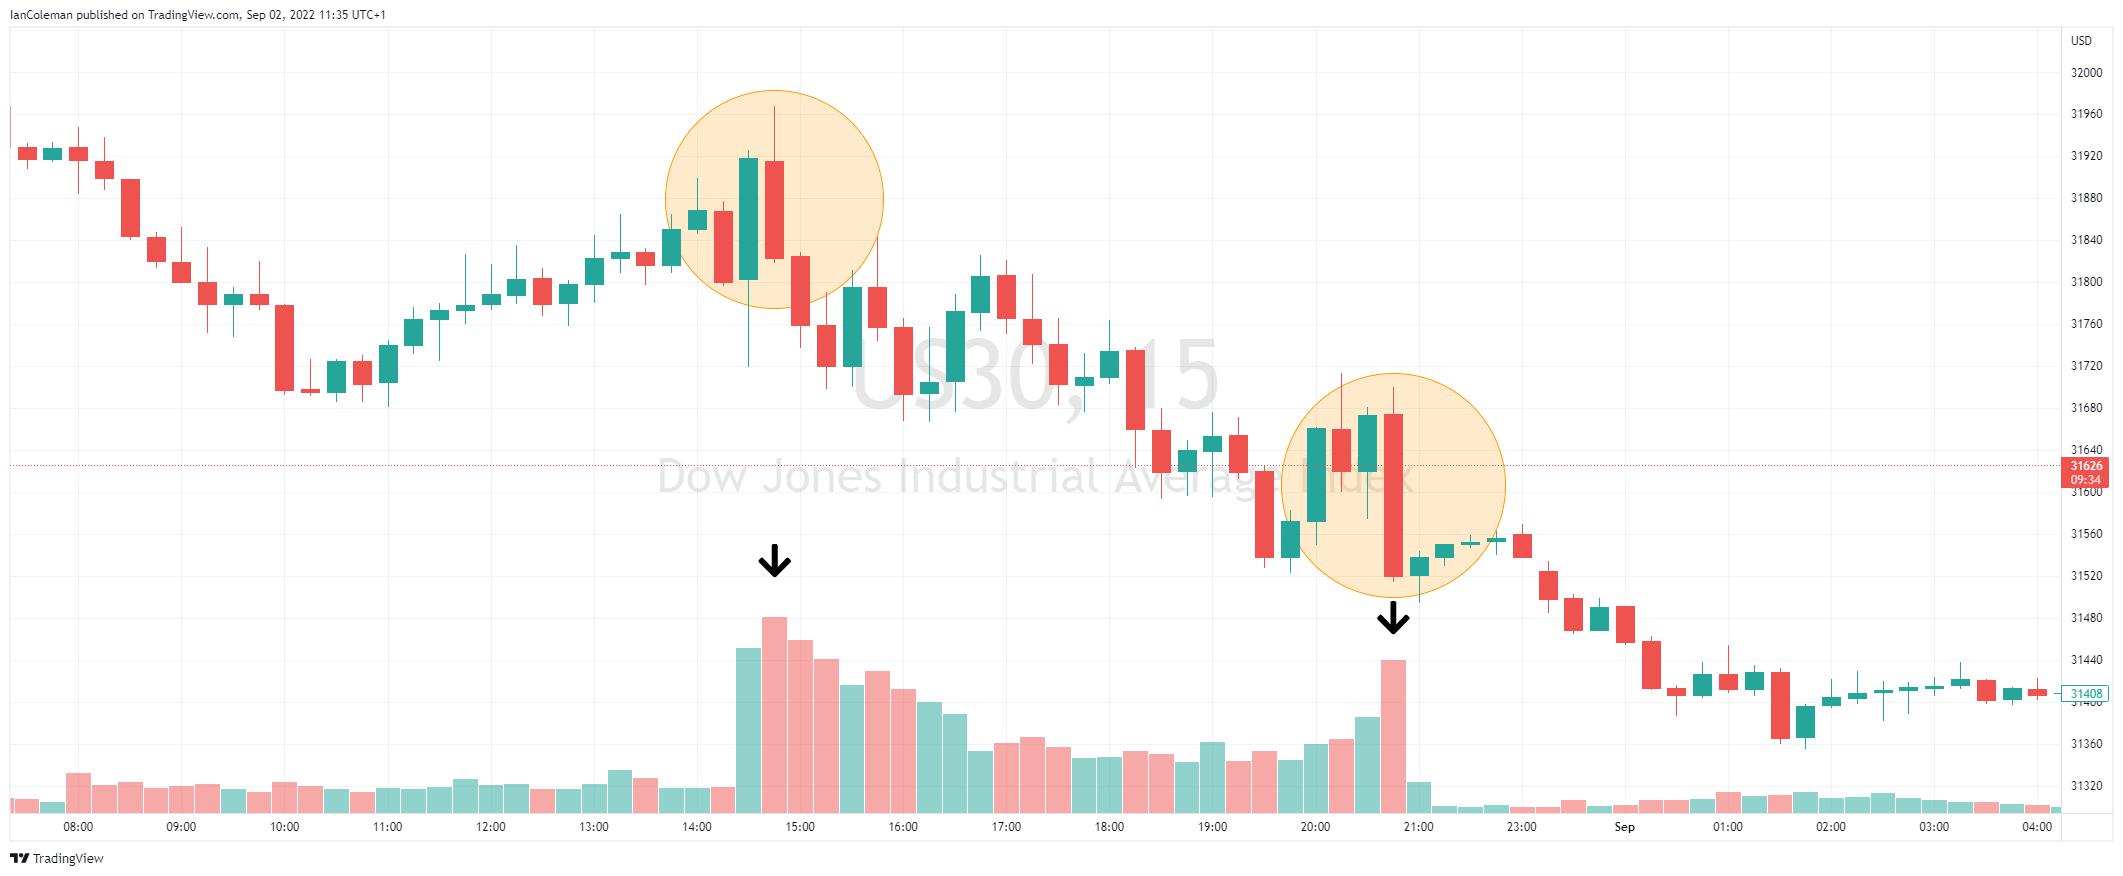
Figure 1 TradingView Volume spikes

Factors that drive the markets

These moves are normally initiated by a fundamental driver. This can be varying elements, like the continuation of an overnight negative sentiment from other world indices. Perhaps figures have highlighted a slowdown in Chinese growth.

Let us look at some of the Key Drivers:

Earning reports

Stock Indices are made up of a basket of companies. The larger the companies Market Cap (Market Capitalization), the more that stocks movements will be reflected in the index.

Apple has a huge Market Cap of 2.538 trillion USD. It makes up over a quarter of the Dow Jones 30 index (10.133 trillion). A large move in Apple will have a knock-on effect to the Dow Jones 30 and other stock indices.

Preview

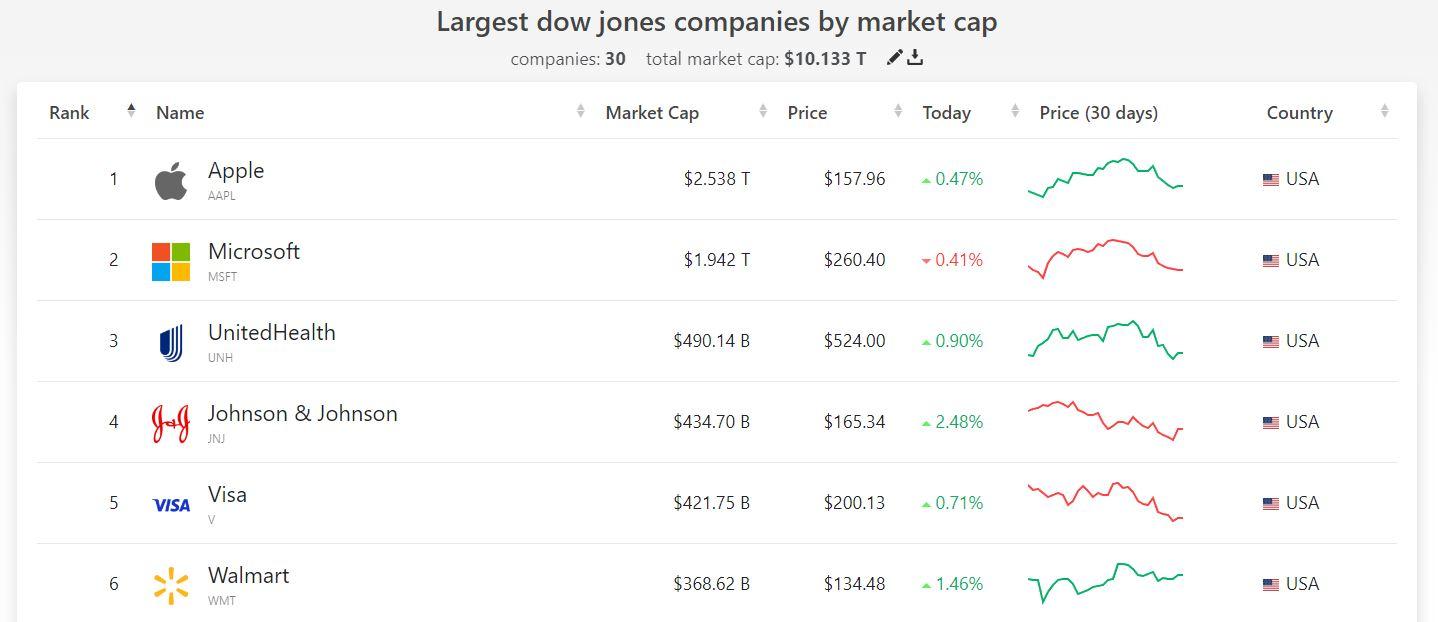
Figure 2 companiesmarketcap.com

Central Bank Speakers – fiscal policy

Central Bank speakers can have a dramatic effect on the price of stocks. Jerome Powell’s speech at Jackson Hole resulted in the Dow Jones 30 (US30) devaluing by 3.51% during the trading session.

Preview

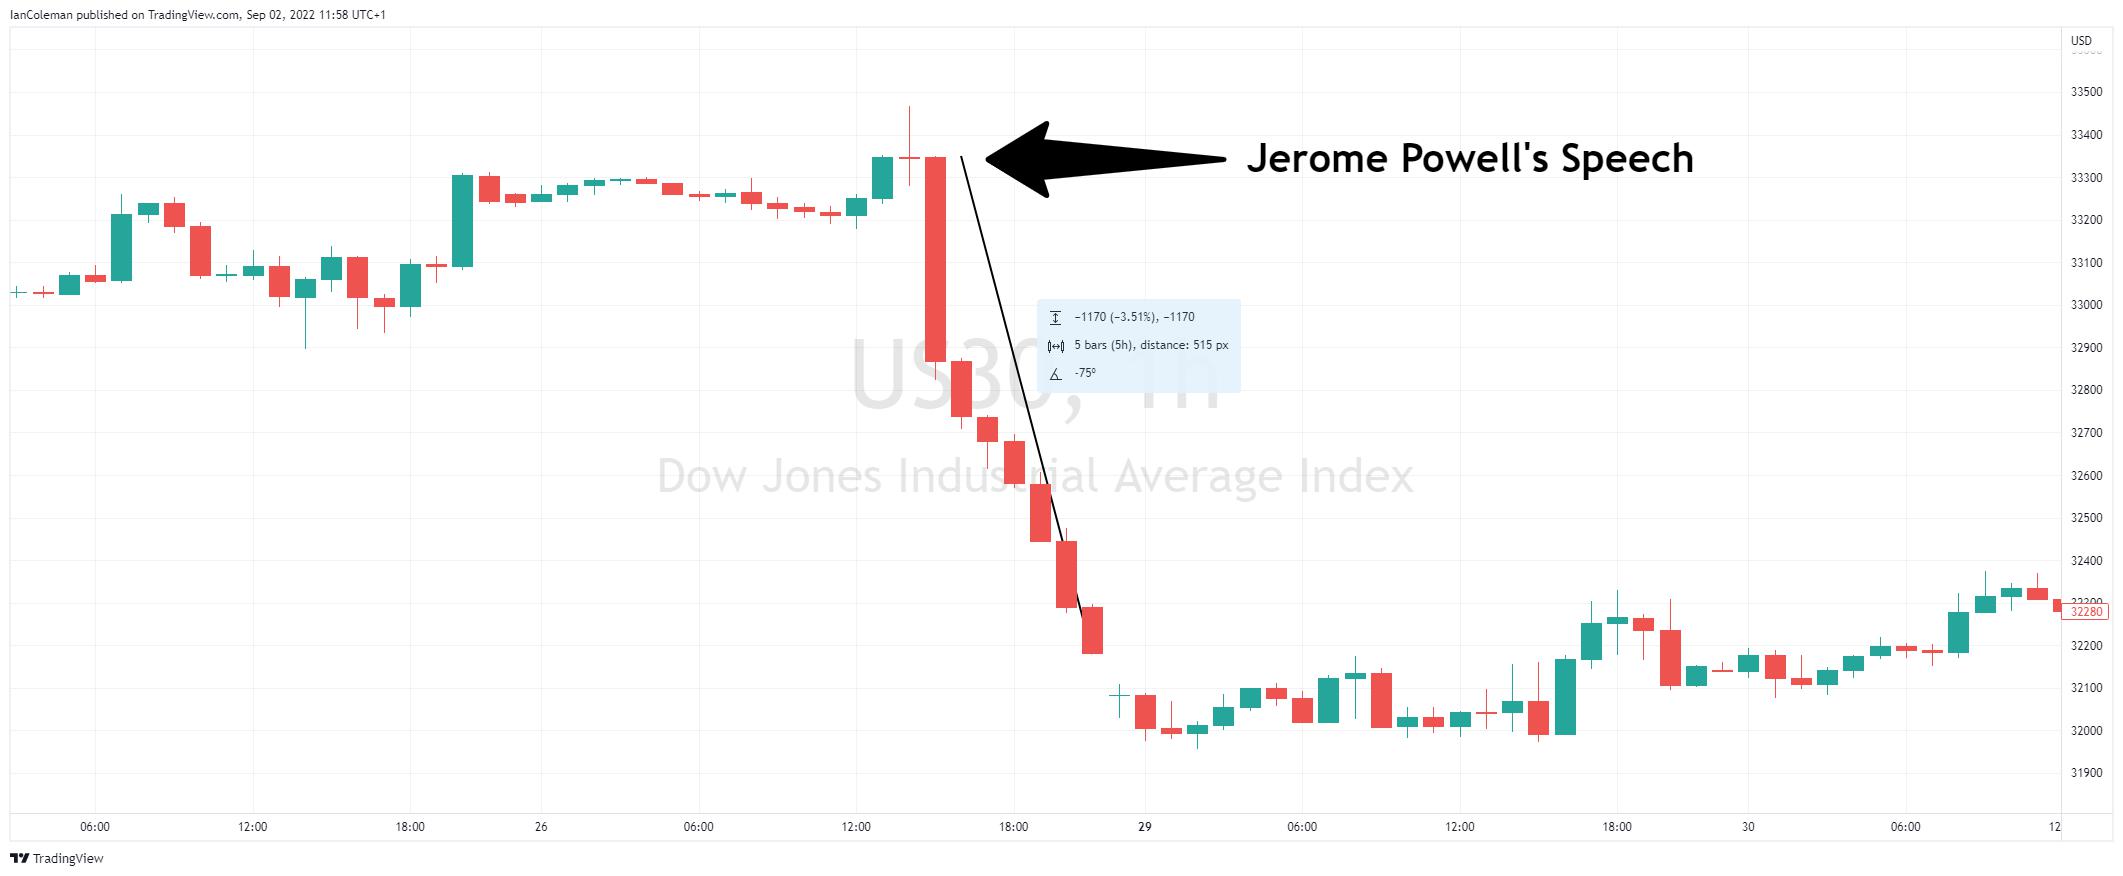
Figure 3 TradingView Jerome Powell’s Speech

Economic Releases

What can make the stock market move down today are economic releases. The most widely watched and anticipated is the N.F.P. This stands for Non-farm payroll. It is the employment figure from the United States.

You should also keep a keen eye on inflation and growth figures such as Consumer Price Index (C.P.I) and Gross Domestic Product (G.D.P).

Preview

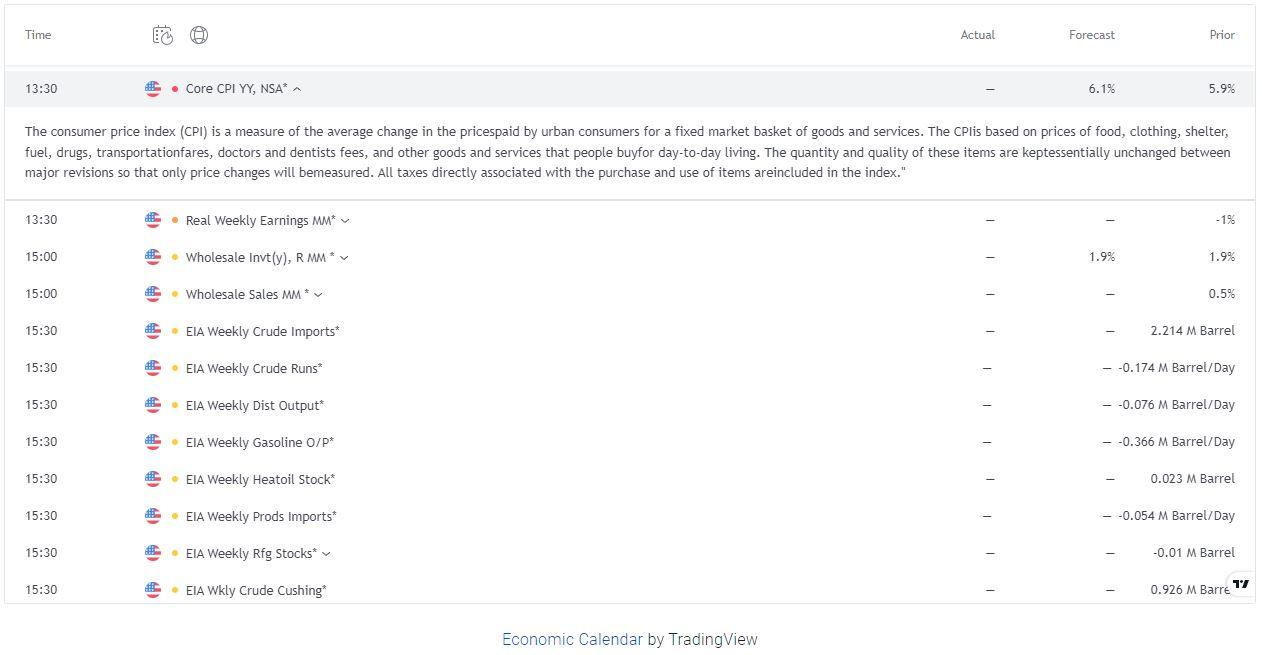
Figure 1 TradingView Economic Calendar

For further information look at the economic calendar at Pepperstone.


Related articles

Using stochastics in your Forex trading strategy

Using stochastics in your Forex trading strategy

Trading
Investing in cryptocurrency during 2022

Investing in cryptocurrency during 2022

Crypto
Trading
这里提供的材料并未根据旨在促进投资研究独立性的法律要求进行准备,因此被视为营销沟通。尽管不受任何关于在投资研究传播之前进行交易的禁令,我们不会在向客户提供信息之前寻求任何利益。

Pepperstone不保证这里提供的材料准确、最新或完整,因此不应依赖这些信息。这些信息,无论来自第三方与否,不应被视为推荐;或者买卖的要约;或者购买或出售任何证券、金融产品或工具的邀约;或者参与任何特定的交易策略。它不考虑读者的财务状况或投资目标。我们建议阅读此内容的任何读者寻求自己的建议。未经Pepperstone批准,不得转载或重新分发这些信息。

其他网站

  • 合作伙伴
  • 集团
  • 加入我们

交易方式

  • 定价
  • 交易账户
  • 高净值客户
  • 交易时间

平台

  • 交易平台
  • 交易工具

市场与符号

  • 外汇
  • 股票
  • 交易所交易基金
  • 指数
  • 大宗商品
  • 货币指数
  • 加密货币
  • 差价合约远期

分析

  • 市场导航
  • 每日简报
  • 会见分析师

学习交易

  • 交易指南
  • 视频
  • 在线讲座
Pepperstone logo
support.cn@pepperstone.com
C/O Credentia International Management Ltd, The Cyberati Lounge, Ground Floor, The Catalyst, Silicon Avenue, 40 Cybercity, 72201 Ebène, Republic of Mauritius.
  • 法律文件
  • 隐私政策
  • 网站条款与条件
  • Cookie政策

风险警告:差价合约是复杂的工具,由于杠杆作用,存在着迅速亏损的高风险。您应该考虑是否了解价差合约的运作方式,以及您是否有能力承担损失资金的高风险。您不拥有标的资产的所有权或权利。过去的表现并不代表未来的表现,并且税法可能会发生变化。本网站上的信息是一般性信息,并未考虑您或您客户的个人目标、财务状况或需求。请在制定任何交易决定之前,阅读我们的《风险披露通知》和其他法律文件。我们鼓励您寻求独立的建议。


Pepperstone Financial Markets Limited 位于 C/O Credentia International Management Ltd, The Cyberati Lounge, Ground Floor, The Catalyst, Silicon Avenue, 40 Cybercity, 72201 Ebene, Republic of Mauritius。 获得毛里求斯金融服务委员会颁发的牌照和并接受其监管。 (牌照号码:GB21026314)  


本网站上的信息和提供的产品和服务并非要推销给任何国家或司法管辖区的任何人,如果此类推销或使用违反当地法律或法规。


©2026 Pepperstone Financial Markets Limited | 公司注册号180497 GBC。