May launches into action with key data and opportunities for traders

Currency recap
April belonged to the USD. This is despite a bout of month-end portfolio rebalancing from pension funds resulting in USD selling, as well as Donald Trump’s best efforts to influence the Federal Reserve’s (Fed’s) psyche. Most notably here, USDCHF rallied 2.4% in April, and into the highest levels since 2017. The break of the recent double-top at 1.0160 was certainly not missed by clients and our flow ramped up on this pair, where there are clear expectations of a re-test of the former breakout, so this is one to watch.
The SEK also heavily-traded through April. This comes after the Swedish central bank removed its tightening bias and rolled out an 18-month bond-buying program. Sweden has its domestic issues, but being leveraged to the European business cycle is not helpful and the SEK has been a solid alternative for those wanting to express a bearish Europe thematic. NOKSEK looks interesting, with the pair working in a bullish channel, and with price hugging the 5-day EMA (exponential moving average) it feels like this goes higher. SEKJPY should also be high on the watch-list, where a close through 11.662 would raise the prospect of a momentum sell.
The Riksbank aside, we also saw a dovish shift in communication from the ECB, RBNZ, BoJ, and Bank of Canada while interest rate traders were still pricing in nearly a full rate cut from the Fed over the coming six months. If you want growth, just look to the US economy: it’s suffered far less than other G10 FX countries, and along with tighter USD liquidity, this dynamic has promoted a stronger USD.
It’s all eyes on inflation in the US though. Should we see further gains in the USD against a backdrop where the rest of G10 FX countries fail to show stability in their growth metrics, then we shouldn’t discount that it could be the USD that forces the Fed’s hand to ease rates, as the currency impacts the Fed’s inflation outlook.
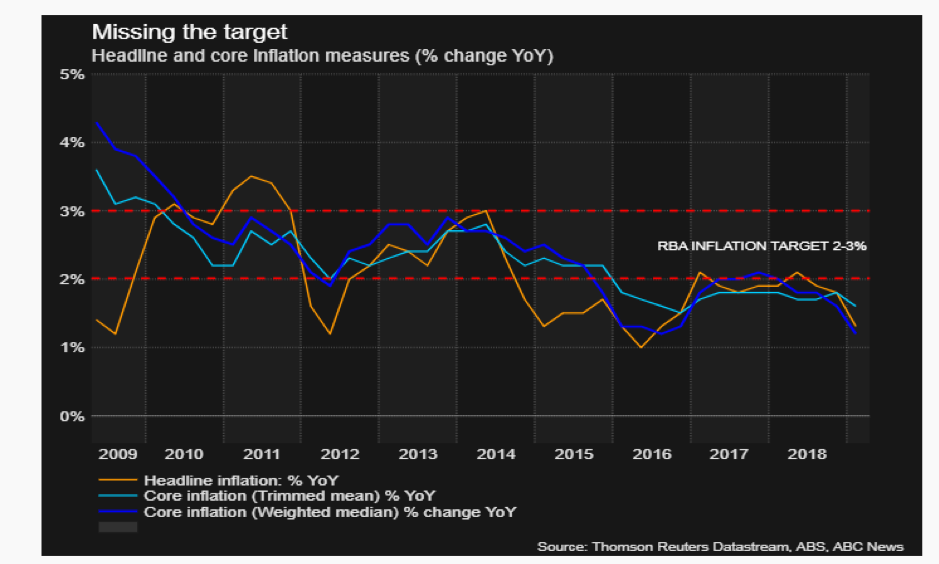
Here in Australia, inflation continues to pull away from the RBA’s 2-3% target band, with a poor Q1 CPI read seen on the 24th of April, which took the AUDUSD into 0.6988 before stabilising back above the figure. The door is now firmly ajar for easing, with interest rate markets positioned for two cuts in the coming 12 months. The debate on the trading floors has moved from ‘if’ they ease, to which exact month the bank will pull the trigger and cut. My personal view is that they’ll do this in August.
April nonfarm payrolls
US Nonfarm PayrollsUS Unemployment RateForecast: 180,000Forecast: 3.80%Previous: 196,000Previous: 3.80%
The April unemployment situation report falls early in May, and because of that, it could well set the tone for investor sentiment during the rest of the month.
You may recall that the March data saw a return to significant month-on-month job creation, after February's low ball print of just 20,000 new jobs. The March figures, which beat consensus forecasts by some +16,000 new jobs, suggested that the US economy was still growing and that despite some indications to the contrary, the US labour market remained very tight.
Weekly initial jobless claims during April seem to confirm that with the report on the 18th of the month printing at its lowest level since early September 1969. What’s more, the 193,000 initial claims figure posted in mid-April was almost 50% below the long term weekly average of 352,000 unemployment claims. I note though that final reading in the month bounced back to 230,000 claims.
Breaking down the US jobs market
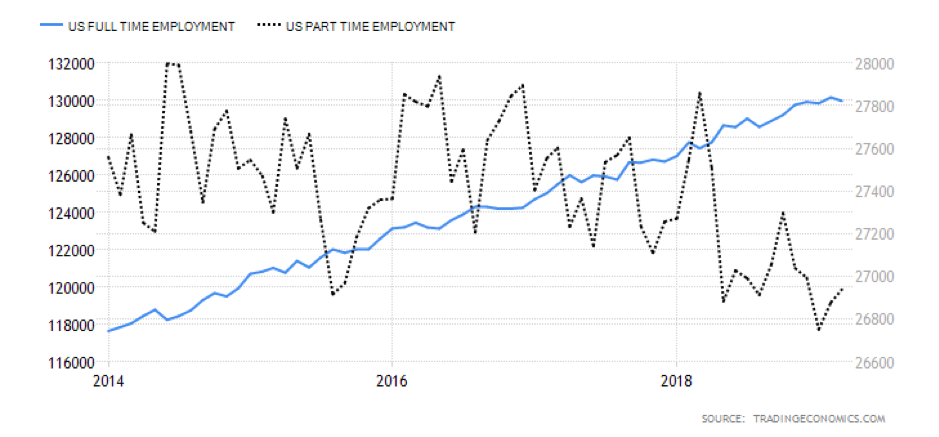
It's interesting to consider the types of new jobs that are created in the USA. Let’s look at the full and part-time employment data, which can be seen in the chart below.
Part-time employment had been falling sharply throughout 2018 as workers moved into full-time roles. We have since started to see the number of new part-time jobs pick up once more, perhaps because employers have to be more flexible in securing a qualified candidate for their open vacancies.
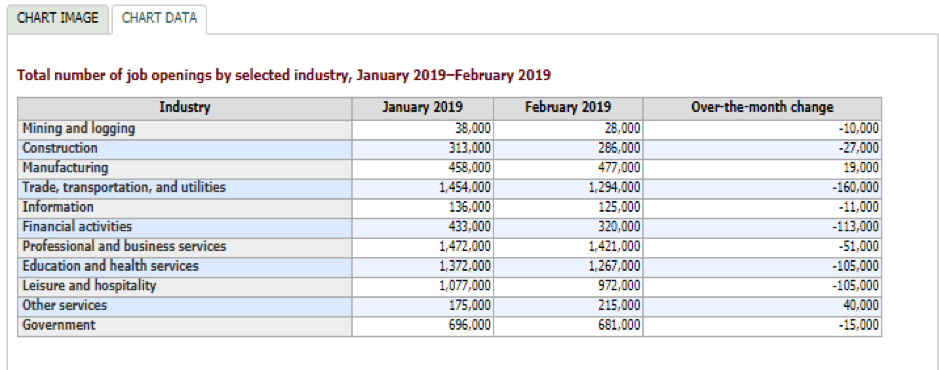
The table below sourced via the US Bureau of Labor Statistics provides a sector breakdown of US job openings in both January and February of this year. There have been some significant reductions in vacancies month-on-month, including a decrease of 160,000 job openings in the trade, transportation, and utilities sector. There remain four groups in this table that have a million or more outstanding vacancies.
Another type of employment headache
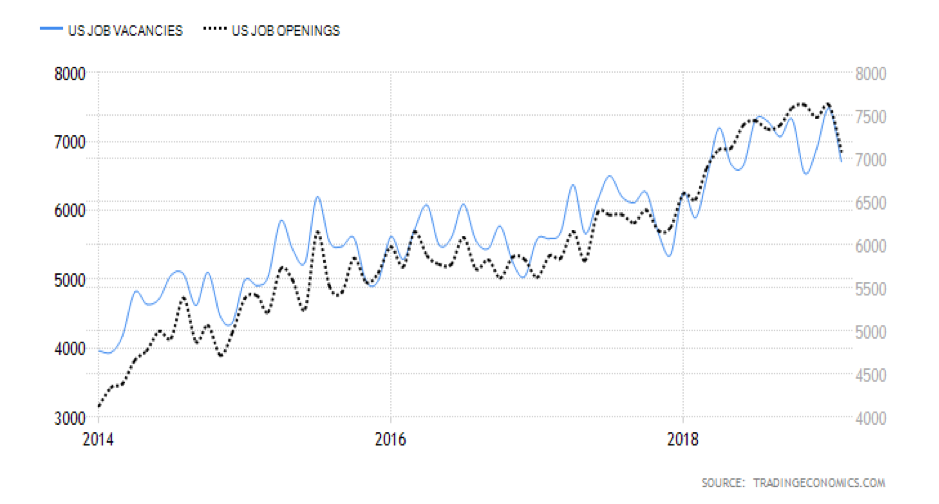
Job vacancies and job offers data have both peaked over the last year or so. Part of that will be because so many jobs have been created and filled in the last 18 months.
Nevertheless, the level of unfilled vacancies (a frankly stunning 6.70mn roles) is something of a headache for the US economy and those that manage it, because it speaks to a skills gap or mismatch in the labour market and one that can't easily be remedied over either the short or medium term, particularly under an administration that has such trenchant views around immigration.
What to expect
The consensus forecast is for new job creation of 180,000 and an unemployment rate of 3.80%.
Average weekly wages have been ticking higher but not as much as we might expect, given the fierce competition for skilled workers outlined above. If we look at longer-term wage growth rates in the USA, they have been falling since October 2018.
Overall, stronger job creation and lower unemployment data would bring more pressure to bear on the Fed to justify its dovish stance on rates beyond the summer months.
If the market senses that a rate rise in 2019 is back on the cards, this would be bullish for the dollar, however less so for US stocks, which have benefitted from the pause in the tightening cycle.
Thinking about it logically the Fed would probably like to have an opportunity to raise rates a couple of times more before it has to consider cutting them again, in any significant downturn.
One payrolls report won't change the central bank policy of course, but it could provide some additional confidence to do so later on in the year. Particularly if it follows on in the same vein as the bumper print in US Q1 2019 GDP seen in late April.
RBA Interest rate decision
7th of May 04:30 GMT (server time 07:30 GMT+3)
The Reserve Bank of Australia is back in focus once more as it meets to decide on the level of interest rates for the country. Minutes from the bank’s March meeting set out circumstances under which it would consider a cut: falling inflation and rising unemployment. Since those minutes were released on the 15th of April, this is precisely what we’ve seen.
Unemployment has been the bright spot in the Australian economy. The chart and table below, sourced from the Australian parliament’s March statistical update, shows the upward trend in employment, both in absolute terms and as a percentage of the country’s population.
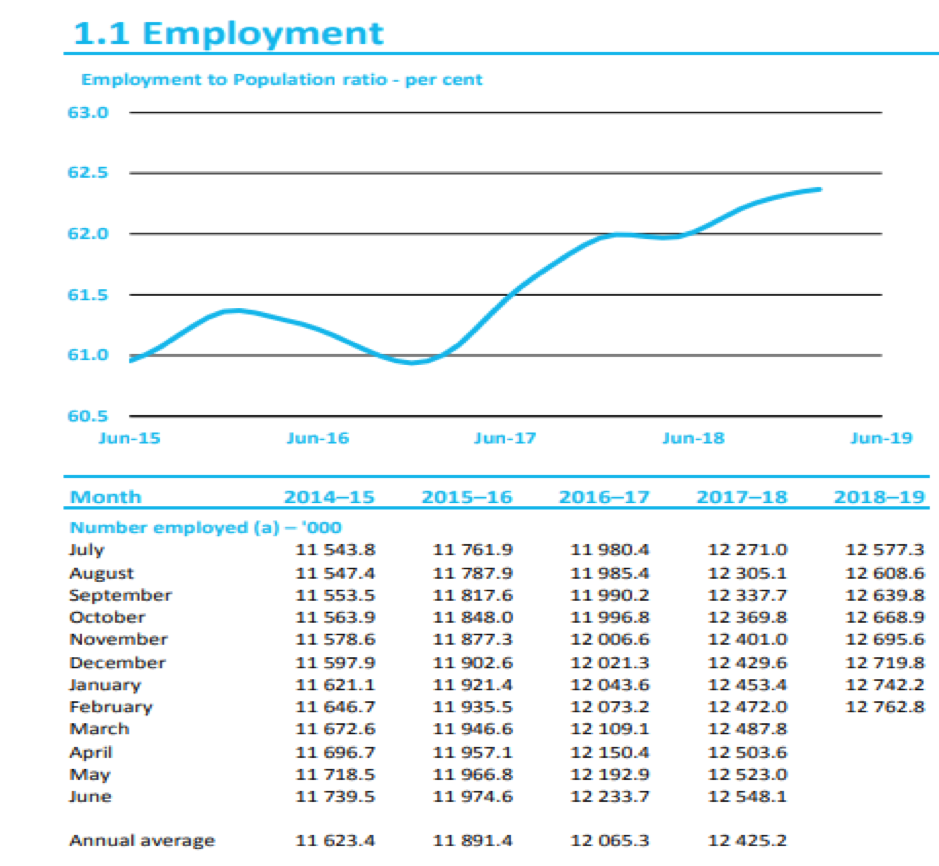
The unemployment rate for March ticked up by +0.10% to 5.0% from February's reading of 4.9%. Now, of course, this may be a purely statistical anomaly which will work itself out in later reads. Although I note that job advertisements have been falling in Australia since the turn of the year, coincidently the latest job ad data will be released just one day before the RBA decision is announced.
What isn't up for debate is the direction that inflation is travelling in Australia: downward. Figures for the first quarter of 2019 showed that annualised inflation had fallen to +1.30%, versus the forecast of +1.50%, and the Q4 2018 reading of +1.80%. This was the lowest level for that metric since Q3 2016.
However, some measures of core inflation were at their lowest levels for almost 16 years.
As we can see below, both broad-based and narrow measures of Australian inflation look to have decoupled from the RBA's target band of 2.0% to 3.0%.
That leaves the RBA with some thinking to do
Let’s be clear that the domestic economy isn't teetering on the brink. In fact, it’s far from it.
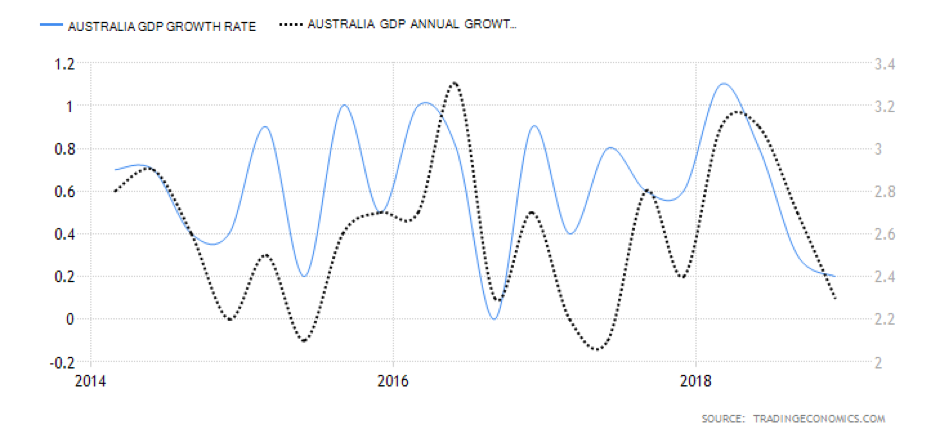
Annualised GDP in the country was running at +2.3% as of Q4 2018, though it must be said that the trend in both the yearly and monthly data is currently downward.
Australia hasn't endured a recession for almost three decades and any incoming administration, after the general election on the 18th of May, will surely not wish to see that trend broken on their watch.
What to expect
It seems unlikely to me that the RBA will cut interest at this meeting due to its proximity to the elections. However, it might indicate the time scale over which it would be happy to make one.
The Aussie dollar was under intense pressure, versus its US counterpart, at the end of April as the weak inflation data attracted plenty of sellers.
At the time of writing, support at the round number of 0.70 was holding firm. If the RBA reveals a rate cut is around the corner, this can't be relied upon, and the 2016 low circa 0.6838 would then be a target for the bears to aim for. If the bank walks back from an immediate rate cut, then a more significant relief rally should not be ruled out.
Australian elections: the 18th of May 2019
Australian politics has had something of a bad rep over the last year, and the upcoming election could be an opportunity for those in Canberra to put that behind them. But life in politics is rarely that simple. Current Prime Minister Scott Morrison has been in power for less than a year, following a leadership contest that ousted Malcolm Turnbull in August 2018.
PM Morrison was seen as a compromise candidate and has not enjoyed the best relationship with his party and the voting public. He lags behind Labor leader Bill Shorten in the polls.
Economic record
Mr Morrison has tried to portray his labor opponent as someone who would be a poor custodian of the Australian economy. However, the local economy has been slowing under liberal party stewardship, who have been unwilling or unable to offer much in the way of fiscal stimulus to the economy. They’ve preferred instead to leave the RBA in charge of managing and stabilising the economy.
The Labor party, led by Mr Shorten, who were recently praised for their management of the Australian economy during the global financial crisis (GFC) and following recession, have enjoyed a comfortable lead in opinion polls. This gap is narrowing as we move closer to the election proper.
What to expect
I think the markets would prefer a clear victory for the liberals but would expect this accompanied by affirmative action on the economy above the offer of tax cuts for urban voters. Despite labor’s reputation of managing the economy in turbulent times, they are seen as a party that might spend money and raise taxes, particularly around issues such as carbon emissions and the environment.
Leading economists have more recently called for the Canberra government to take advantage of low borrowing costs to raise debt and use proceeds to stimulate domestic growth, suggesting that markets could warm to a tax/borrow and spend policy if they felt investment and spending were targeted towards the right areas.
That said, the ASX200 index has rallied by +12.0% year-to-date and I am forced to wonder if it could be better to travel than arrive as far as the elections are concerned for the index, which could pull back to 6200/6180 and even 6120 in the short to medium term.
German manufacturing PMI
23rd of May 07.30 GMT (Server Time 10.30 GMT+3)
German manufacturing has been under intense pressure during 2019. In fact, the downturn in such a prestigious sector has taken the market's breath away. Just consider this chart that shows the sectors PMI readings over the last year, and you can see why.
The print of 44.1 seen in March was an almost seven-year low. Indeed in recent times, the indicator had only been lower during the GFC.
German Manufacturing PMI
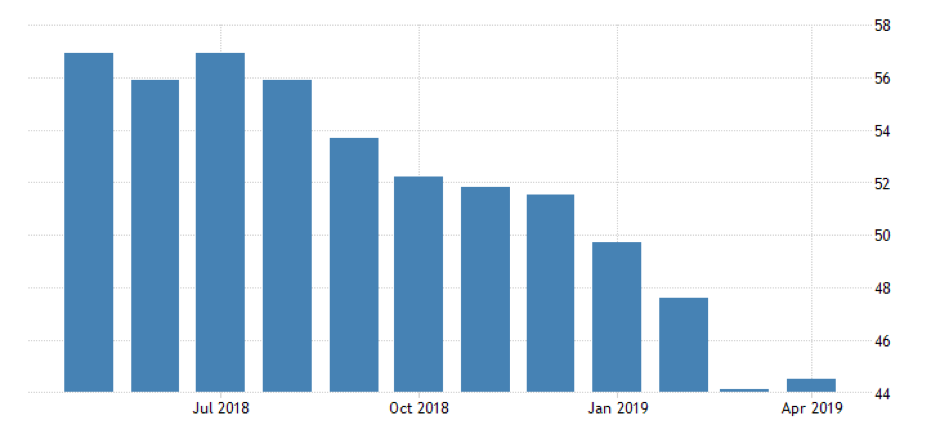
Remember that PMI readings above 50 indicate growth in economic activity; while those below signal a contraction. In the case of German manufacturing in 2019 to date, it's as if someone or something turned off the tap. Yes, there was a modest pickup in activity between March and April, but it was marginal, to say the least.
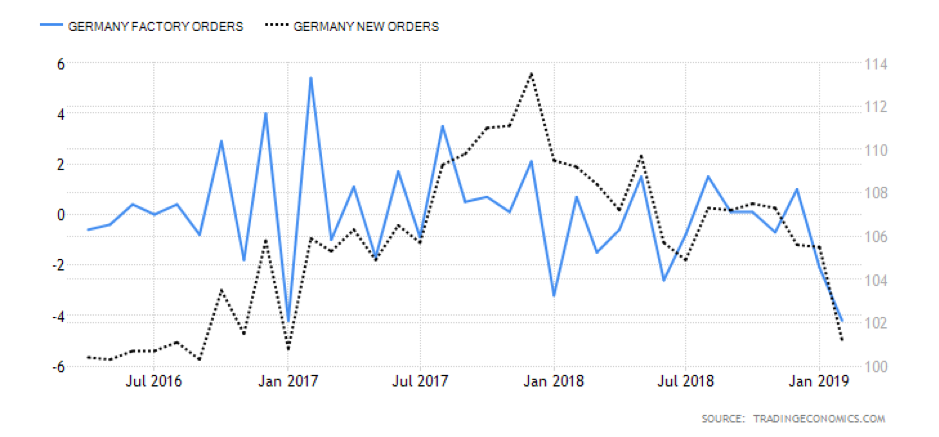
If we dig deeper into the data, we find that the new orders component of the manufacturing PMI continued to decline in April. The chart below plots two critical measures of new business for German industry: factory orders and new orders. Both have been declining since summer 2018.
Help may be at hand in the form of better-than-anticipated Eurozone Q1 GDP data reported at the end of April, giving weight to Mario Draghi's belief that the Eurozone is an economic dip rather than a slump. Added to which, the number of unemployed people in Germany fell by 12,000 in April. This suggested an economic pick-up, although the official unemployment rate for April remained unchanged at 4.9%.
What to expect
Given that hard data in the Eurozone, such as GDP and unemployment, has been more robust than so-called soft survey-based data, it's quite difficult to call which way the PMI data will fall this month. We can look for clues elsewhere. German business confidence measured by the IFO institute dipped again in April after a brief uptick in March. Sentiment amongst manufacturers in Germany was one of the largest decliners.
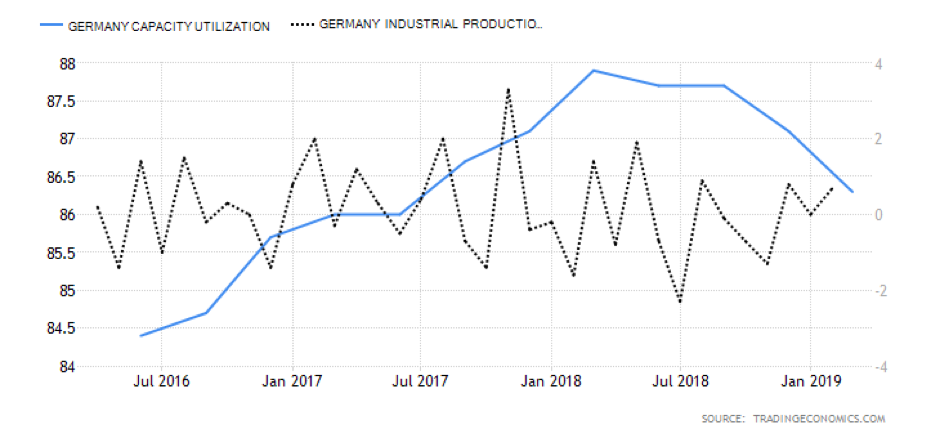
While predictions about capacity utilisation in German industry have continued to decline into Q2 2019, the lagging industrial production indicator has been picking up.
Overall I think we can say the market is priced to receive the bad news that manufacturing is not the most significant part of the economy and it's the service sector that really drives sentiment among traders and price makers. That said, if we do see a print that is significantly higher than April's 44.50, that could provide an additional bullish catalyst.
Particularly if the Q1 2019 GDP and service sector PMIs, which are also released on the morning of the 23rd of May, are positive as well. The Euro rallied on the upbeat numbers from the Eurozone in late April and could well do so again if the German data follows suit.
Political opportunities
AUDUSD implied volatility for 20 May sits at 8.07%, which to put into perspective suggests the market expects a move (up or down) in AUDUSD of 107-points by the election. This is hardly fireworks given politics usually creates such outsized reactions in markets. Market participants feel comfortable with Labor getting the necessary 76-seats (of a possible 151) to achieve a majority in the House, with polls having had them ahead on a two-party preferred basis for some time. Historically, Australian elections fail to promote a significant reaction in Aussie assets. Most of the lead into the election has been dominated by macro issues, specifically weak domestic price pressures.
The idea that Labor will fail to achieve the 39-seat majority needed to take control in the Senate is realistic, and as such, Labor would need to garner support from more moderate independents. Markets therefore understand that a number of Labor’s keynote policies will not pass the Senate in their proposed form, and will need to be scaled back. Either way, it seems a Labor government will not cause an immediate disinflationary shock that moves the AUD or ASX 200 too significantly.
GBP has started to find buyers, largely overlooking further Brexit uncertainty and we see GBPUSD breaking above the March downtrend and eyeing a move into 1.3130. GBPAUD also looks interesting as both currencies have political risk, and we see spot continuing to work in a long-term channel. A close through 1.8770 would be a big development. With UK local elections in play ahead of European Parliament elections in late May, which the UK will likely take part in, a poor showing from the Tory party could hold significant ramifications in the political landscape.
We know Theresa May is due to appear at an Emergency General Meeting in June. Depending on how these two elections go for the party, we could see real pressure from Tory senior ranks and calls for May to step down. One suspects that should May step down, it would be closer to July. It’s likely a Brexiteer such as Boris Johnson would fill the position. Given this replacement would potentially fall in August or September, it would leave little time to form a deal by the October 31 deadline. It feels as though Theresa May’s days are numbered, while the prospect of a further Brexit deadline extension into 2020 is elevated. GBP uncertainty is not going away.
The material provided here has not been prepared in accordance with legal requirements designed to promote the independence of investment research and as such is considered to be a marketing communication. Whilst it is not subject to any prohibition on dealing ahead of the dissemination of investment research we will not seek to take any advantage before providing it to our clients.
Pepperstone doesn’t represent that the material provided here is accurate, current or complete, and therefore shouldn’t be relied upon as such. The information, whether from a third party or not, isn’t to be considered as a recommendation; or an offer to buy or sell; or the solicitation of an offer to buy or sell any security, financial product or instrument; or to participate in any particular trading strategy. It does not take into account readers’ financial situation or investment objectives. We advise any readers of this content to seek their own advice. Without the approval of Pepperstone, reproduction or redistribution of this information isn’t permitted.