- English
- 简体中文
- 繁体中文
- ไทย
- Tiếng Việt
- Español
- Português
- لغة عربية
- English
- 简体中文
- 繁体中文
- ไทย
- Tiếng Việt
- Español
- Português
- لغة عربية
.jpg?height=93&quality=100)
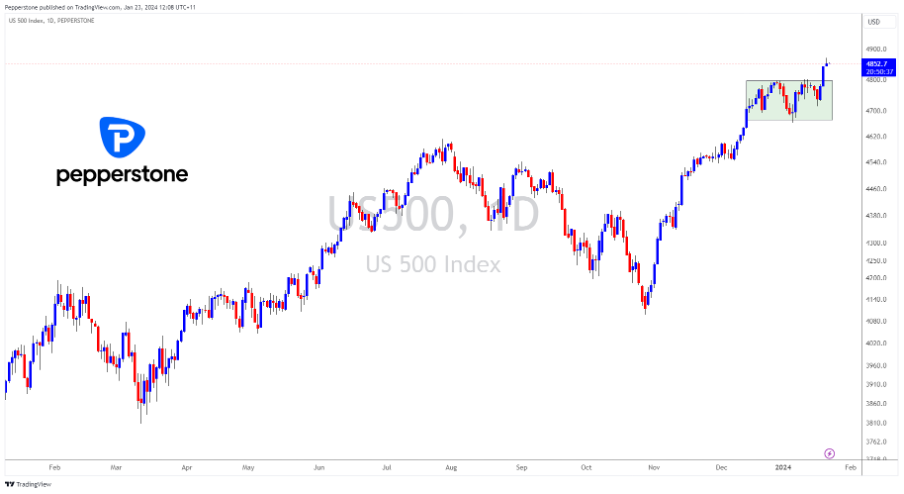
The breakout takes the rally from the lows in October to 18%, and with this new peak, momentum suggests a heightened probability the index is entering a new technical bull market.
The NAS100 also closed above 17300 last Friday, a 2% increase, setting a new record for the index.
“Magnificent Seven” and AI are contributing
This price surge was primarily driven by the "Magnificent Seven" tech stocks. These seven giants averaged a 75% increase in 2023, accounting for 30% of the total market cap of the US500 and 50% of the NAS100 at the end of last year.
In 2024, the market continues to speculate on the same forces that drove U.S. stocks higher last year, buoyed by confidence in the continuing AI boom and cost-cutting measures by these companies. Notably, Nvidia's share price has risen over 20% since the start of the year, and AMD, despite a slight retreat yesterday, has seen an impressive 14% increase since the beginning of the year. Last week, Meta's CEO Zuckerberg also announced ambitious goals to aggressively venture into AI, including possessing 350,000 Nvidia H100 cards by the end of the year, undoubtedly making tech stocks and the AI theme the “heroes” behind this historical record refresh.
Up or down: What’s the next move?
Standing at new historic highs, the biggest question is whether the US500 and NAS100 can continue their stellar performance, or if it's time to take profits.
First, we should be wary of the risks of over-concentration of returns and overvaluation. While valuation has mattered little for some time, it’s still worth considering that the US500 trades on a forward P/E ratio of 20x, however, if one is to exclude the "Magnificent Seven" stocks, the valuation drops to around 16. So essentially, it's big Tech that is driving the overvaluation, but regardless investors are happy to pay up for the quality of their cashflows.
With these tech giants contributing over 60% to its gain last year, any movement could significantly impact the US equity market.
Furthermore, whether the U.S. economy can achieve the ‘soft landing’ widely expected by the market is another key driver for the continued rise of these indices.
Last week's US economic data was generally better than expected, where notably U.S. (December) retail sales showed a significant upward deviation, and initial and continuing jobless claims also fell.
Since the Fed's last rate hike, signs of cooling in the labour and inflation data have been apparent, yet the growth remains robust. Additionally, the Michigan Consumer Sentiment Index released on Friday reached its highest since July 2021, indicating positive market sentiment.
I believe the current setup is favourable for a soft landing, but the market is widely discounting this scenario. We also see that the market has pared back some of the cutting expectations with the market's pricing of a 25-basis point rate cut by the Fed in March at 45%. While investors remain happy with equity exposure as long as the prospect of a recession remains a lower probability, the outlook for the Fed's interest rate policy over the next year will also be crucial for the performance of the US500 and NAS100.
Rate cuts amid a soft-landing scenario is the nirvana backdrop and should keep equity supported on dips.
Regarding the Fed's rate cut pricing, the U.S. PCE inflation data to be released this Friday is worth noting. The median forecast suggests that the general PCE quarter-on-quarter growth is expected to be 0.2%, with the year-on-year increase remaining at 2.6%. Core PCE quarter-on-quarter and annual growth are projected to be 0.2% and 3% respectively, with the latter's previous value being 3.2%. If inflation is higher than expected, it could delay the timing of the first rate cut, and maintaining a longer period of high-interest policy could impact the performance of risk markets including U.S. stocks.
Related articles

.jpg?height=420)
The material provided here has not been prepared in accordance with legal requirements designed to promote the independence of investment research and as such is considered to be a marketing communication. Whilst it is not subject to any prohibition on dealing ahead of the dissemination of investment research we will not seek to take any advantage before providing it to our clients.
Pepperstone doesn’t represent that the material provided here is accurate, current or complete, and therefore shouldn’t be relied upon as such. The information, whether from a third party or not, isn’t to be considered as a recommendation; or an offer to buy or sell; or the solicitation of an offer to buy or sell any security, financial product or instrument; or to participate in any particular trading strategy. It does not take into account readers’ financial situation or investment objectives. We advise any readers of this content to seek their own advice. Without the approval of Pepperstone, reproduction or redistribution of this information isn’t permitted.