- English
- 简体中文
- 繁体中文
- ไทย
- Tiếng Việt
- Español
- Português
- لغة عربية
- English
- 简体中文
- 繁体中文
- ไทย
- Tiếng Việt
- Español
- Português
- لغة عربية
Twin Risk Events ahead - OPEC+ Meeting and Non-Farm Payrolls
.jpg?height=93&quality=100)
Crude has been under pressure since the start of this week as fears over the spread of the delta variant causes a rethink on the demand outlook amongst oil market participants. Australia and regions within Asia are all tightening their restrictions, reducing expected mobility. Hong Kong, Spain and Portugal all imposed restrictions on British travellers as covid cases continue to rise rapidly in the UK. Germany and France are also looking at implementing some of their own restrictions. The net result of this is less traveling, which will lead to lower jet fuel consumption of oil.
The market is pricing in 500k bbls/d of additional supply to be announced at Thursday’s OPEC+ meeting. That would bring this year’s total additions to 2.4 mln bbls/d. The Saudi’s remain cautious due to uncertainty related to the demand outlook and given the recent price pressures in spot markets I’d be surprised by a larger than 500k bbl/d increase for the month of August. In that scenario oil would most likely be pushed lower. A below 500k bbl/d increase should see oil retrace some of its recent losses. Tradeable opportunities will lie in spot crude markets as well as oil related currencies.
Spot Crude:
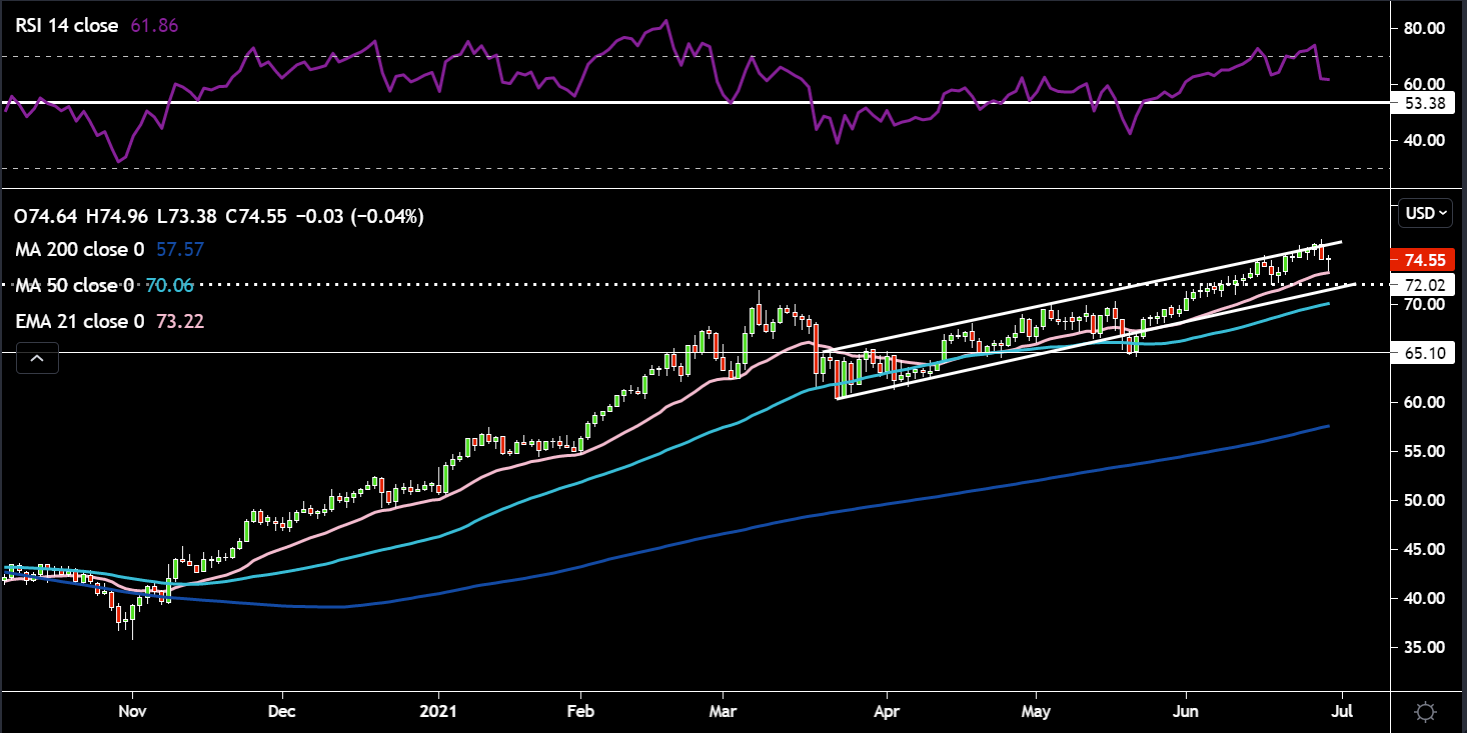
Price is still fluctuating within its ascending channel, it actually peaked its head slightly above the upper trendline of the channel at $76. There is support around the $72 level and before this we have the 21-day EMA which provides further support around $73. These levels will need to be held for bullish momentum to continue with the lower trend line of the ascending channel being the line in the sand. The RSI indicator has moved swiftly out of overbought territory and is now close to the pivotal 53 level. In terms of price targets, the upside target would be around $80 and on the downside I'd be monitoring the $72 zone. I suspect dips will continue to be bought.
USDCAD:
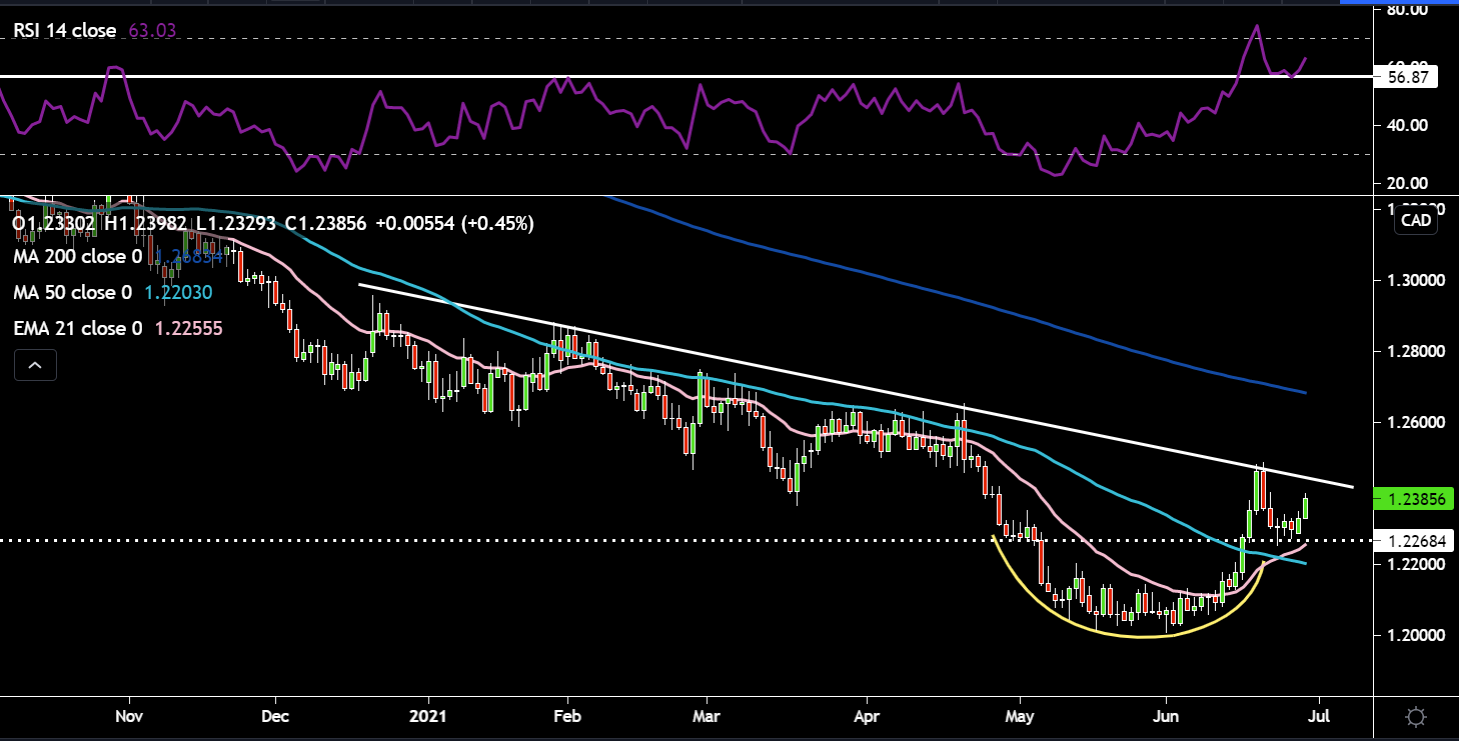
USDCAD is making some bullish price moves. It held the 1.226 support and now looks to be eyeing the downtrend line, which has proven so far to be insurmountable. The RSI is now above the 56 level which marked previous tops as price brushed up against the downtrend line. It looks like a cup and handle pattern could be forming with this recent retracement lower and now moving higher. It will be key to see what price does as it hits the downtrend line resistance. There is still quite a lot of room before the RSI reaches overbought territory. This cross can be traded potentially two ways – looking at longs on a breakout above the downtrend line resistance or shorting at the downtrend line.
The next key market event is the Non-Farm Payrolls out on Friday. The market is expecting a gain of 690/695k (Reuters and Bloomberg estimate respectively) for the month of June. This would be a decent gain on May’s 559k gain and will keep the trend moving in the right direction. Wednesday’s ADP numbers could give us some rough guidance on what to expect for Friday. A solid report should see the Fed continue on their voyage of policy normalization with Jackson Hole in late August proving a pivotal policy meeting. A strong beat should see yields tick higher as tapering becomes more embedded in market expectations. This should be dollar positive too and put gold under pressure.
DXY:
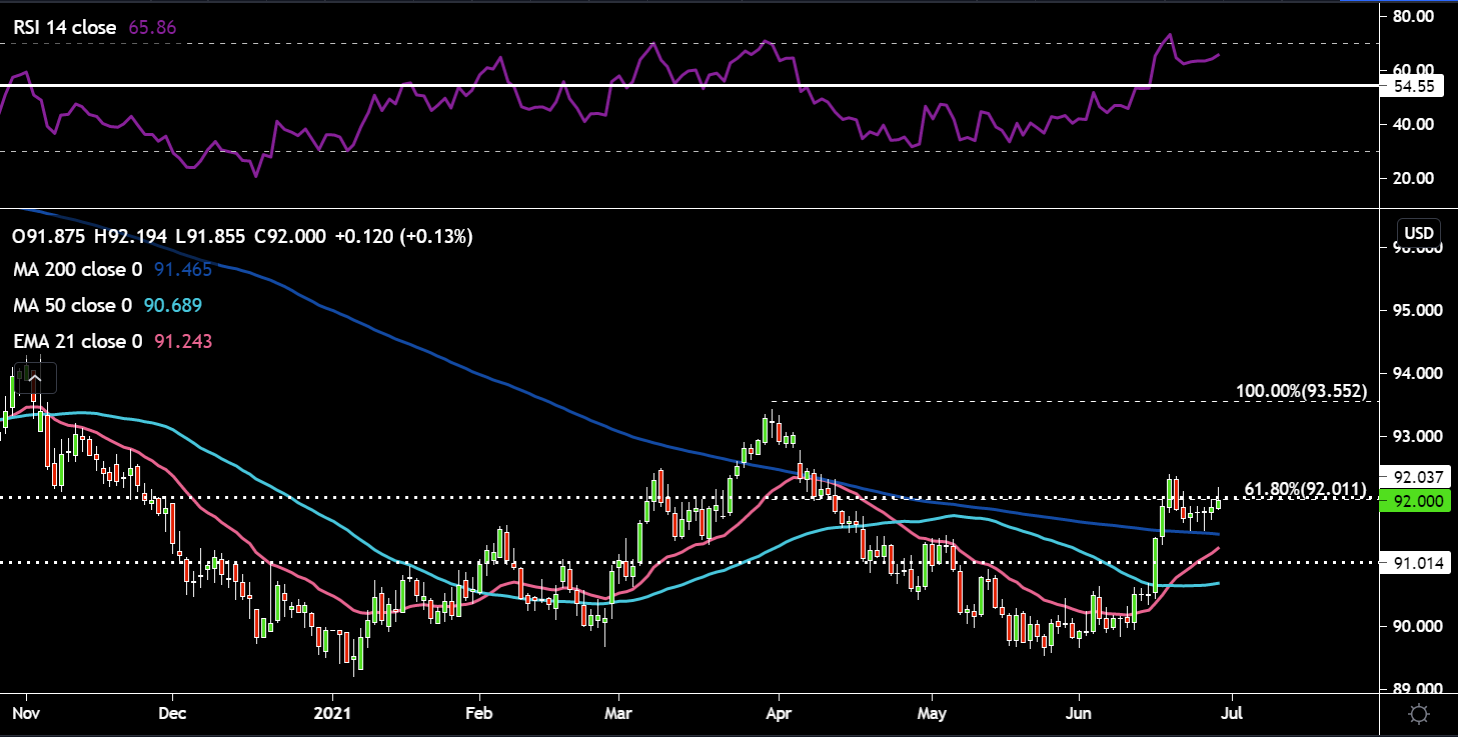
Price is right on the 92 level and the 61.8% Fibonacci level. While price remains above the 200-day SMA the bias towards price direction is upwards. The RSI is moving closer to overbought territory and still remains above the key 54.55 level. The 21-day EMA is creating some distance between itself and the 50-day SMA. It’s now having a go at pushing up above the 200-day SMA too. On downside moves through the 200-day SMA, I’d monitor the 21-day EMA, which comes in at 91.25 and the 91 support level. To the upside, positive moves through 92 would put the 18 June high of 92.405 in play.
Gold:
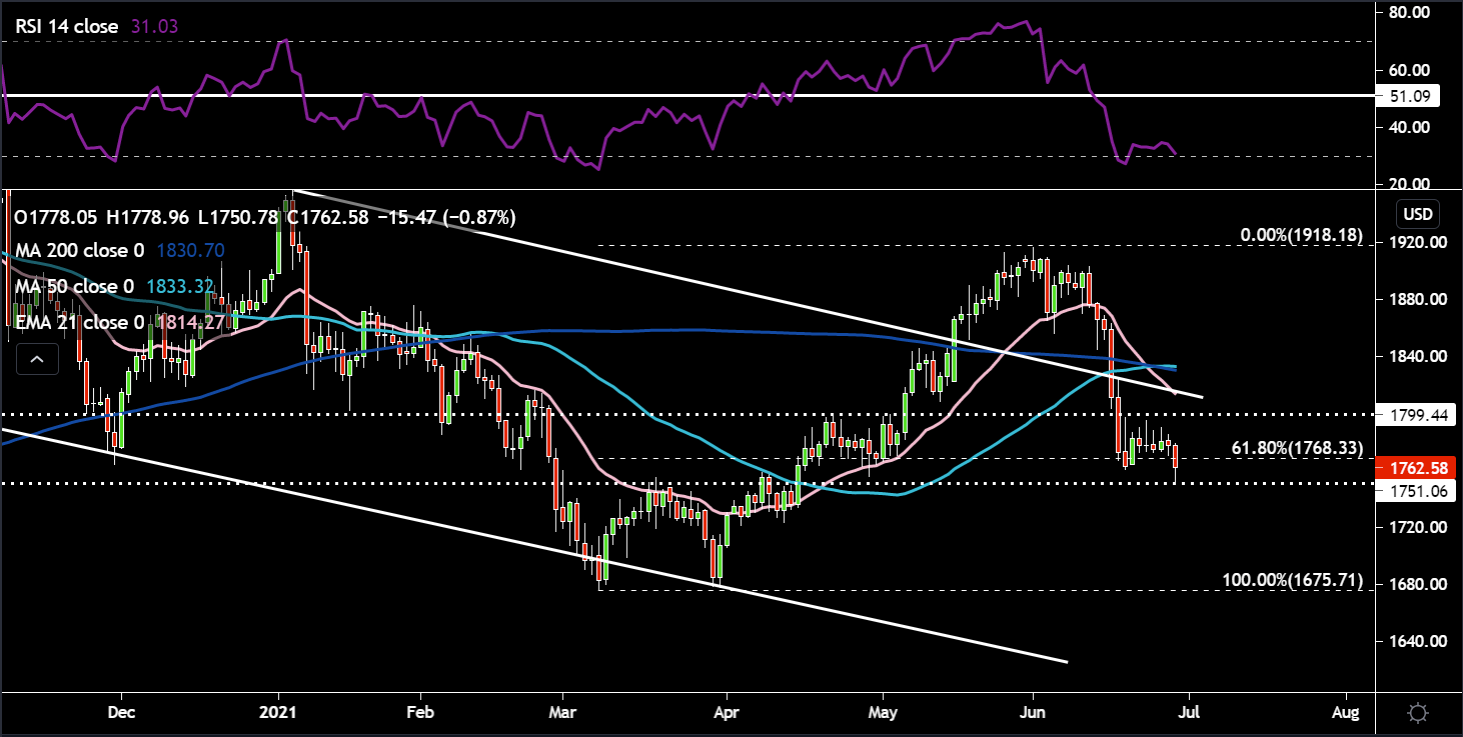
Gold’s kryptonite is higher yields and a stronger dollar. That’s why we could see a big reaction after this Friday’s Jobs data. Looking at the charts, gold has now sliced through the 61.8% Fibonacci level and sitting right on the $1750 support. The 21-day EMA has crossed below both the 50-day and 200-day SMA. The 50-day SMA is ever so slightly above the 200-day SMA, but could make a death cross if price weakness continues. The RSI is moving back into oversold territory on this latest price move lower. An initial upside price target would be $1800 resistance and to the downside through $1750 support, $1725 would peak my interest.
USDJPY:
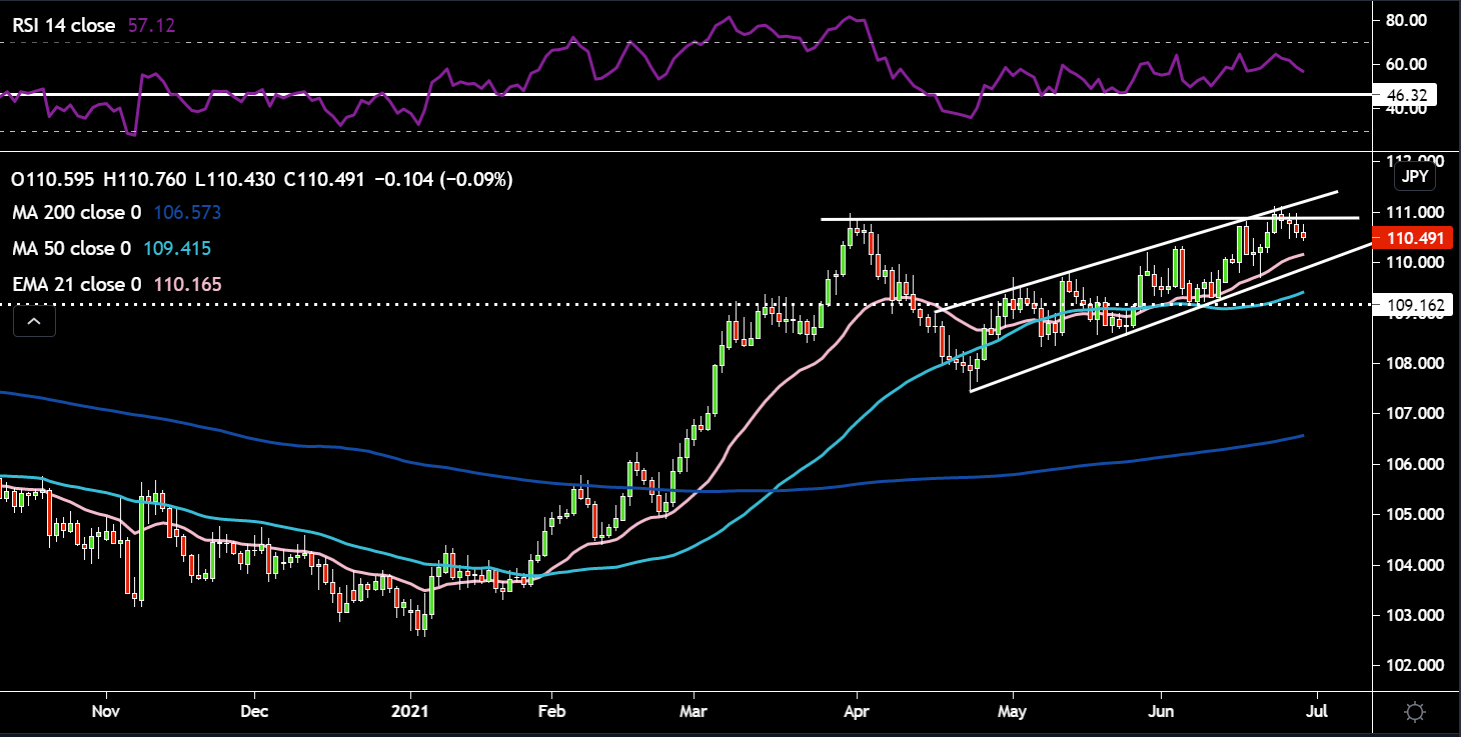
You can’t mention yields and not speak about the USDJPY pair. Technically, price suffered some high altitude sickness around the 111 area as it ran into the upper trend line of the ascending channel and horizontal resistance. The RSI has turned lower as it bumped up against the 65 resistance. Still see this cross as ripe for a buy the dips strategy with pullbacks towards the 21-day EMA being a potential trigger point. A sustained move lower would open up the 50-day SMA and 109 support level.
Related articles


Ready to trade?
It's quick and easy to get started. Apply in minutes with our simple application process.
The material provided here has not been prepared in accordance with legal requirements designed to promote the independence of investment research and as such is considered to be a marketing communication. Whilst it is not subject to any prohibition on dealing ahead of the dissemination of investment research we will not seek to take any advantage before providing it to our clients.
Pepperstone doesn’t represent that the material provided here is accurate, current or complete, and therefore shouldn’t be relied upon as such. The information, whether from a third party or not, isn’t to be considered as a recommendation; or an offer to buy or sell; or the solicitation of an offer to buy or sell any security, financial product or instrument; or to participate in any particular trading strategy. It does not take into account readers’ financial situation or investment objectives. We advise any readers of this content to seek their own advice. Without the approval of Pepperstone, reproduction or redistribution of this information isn’t permitted.