- English
- 简体中文
- 繁体中文
- ไทย
- Tiếng Việt
- Español
- Português
- لغة عربية
- English
- 简体中文
- 繁体中文
- ไทย
- Tiếng Việt
- Español
- Português
- لغة عربية
Learn to trade
Some basic information about MTN
MTN is Africa’s largest mobile network operator. They provide voice, data, fintech, enterprise, wholesale and API services to more than 270 million customers in 19 markets. We look to break down and review MTN share price from a fundamental and technical perspective.
The head office is based in Johannesburg. They operate in many African and Asian countries.
In 2021, MTN’s revenue was 181,646 million ZAR with a net income of 13,750 million ZAR.
The rise and fall of MTN shares
MTN share price traded to a peak of 21149 on the 3rd of March 2022. This was 5 days before an earnings report showing a mild beat in revenue (reported 9.497 trillion, estimated 9.253 trillion).
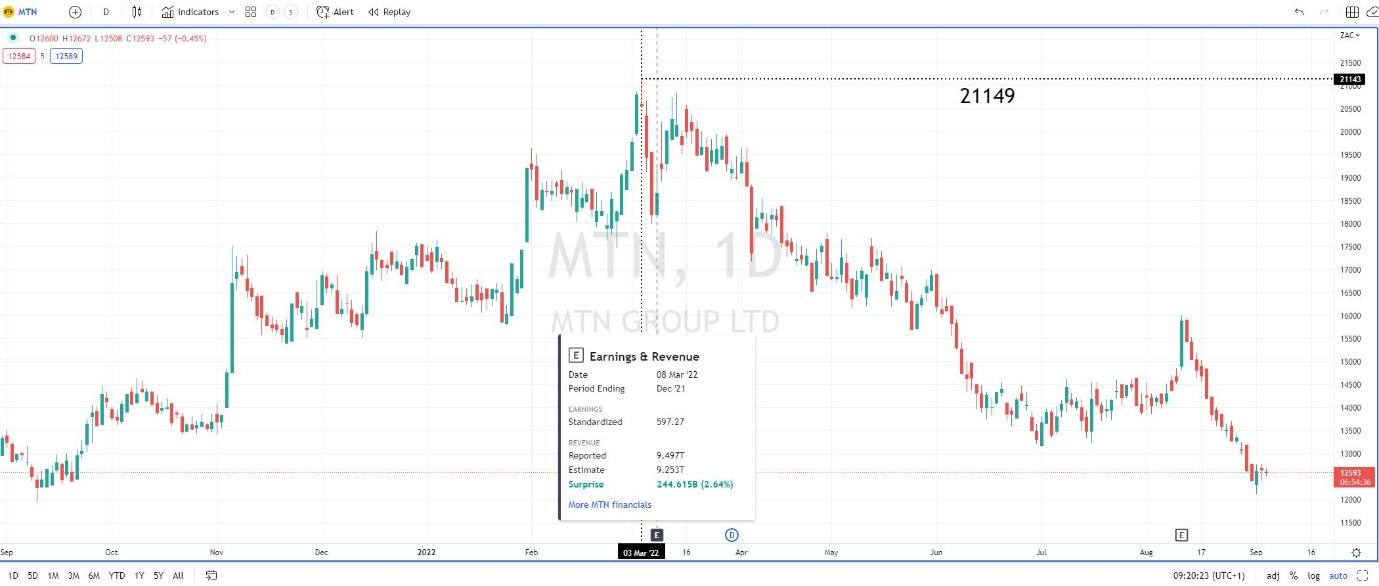
Figure 1 MTN share price peak
Why did MTN shares price decline in March?
A look from the fundamental view. The company blamed the decline in the share price on the cost to renew its operating licence for MTN Rwanda.
The decline was further accelerated in early April 2022 when the Nigerian communication watchdog (NCC) placed a ‘receive only call’ status on some mobile users until SIMs were properly linked to their National Identity Numbers.
A look from a technical perspective
Is this a broad-based decline in the telecom sector?
EXV2 is the Stoxx Europe 600 Telecommunications ETF. The fund offers exposure to telecom companies in Europe. How did MTN fare against EXV2?
The answer is ‘not very well’. Since the last earnings reports on the 11th of August 2022, MTN share price has declined another -20% while the telecom fund has seen a decline of -4.5%.
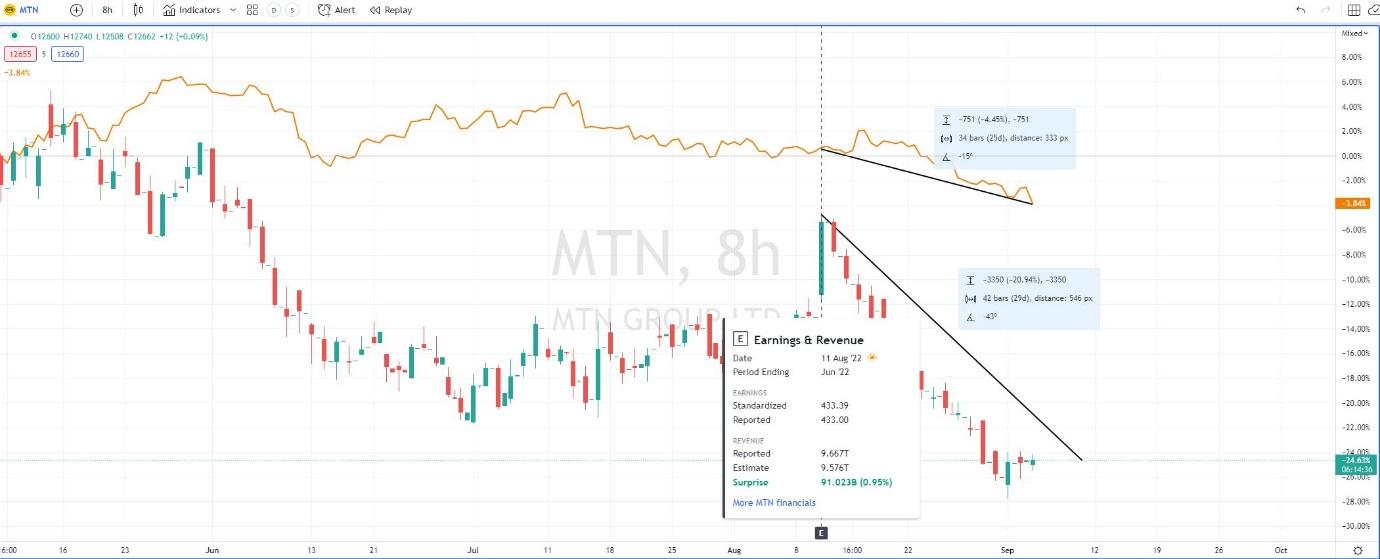
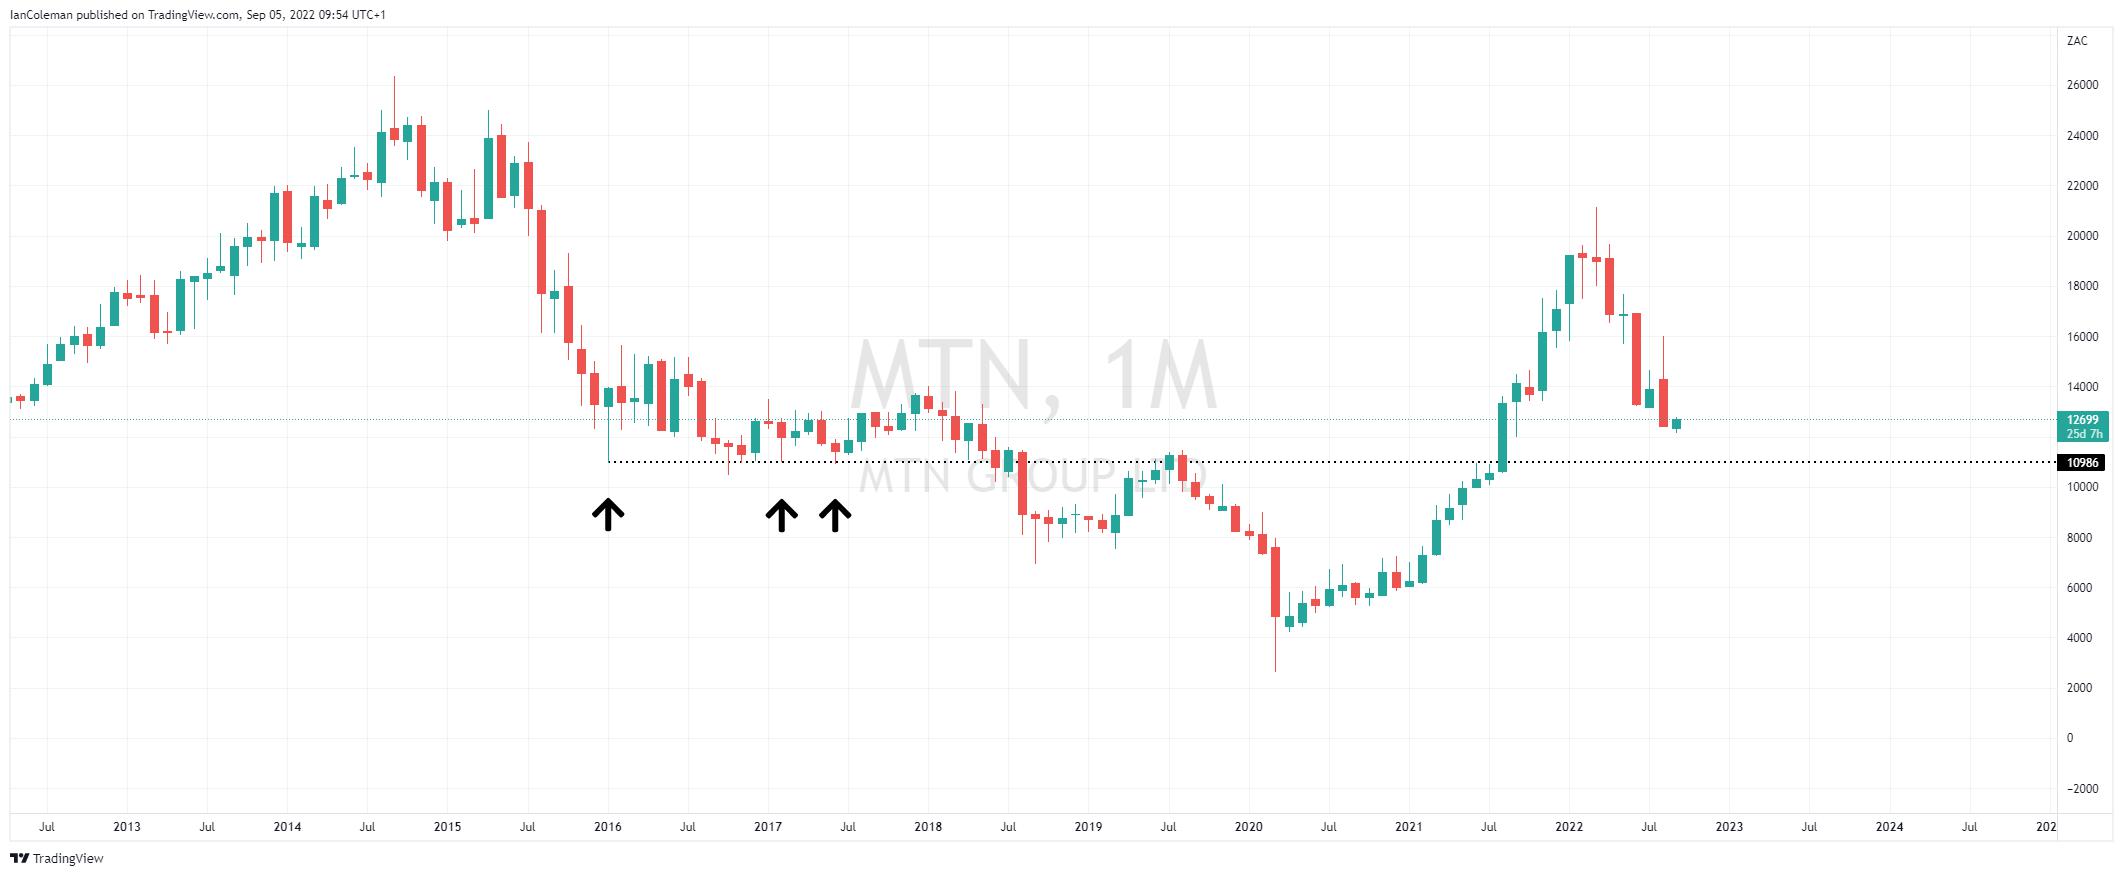
Figure 3 MTN previous support
Looking at the technical study of symmetrical patterns, 10986 could form the start of the BC leg of a cypher pattern known as a Bat formation. This pattern would suggest a correction to the upside once the AB leg completes.
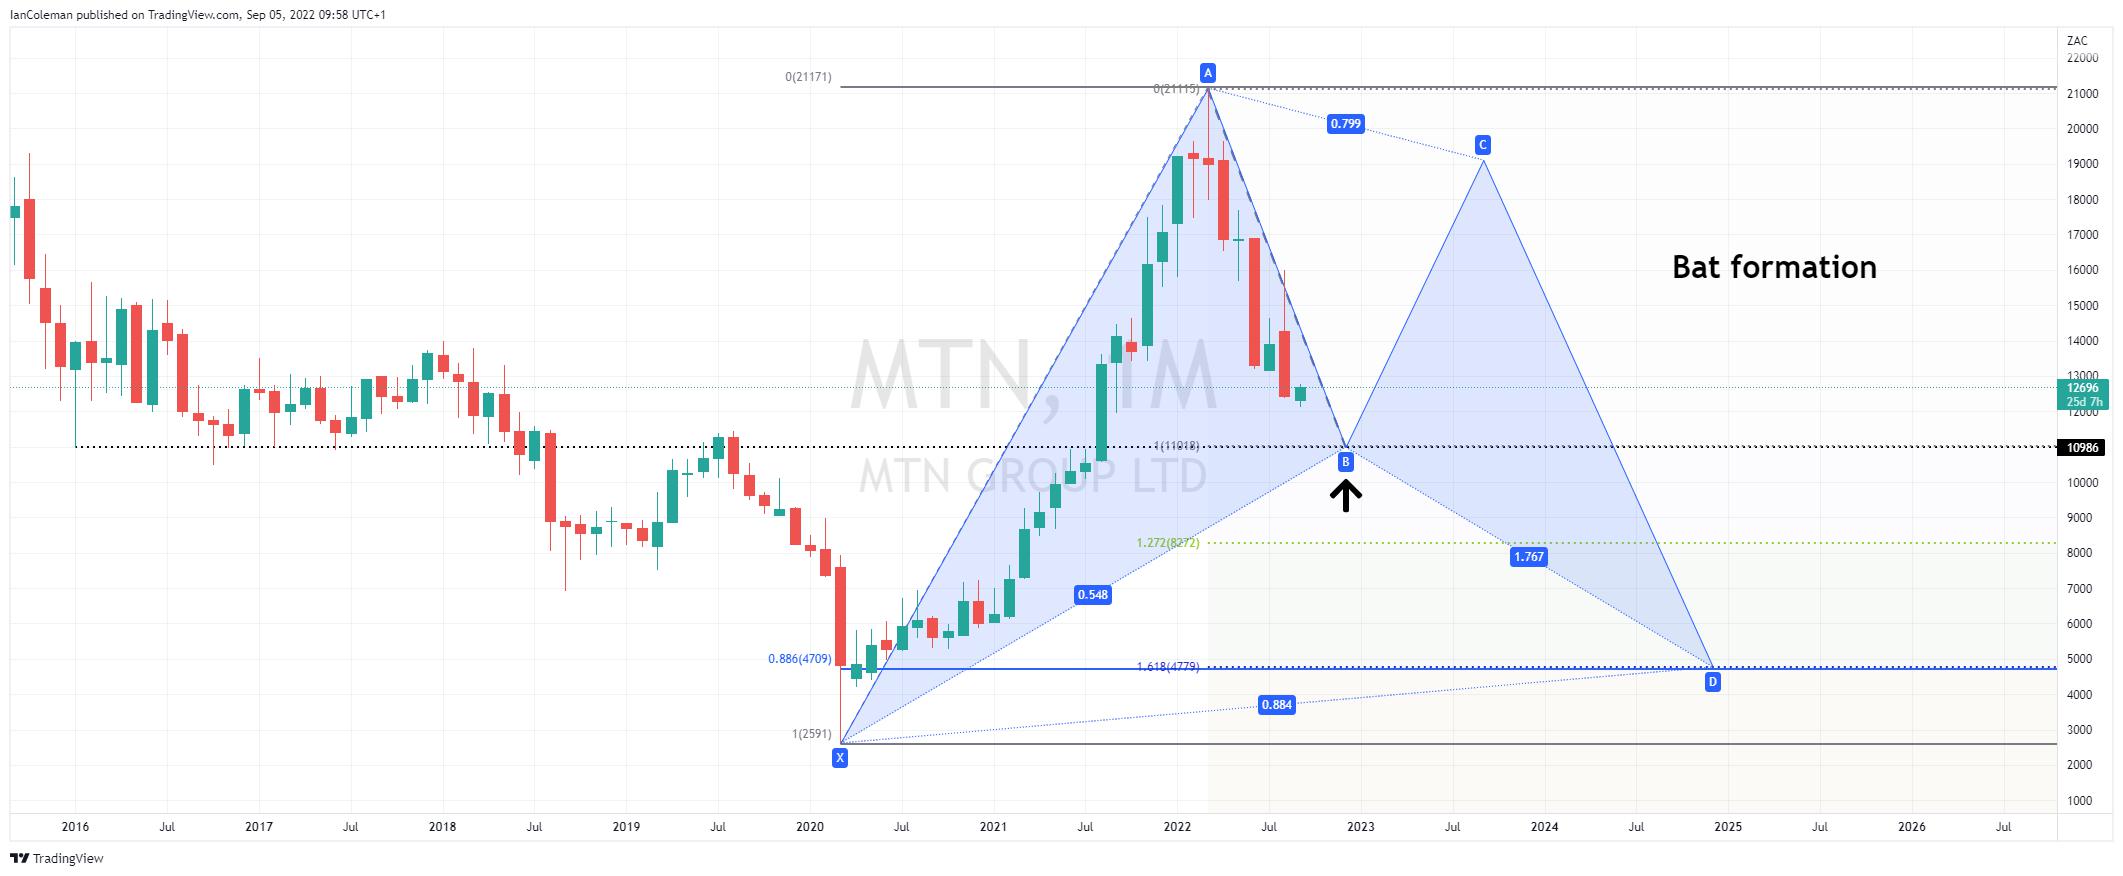
Figure 4 MTN Bat formation
Related articles


The material provided here has not been prepared in accordance with legal requirements designed to promote the independence of investment research and as such is considered to be a marketing communication. Whilst it is not subject to any prohibition on dealing ahead of the dissemination of investment research we will not seek to take any advantage before providing it to our clients.
Pepperstone doesn’t represent that the material provided here is accurate, current or complete, and therefore shouldn’t be relied upon as such. The information, whether from a third party or not, isn’t to be considered as a recommendation; or an offer to buy or sell; or the solicitation of an offer to buy or sell any security, financial product or instrument; or to participate in any particular trading strategy. It does not take into account readers’ financial situation or investment objectives. We advise any readers of this content to seek their own advice. Without the approval of Pepperstone, reproduction or redistribution of this information isn’t permitted.