- English
- 简体中文
- 繁体中文
- ไทย
- Tiếng Việt
- Español
- Português
- لغة عربية
A trader’s week ahead playbook - events that should move the dial

Case in point, for those calling for an imminent recession, the fact US businesses added 372k jobs in June, after 384k in May, has some believing that if the US is indeed in the early throes of a truly protracted recession. However, we’re not seeing much evidence of it just yet – at least in the hard data. The US payrolls report has seen US Treasury yields rising again and the Fed are all but assured of hiking by 75bp in the 27 July FOMC meeting, hell-bent on getting the fed funds rate to 3% by November at the latest.
The week that was brought out USD buyers, with EURUSD losing 2.2% last week to touch 1.0072 and everyone is asking when we get to parity. Interestingly, the daily candle on EURUSD (or the DXY) shows increased signs of fatigue and a bullish break above 1.0191 (Friday’s high) holds the potential for 1.0279 – as the volatility matrix shows, above 1.0300 and the price moves into the breakeven territory on options vol strategies - so the prospect to sell rallies on the week into here looks compelling.
Daily chart of the EURUSD
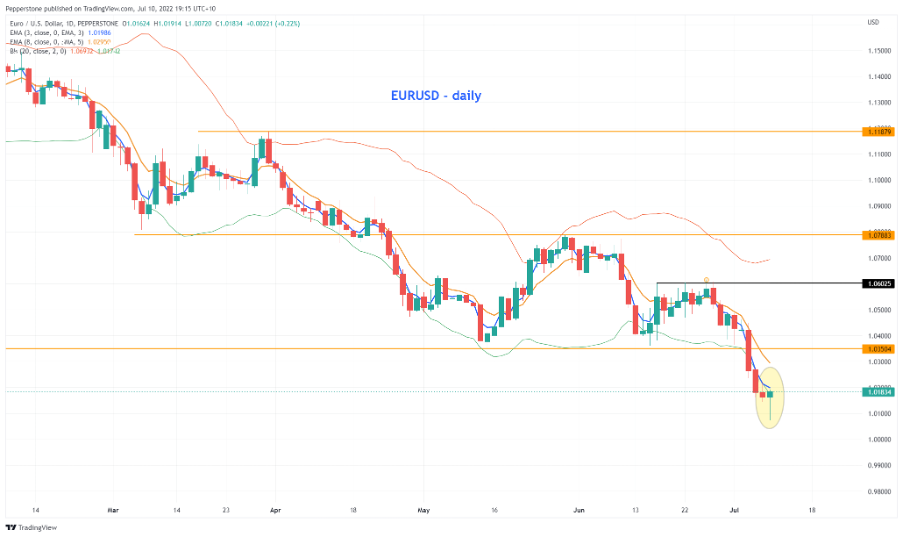
(Source: TradingView - Past performance is not indicative of future performance.)
We watch US CPI as the core driver of risk this week – the form guide over the past 12 months suggests the risks of a beat to consensus expectations (8.8%) is high - For the quants out there, since August 2021 we have seen the NAS100 has fallen every time in the six hours after the CPI drops (except for January 2022) by an average of 0.7% - they say history doesn’t repeat but it rhymes.
It, therefore, wouldn’t surprise to see 8.9%, maybe even 9% and that should keep US bond yields headed higher, potentially providing the catalyst to push USDJPY through the consolidation range of 136.70. A strong CPI print would also guide the AUDUSD lower, although we have Aussie employment data this week that should only offer a momentary element of volatility (vol) to the AUD before the AUD reverts to being a proxy of global growth and sentiment. Chinese data is also a potential driver of copper and the AUD.
If bullish AUD, I’d be focusing away from the USD, where AUDCHF is a better bullish momentum trade, but it needs an upside break of 0.6700. While EURAUD has seen a decent fall although saw indecision in the price action on Friday and that needs to rectify itself.
Clearly, the shock comes from a weak CPI print – what’s weak? I guess we can only say ‘weak’ relative to consensus, but a fall below 8.5% would see bond yields lower and risk a negative response in the USD – Conversely, crypto and gold find buyers and the NAS100 breaks out as we head into Q2 earnings season, with JPM the release to focus on this week.
The UK political situation makes fascinating viewing – maybe not from a market’s perspective, with GBPUSD 1-week implied vol at the 57th percentile of the 12-month range. However, the events that shaped Boris Johnston’s exit will long be remembered. We’ll learn more about the candidates who will run for PM, and while we may see some traders targeting EURGBP as the political play, unless we see a greater risk of a snap general election or a far bigger fiscal stimulus than the market has as its base case then GBP should have limited political variance. It's hard to see how any of the candidates can turn this ship around anytime soon, although, they may be able to galvanise the Tory party, something that is certainly needed as we begrudgingly trundle towards what could be a miserable winter for the UK.
For FX traders we have central meetings from the RBNZ and BoC and you can see what’s priced and expected below in the Interest rate matrix. 1-Week USDCAD and NZDUSD implied vols are higher than other G10 FX pairs but by no means at extremes – position sizing should be modest, but I have limited concerns holding positions over the meetings.
So, we have built a base for risk, but can it follow through? I guess we watch US real rates, the USD, and earnings - that should drive other markets.
Weekly Volatility Matrix – we look at the market’s implied volatility for the week ahead and derive the expected move. Replicating the ‘straddle’ breakeven rate we can see where the market feels price could get to with a 68.2% and 95% level of confidence. Use for mean reversion purposes and risk exposure.
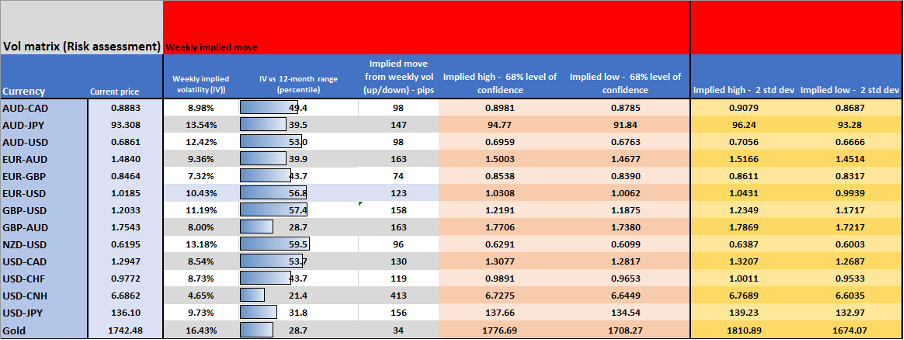
(Source: Pepperstone - Past performance is not indicative of future performance.)
The week ahead calendar – I’ve cherry-picked what I believe to the marquee event risks of the week and shared some brief thoughts to help guide risk.
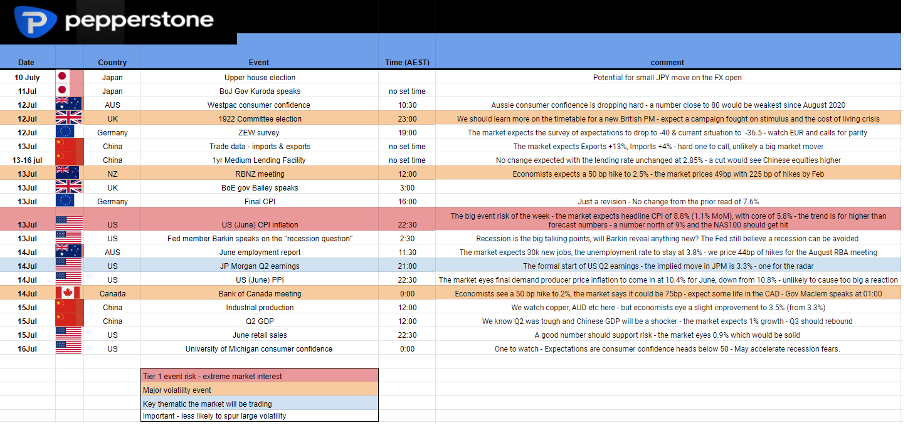
(Source: Pepperstone - Past performance is not indicative of future performance.)
Interest rate matrix – Here we look at the interest rate and swaps pricing to see what is already discounted. This is dynamic but offers insights that help to know where the distribution of outcomes plays out.
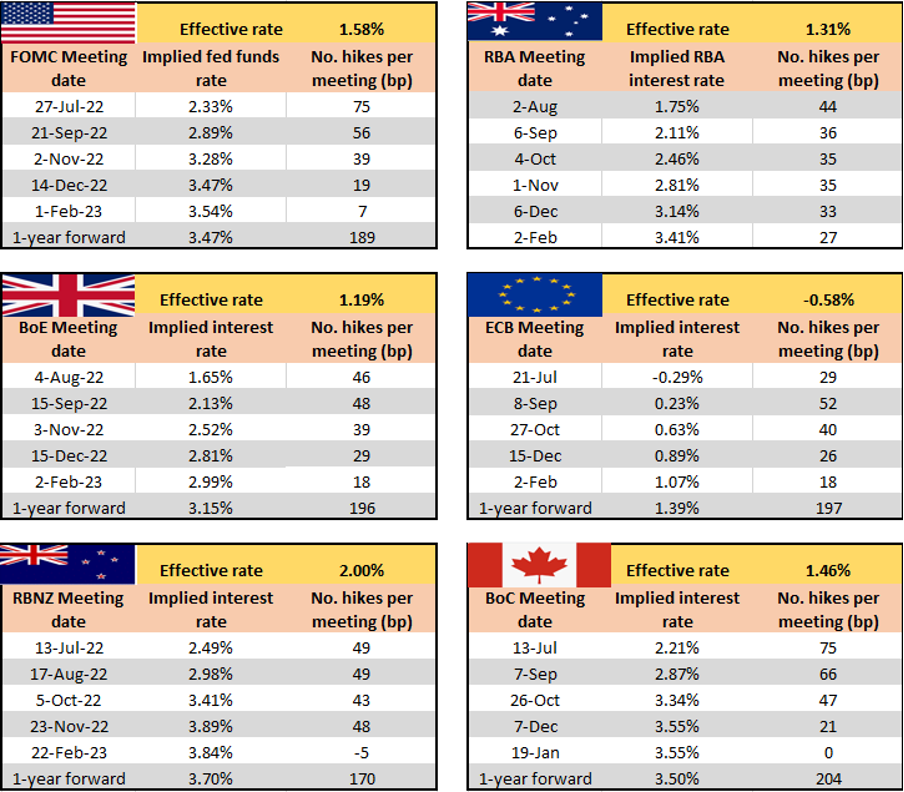
(Source: Pepperstone - Past performance is not indicative of future performance.)
Related articles


Ready to trade?
It's quick and easy to get started. Apply in minutes with our simple application process.
The material provided here has not been prepared in accordance with legal requirements designed to promote the independence of investment research and as such is considered to be a marketing communication. Whilst it is not subject to any prohibition on dealing ahead of the dissemination of investment research we will not seek to take any advantage before providing it to our clients.
Pepperstone doesn’t represent that the material provided here is accurate, current or complete, and therefore shouldn’t be relied upon as such. The information, whether from a third party or not, isn’t to be considered as a recommendation; or an offer to buy or sell; or the solicitation of an offer to buy or sell any security, financial product or instrument; or to participate in any particular trading strategy. It does not take into account readers’ financial situation or investment objectives. We advise any readers of this content to seek their own advice. Without the approval of Pepperstone, reproduction or redistribution of this information isn’t permitted.