- English
- 简体中文
- 繁体中文
- ไทย
- Tiếng Việt
- Español
- Português
- لغة عربية
- English
- 简体中文
- 繁体中文
- ไทย
- Tiếng Việt
- Español
- Português
- لغة عربية
.jpg?height=93&quality=100)
DXY:
The greenback had two major drivers yesterday giving it a much needed bid. The risk-off sentiment which spilled over from the massive slide in Bitcoin causing some safe-haven flows as well as the FOMC minutes which had a slight hawkish tilt. Reading the document would indicate that the Fed looks to have started thinking about thinking about tapering, stating that “a number of participants suggested that if the economy continued to make rapid progress toward the Committee’s goals, it might be appropriate at some point in upcoming meetings to begin discussing a plan for adjusting the pace of asset purchases.” However, the weak payrolls number we got post the meeting, makes these minutes slightly stale. Yesterday’s jobless claim data was mixed with continuing claims missing and initial claims beating. The PMI release out this afternoon could also light the embers of inflation fears again if it comes in really strong. The taper chatter sparked a mild rise in nominal yields combined with a sell-off in oil, lowering breakevens which led to a rise in real yields. Ultimately, the direction of real yields will decide the path the dollar takes – bullish or bearish. If inflation continues to rise with an easy Fed, real yields will continue to trickle lower. If real yields rise as the market continues to call the Fed’s bluff and reprices their rate expectations then the dollar would find support to the upside. Positioning data from last week (not reflective of the CPI print) shows dollar shorts were increased – they’re still not at levels we saw at the beginning of this year, lowering the risk of a powerful short squeeze. Bears looking at this data point could actually argue there is more room for shorts to be pressed harder and hence applying further pressure to the dollar.
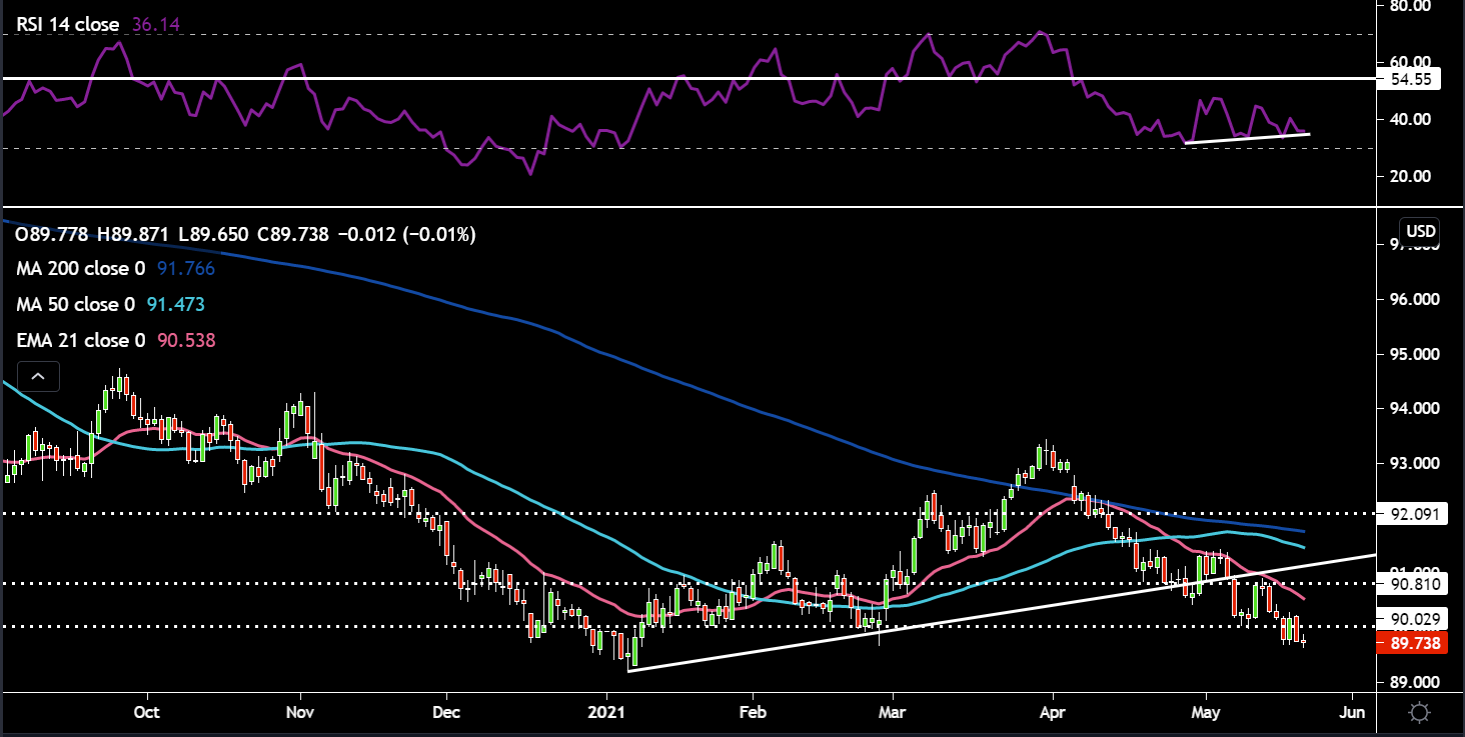
Price has now sliced through the key 90 psychological level and is hovering awfully close to the February 25 low of 89.6. The shorter term moving averages are both pointing downwards as well as the 200-day SMA. However some divergence looks to be taking place between the RSI and price with the RSI making higher lows while price makes lower lows. This could be a sign that selling momentum is waning and a bottom could be put in with a recovery back above the 90 level. For now it looks like rallies are being sold and the dollar has struggled to find an upside catalyst. Historically, seasonality in May points to strength, but so far this has not been the case. To the upside resistance would come in around the round number of 90.5, just below the 21-day EMA. If price slides further then the obvious target would be the January 6 lows of 89.
EURUSD:
Sentiment surrounding the euro continues to favour moves higher. Data out this week was a bit of a mixed bag with euro area Q2 GDP 2nd estimates coming bang in line with expectations and core inflation YoY missing expectations very marginally. Yesterday, German PPI data on a YoY basis just managed to come in higher than expectations. Confidence is coming back for the beleaguered bloc as restrictions begin to be eased (Italy announce plans to lift the majority of domestic restrictions by June 21) - this filtered through into today’s euro wide PMIs which beat expectations. Interestingly, the BTP-Bund spread, a risk barometer for the euro has been widening of late despite an improving outlook. I put this down to either uncertainty over the Italian economic reforms to take place or a bit of tapering being priced in. PEPP favours Italy heavily in their asset purchases. We also had the ECB’s de Guindos on the wires warning of a potential debt crisis in Europe during the next months. Quite a sweeping statement, one which I disagree with. For now the improving economic outlook and yield spread between the US and euro zone moving in the right direction is helping the single currency find some love. The German 10-year yield topped -0.1% for the first time in 2 years.

EURUSD is now comfortably above the downtrend line around the 1.21 area. The bearish candle we saw on Wednesday has been reversed with price bouncing off the 1.216 support. Price also now finds itself above the 21-day EMA and the 50-day SMA has put some distance between itself and the 200-day SMA – avoiding the dreaded death cross. There is some negative divergence when examining the peaks of the RSI and the price peaks. It’s not fool proof but can indicate a potential waning of buying momentum, however, the RSI also has plenty of room to push higher before it becomes overbought. The obvious price target to the upside would be the overhead resistance and previous high of 1.2245. On the downside the 1.205 remains a level of support as indicated by the white dotted horizontal line and the downtrend line.
GBPUSD:
Cable has been chugging along nicely, grinding higher and tagging the 1.42 level. There were some initial concerns about the Indian variant potentially pushing back the full reopening date on June 21 and dampening the bullish economic recovery priced into the pound. So far both health specialists and the PM has said the vaccines should provide adequate defenses against this variant. The pound could also benefit further from the shift in equity flows towards more value themed sectors, providing a tailwind for sterling crosses. The UK has had a big week on the economic data front with labour related data coming in really solid. Inflation was a mixed bag with mostly in line readings and one beat and miss. May PMI data was mixed, but retail sales stole the show with big beats as the reopening of shops in April got underway. On the political/trade sphere, UK-EU negotiator David Frost has taken quite a hawkish tone with the EU over the NI Protocol, hinting if need be Article 16 of the Protocol could be triggered which would likely spark a response from the EU. Ultimately, the current framework is unsustainable, ensuring one of the parties having to move from their current position. Boris Johnson has embraced the tenets of free trade and given his blessing for the AU-UK trade deal to proceed which suffered a setback over agricultural related issues.
Price is holding comfortably above the formerly sticky 1.40 handle. The RSI is remaining above the 53 level, indicating the trend is up with lots of room left before overbought territory becomes a problem. There is a mild bit of divergence happening too which could indicate some buying pressure is waning. Any pullbacks in price is well supported by the 21-day EMA and the horizontal dotted line around 1.40. The initial price target to the upside would be 1.424 around the February 24 high, if price can overcome the round number at 1.42. On Tuesday price got close to the YTD high at 1.422.
USDCAD:
The loonie has certainly thrust itself into the limelight as a combination of factors propel the currency higher. Although of recent oil has been a bit softer, it has been a strong tailwind for CAD, a more hawkish Central Bank allowing for policy divergence in terms of the pace of normalisation, accelerating vaccination rollout and fiscal stimulus spill over effects from south of the border. Inflation data released this week was solid beating on a core (2.3%) and headline (3.4%) basis and above the BoC’s 2% target. Further prints like this could lead to the markets’ pricing in an even more accelerated timeline on the tapering of asset purchases by the BoC. Retail sales are out shortly too. Positioning data could begin to become a bit of a headwind for CAD as it now represents the 2nd largest net long against the dollar in the G10 FX space and is close to peak 2019 positioning levels.
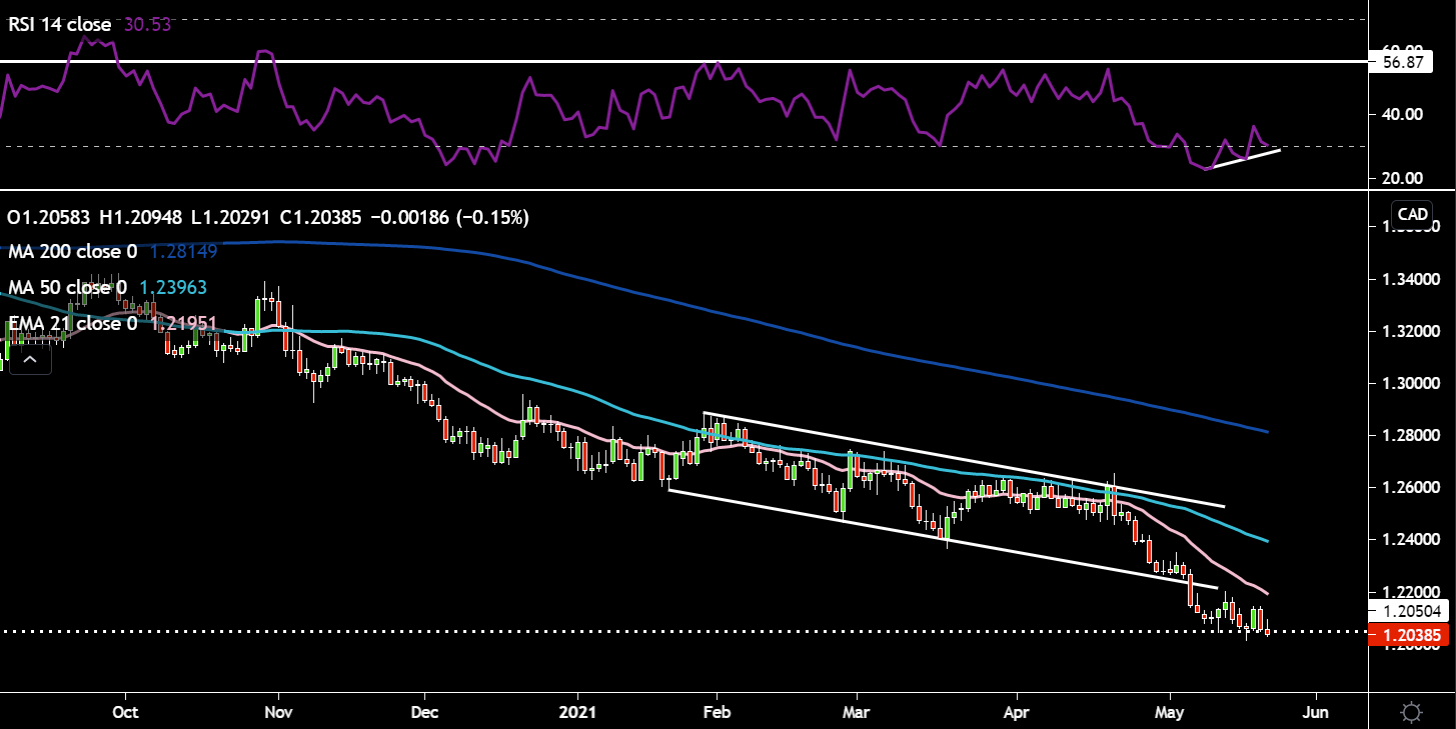
USDCAD has been heading in just one direction – south. It made a large bearish candle which sliced right through the lower trend line of its descending channel and now is sitting on the sticky 1.205 horizontal support. The RSI is moving gradually out of oversold and there is some divergence present as price makes lower lows and the RSI makes higher lows. Any upside moves will need to navigate dynamic resistance in the form of the 21-day EMA first around the 1.22 area. If we slice through the 1.205 support then 1.20 and the 2015 lows around 1.192 are in play.
AUDUSD:
Iron ore, Australia’s largest export has been under pressure as China tries to suppress price gains as well as looking to diversify their supply needs away from Australia into other markets. The minutes out from the RBA didn’t throw any hawkish curveballs at the market. Aussie jobs data was disappointing with a decrease in employment of 30.6k far below expectations for a gain of 15k. The participation rate was lower too despite a slightly lower unemployment rate. Data like this will keep the RBA in the lower for longer camp. It will be interesting to see what happens in the lead up to the July 6 meeting where some important policy decision need to be made such as: the rolling of their 3-year QE target to the November 2024 maturity and a further increase in their QE envelope by A$100 bln. PMI data out early this morning was mixed with the composite and services side of things declining from the previous month and manufacturing slightly improving on the previous month’s print. Retail sales for April were positive and came in stronger than expected. There have also been reports that Australian PM Morrison is encouraging states to scale back on restrictions for vaccinated citizens in an attempt to stimulate domestic travel.
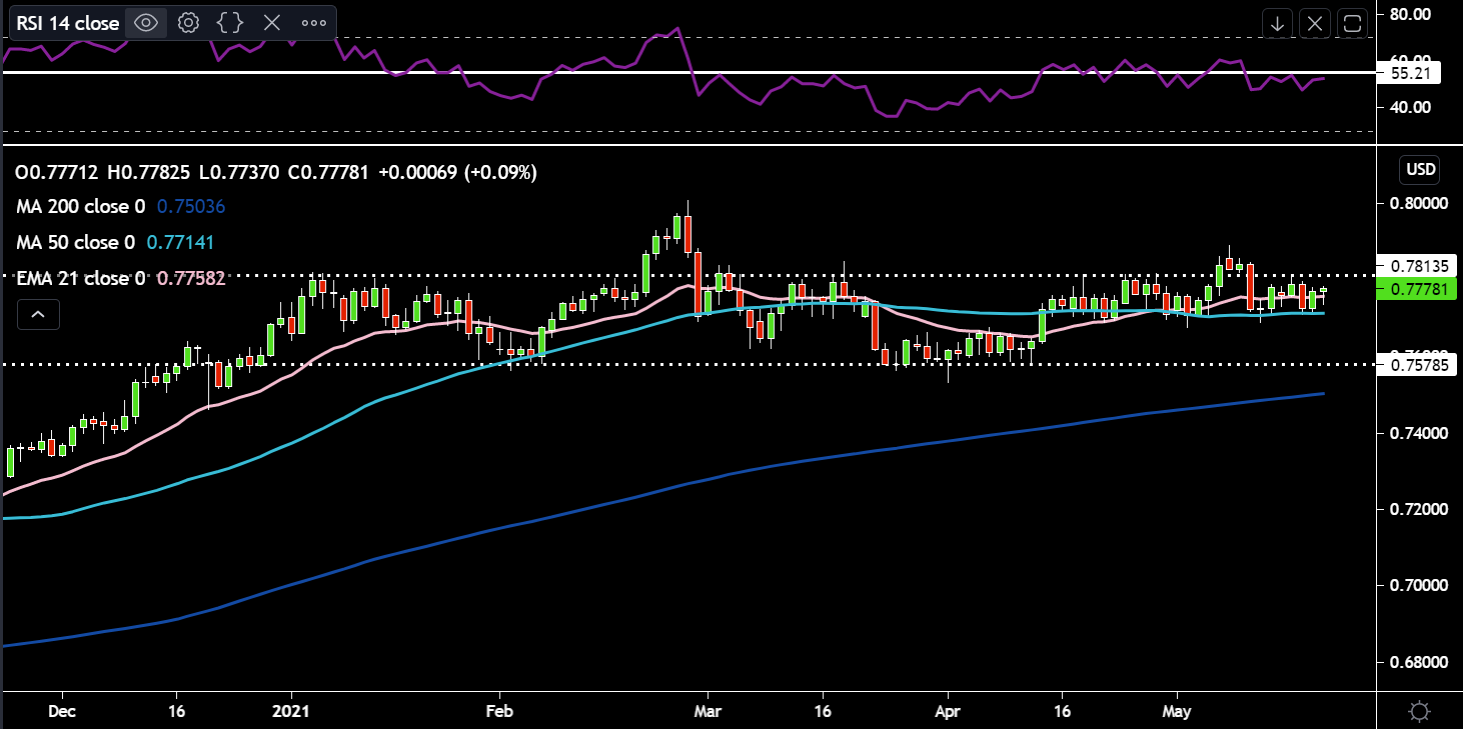
AUDUSD is sitting inside a mini range between 0.77-.778 as dips down to the 50-day SMA see buying action come through. The 21-day EMA is still above the 50-day SMA. However, the RSI is below the 55 level, needing to overcome this zone if bulls can take back control decisively. Looking at previous price action the 0.77 region looks like a good place to potentially reload some longs. The currency is searching for its next big catalyst to lead price direction.
Gold:
Gold has been on a tear and has now firmly broken out of its descending channel as inflation concerns combined with easy monetary policy works in the yield less yellow metal’s favour. The cocktail of increasing inflation expectations and stagnant nominal yields has led to declining real yields. Add a weaker dollar into the mix and gold flies. On the positioning front, data out last week showed that net longs held by hedge fund managers are at their highest in three months. ETF flows are also working in gold’s favour which could be down to a rotation out of crypto and general positive sentiment towards gold. Although tapering chatter in the FOMC minutes Wednesday night, did highlight the risk to gold’s bullish thesis.
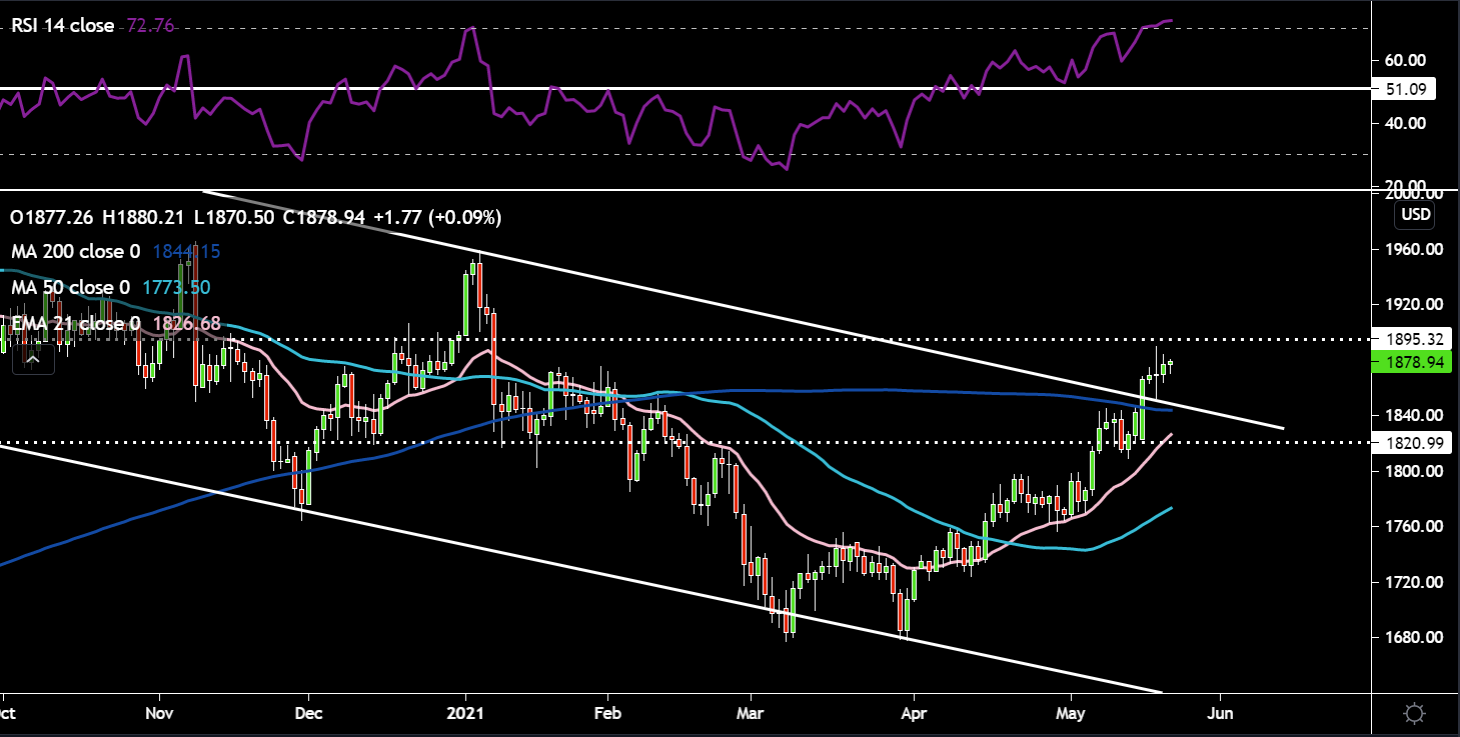
Having breached the descending channel to the upside and now comfortably sitting above its longer term moving average - 200-day SMA. The double bottom pattern we saw in March/April has played out. Price got close to the $1895 resistance, but has pulled back slightly. The RSI has crossed overbought territory at 73. For now it seems like a buy the dips mentality is locked in for gold, with dips back down to the trend line/200-day SMA being a potential zone for longs to be initiated. Just below that you have the $1820/25 support as well as the 21-day EMA.
Oil:
The black liquid has had a tough week out there on numerous fronts. The major factor has been positive rhetoric emanating out of JCPOA talks. The Iranian President stated that there seems to be agreement on key issues such as lifting oil sanctions and central banks, etc. We also had Enrique Mora, the EU's top negotiator, say he's quite sure a deal will be concluded. Talks will adjourn until next week. The hope is to seal a deal prior to the Iranian presidential election in June. Although US inventory data showed builds in inventory, they did come in lower than expectations and would have been distorted by the colonial pipeline drama we saw last week. The risk aversion we saw mid-week also wouldn’t have helped oil either. Another factor which could be an upside risk for oil is the repositioning of portfolios to hedge against inflation, expressed through commodities like oil.

Oil remains largely rangebound, trapped between the $65 and $70 levels. The $70 resistance is proving quite difficult to overcome for the black liquid. For now price is hovering around the $65 support and the 50-day SMA. The RSI is quite a bit below the 53 level, distinguishing the bears are in control in the short term. The 21-day EMA has rolled over slightly. A further slide through the $65 support would bring the $62.50 zone into sight.
Bitcoin:
Crypto markets were a bloodbath this week as a report from Reuters that China is banning financial services companies from providing cryptocurrency services and warned about speculative behaviour in the crypto space spooked markets dramatically. The speed of the move indicates that lots of leveraged traders got taken out on a stretcher. I read a stat that almost 775k margin calls were made totalling almost $8.6 billion worth of crypto. Although there has been a recovery of the 30k lows, bitcoin has certainly been left with a bloody nose. Last night we also had further pressure applied to bitcoin as the US Treasury called for crypto transfers over $10k to be reported to the IRS (US tax authorities).
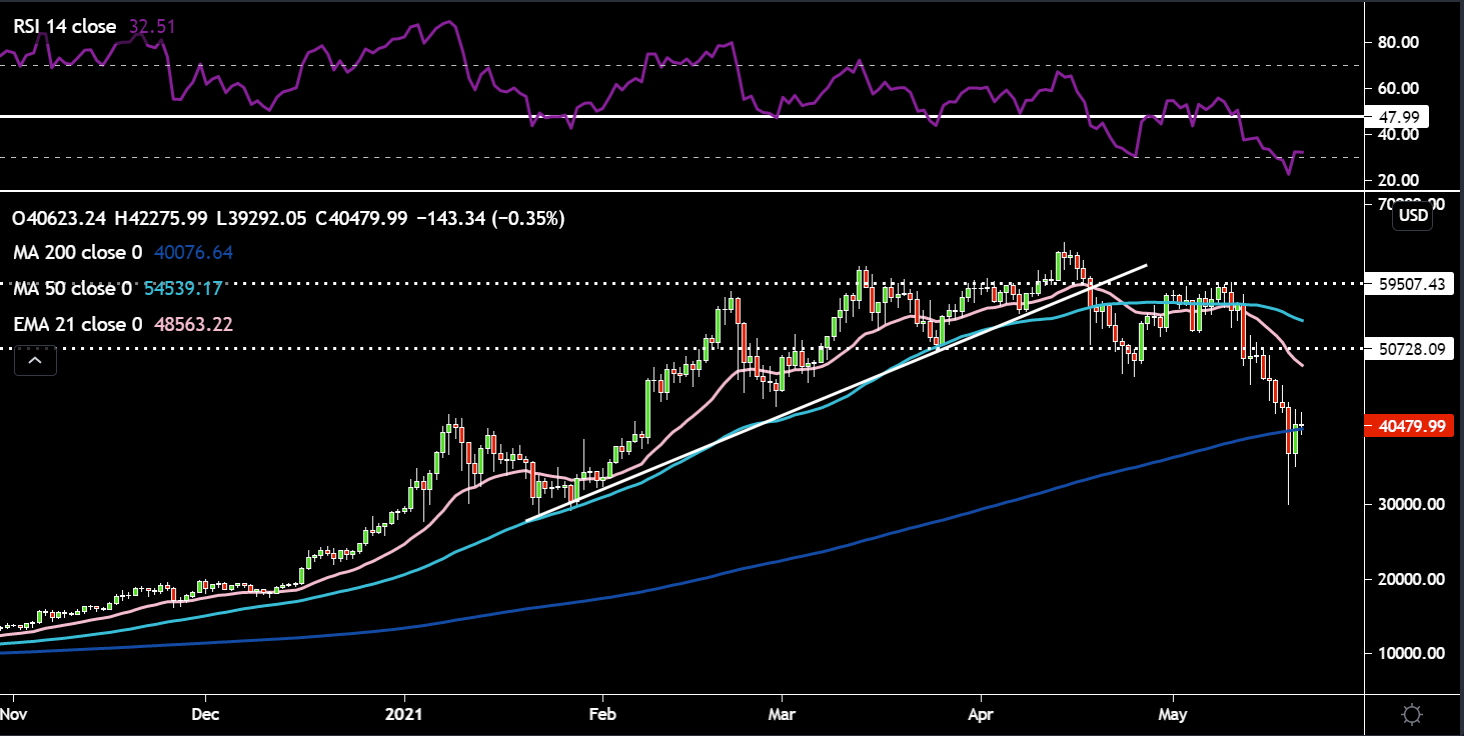
The chart certainly reflects the tough time the digital currency has found itself in. Price fell all the way down to 30k at one stage, which also happened to be the 61.8% Fibonacci retracement level. It looks like we’ve got a bit of an oversold bounce playing out now, whether it can be sustained is anyone’s guess. The RSI has marginally crept out of oversold territory. Bulls will be nervous unless we can see price consistently close back above the 200-day SMA around 40k. If we see a continued push higher the first test of major resistance would come in around 45k. 30k would be the price level to watch on the downside.
Related articles

Ready to trade?
It's quick and easy to get started. Apply in minutes with our simple application process.
The material provided here has not been prepared in accordance with legal requirements designed to promote the independence of investment research and as such is considered to be a marketing communication. Whilst it is not subject to any prohibition on dealing ahead of the dissemination of investment research we will not seek to take any advantage before providing it to our clients.
Pepperstone doesn’t represent that the material provided here is accurate, current or complete, and therefore shouldn’t be relied upon as such. The information, whether from a third party or not, isn’t to be considered as a recommendation; or an offer to buy or sell; or the solicitation of an offer to buy or sell any security, financial product or instrument; or to participate in any particular trading strategy. It does not take into account readers’ financial situation or investment objectives. We advise any readers of this content to seek their own advice. Without the approval of Pepperstone, reproduction or redistribution of this information isn’t permitted.