- English
- 简体中文
- 繁体中文
- ไทย
- Tiếng Việt
- Español
- Português
- لغة عربية
- English
- 简体中文
- 繁体中文
- ไทย
- Tiếng Việt
- Español
- Português
- لغة عربية
.jpg?height=93&quality=100)
Dollar Index (DXY):
The greenback has been drifting lower all week with the first data release setting the negative tone. Consumer confidence missed substantially, then on Wednesday ADP payrolls were dismal missing expectations massively, manufacturing PMIs were mixed with the ISM measure beating expectations, but Markit’s seeing a minor miss to expectations. Jobless claims on Thursday brought a ray of hope as initial claims and continuing claims both surprised positively. Well those ray of hopes were dashed as the headline NFP number came in spectacularly lower than expected – 235k vs 750k exp. Looking further at the report participation and the unemployment rate were dead in line with consensus forecasts. Certainly not a number which meets the criteria for substantial further progress. The greenback, however, has been unreactive and is back where it was pre-NFP. I think potentially the hourly earnings number being higher than expected is keeping the market’s timeline on tapering in check.
We got Positioning data showed a significant spike in net long dollar positioning ($7.5bn, bulk coming from cut in net euro longs) 3 days before Jackson Hole. I had tweeted out on Friday after the event - Some of that pre-Jackson Hole hawkish dollar positioning being unwound. Buy the rumour, sell the fact kind of day. The data now confirms this was the case. It will be interesting to see as tonight’s data is released how traders were positioned into today’s jobs report. Given the reaction in the dollar, I’d say it was most likely trimmed quite a bit.
.PNG)
Price is below its 50-day SMA and is also below the 92.385 horizontal support. Post NFP price slipped just below the 92 level, but has retraced those losses now. The RSI has fallen below the 55 level and is now hovering just below the 42.93 mark where price managed to hold last time it sold-off. I do wonder if the dollar index is in a range between 93.209 and 89.656 as indicated by the white solid lines drawn on the chart. The upside price target would be 92.59 (50-day SMA) and 92.8. On the downside, 92 and 91.5 (above the 200-day SMA) would pique my interest.
EURUSD:
Data wise, preliminary inflation data out from Germany was in line with expectations on the YoY measure but missed on the MoM figure by 10bps. Unemployment data out from Germany was solid, beating expectations and seeing then unemployment rate drop by 0.1% to 5.5%. Inflation was nice and punchy for the eurozone with the headline YoY number printing at 3% (2.7% exp) as well as the core measure at 1.6% vs 1.5% exp. It was this inflation number which re-awakened ECB hawks and provided them with breathing room to be ramp up their tapering rhetoric before next week’s ECB meeting (I’ll be providing a preview for this event). In summary, we should see some growth and inflation upgrades and potential for a tapering of their PEPP in Q4 of this year.
The hawkish rhetoric and potential reshaping of market expectations about the ECB’s asset purchases (saw this in yields moving higher across bunds and BTP-Bund spread) has provided the single currency with a tailwind throughout the week. Retail sales for July from Germany were absolutely abysmal, manufacturing PMI figures from both Germany and the eurozone as a whole were slightly weaker than expected. Services PMIs continued the negative trend this morning indicating supply chain problems are hitting output growth. Euro net long positioning from last week was cut with a machete by $4.8bn (largest one-week move against the EUR since mid-2018) and accounts for the bulk of the latest move in favour of the USD.
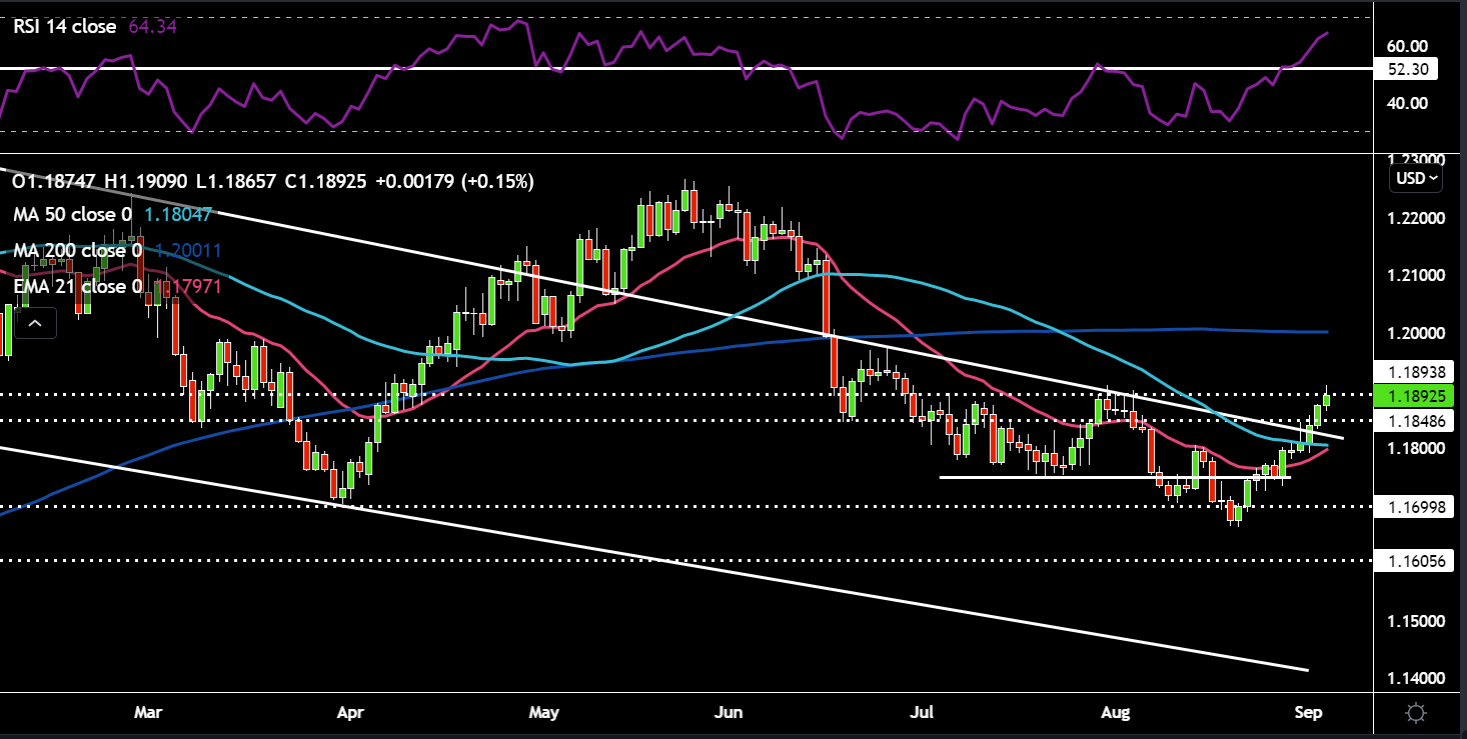
The euro has been resilient of late against the dollar, climbing above its 50-day SMA and upper trend line of its descending channel. Price is also now pushing up against horizontal resistance at 1.19. The RSI has surpassed the 52 resistance zone comfortably. The weak NFP number has left EURUSD unreactive. Upside targets remain 1.19 resistance and on the downside 1.18 (50-day SMA) and 1.175 support.
GBPUSD:
There’s been a couple of interesting developments for the pound this week. However, NFP is overshadowing all of them. On the fiscal policy side, the media is reporting that the Government is going to raise the National Insurance tax by at least 1% and maybe as much as 2% (breaking their manifesto pledge). This is on top of the planned corporate tax hike. I’m not impressed to say the least. Fiscal tightening is not exactly great for any currency. Furlough will expire at the end of this month (roughly around 1.8 mln workers still on furlough).
On the central bank side of things, Huw Pill will be replacing Andy Haldane as Chief Economist at the BoE. He was Goldman Sachs’ former Chief European Economist. Short-term rates continue to diverge with the euro money market rates as markets see the BoE moving before the ECB (May 2022 sees a 15bps hike priced). Manufacturing PMI figures were revised up positively (beating expectations), however, services and the composite number out today dropped the ball by missing consensus estimates. Net long positioning in the pound flipped net short ($1.4bn), driven by a big increase in gross shorts.
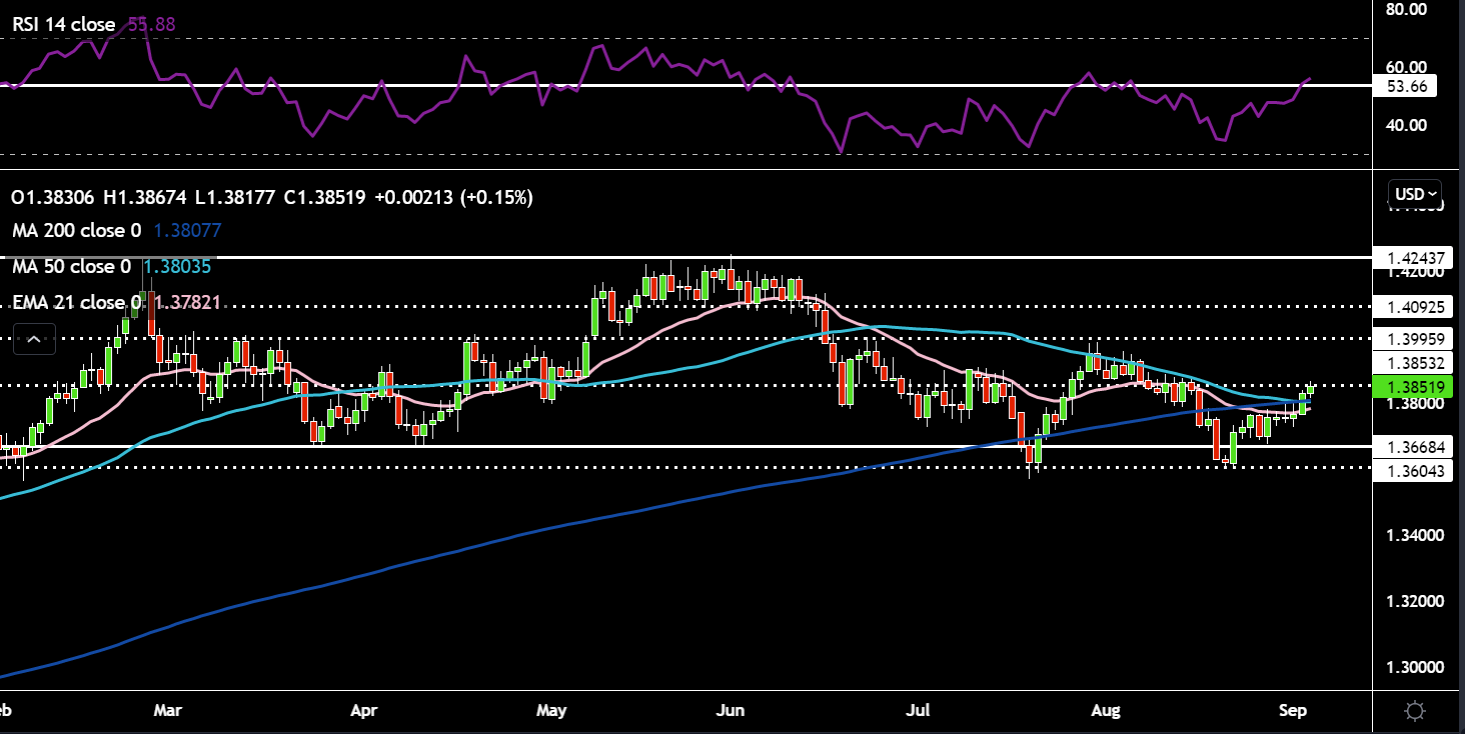
Cable is back above both the 50-day SMA and 200-day SMA. There is also a death cross which has occurred (not great for the bulls in terms of medium term trends). Price is kissing the 1.385 resistance currently. The RSI is also just above the 53 level which contained previous bullish price moves. Potential targets on the upside are 1.395 and 1.40 resistance. On the downside 1.36/6 double bottom support would be key.
USDJPY:
Like most crosses, the yield sensitive dollar yen has done absolutely nothing this week, as yields have also done nothing. Some notable news flow out overnight, stated that Suga will not be running in the upcoming elections. It’s done nothing to the currency as someone with a senior post from his party will replace him, avoiding risk of an unknown candidate.
Dollar yen needs something to break it out from its sleepy range bound movement. Trapped between the 50-day SMA and 21-day EMA as well as the RSI tight range of 58 and 46. A strong jobs number should see yields move higher which should see a bid in USDJPY. Vice versa for a soft jobs number. Targets wise 110.3 resistance would be a good initial area to keep an eye on and with a move lower 109.7 support would be key.
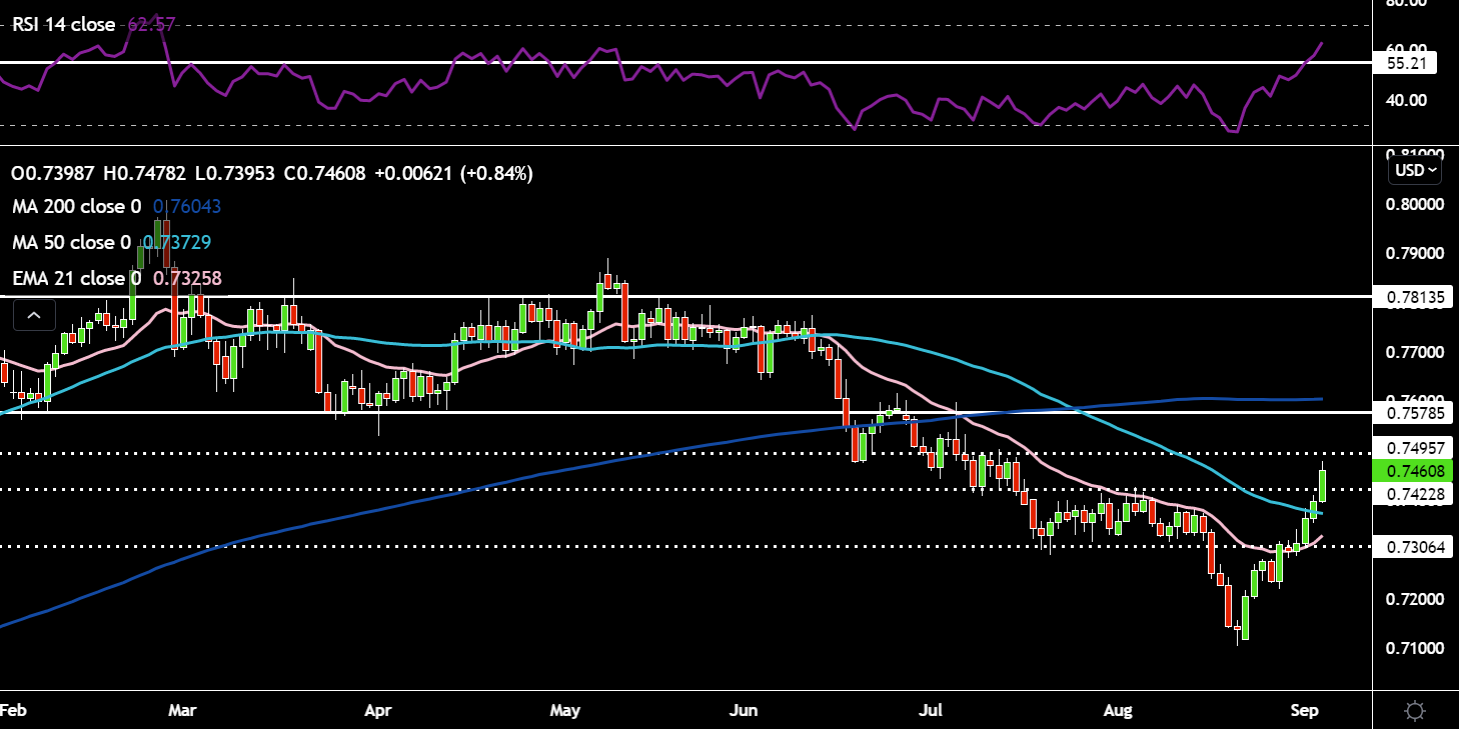
AUDUSD:
Q2 Business inventories data QoQ missed expectations by a lot, printing at 0.2% vs 1.3% forecast. However, this didn’t feed through into GDP numbers out on Wednesday which toppled the 0.5% QoQ expectations by 0.2%. The data is stale now as lockdowns have been in place for most of Q3. The trade surplus out yesterday was very solid beating expectations by almost A$2bln. Despite weak Chinese data, declining iron ore prices and major Aussie banks now predicting a delay to the RBA’s plans to taper their asset purchases at next week’s meeting – AUD if flying. A weak dollar has certainly helped, vaccine rates are surging higher and given such bearish positioning (net shorts now at $4.1bn - largest bearish position in the AUD since September 2019) we could be seeing some short covering as sellers jump ship.
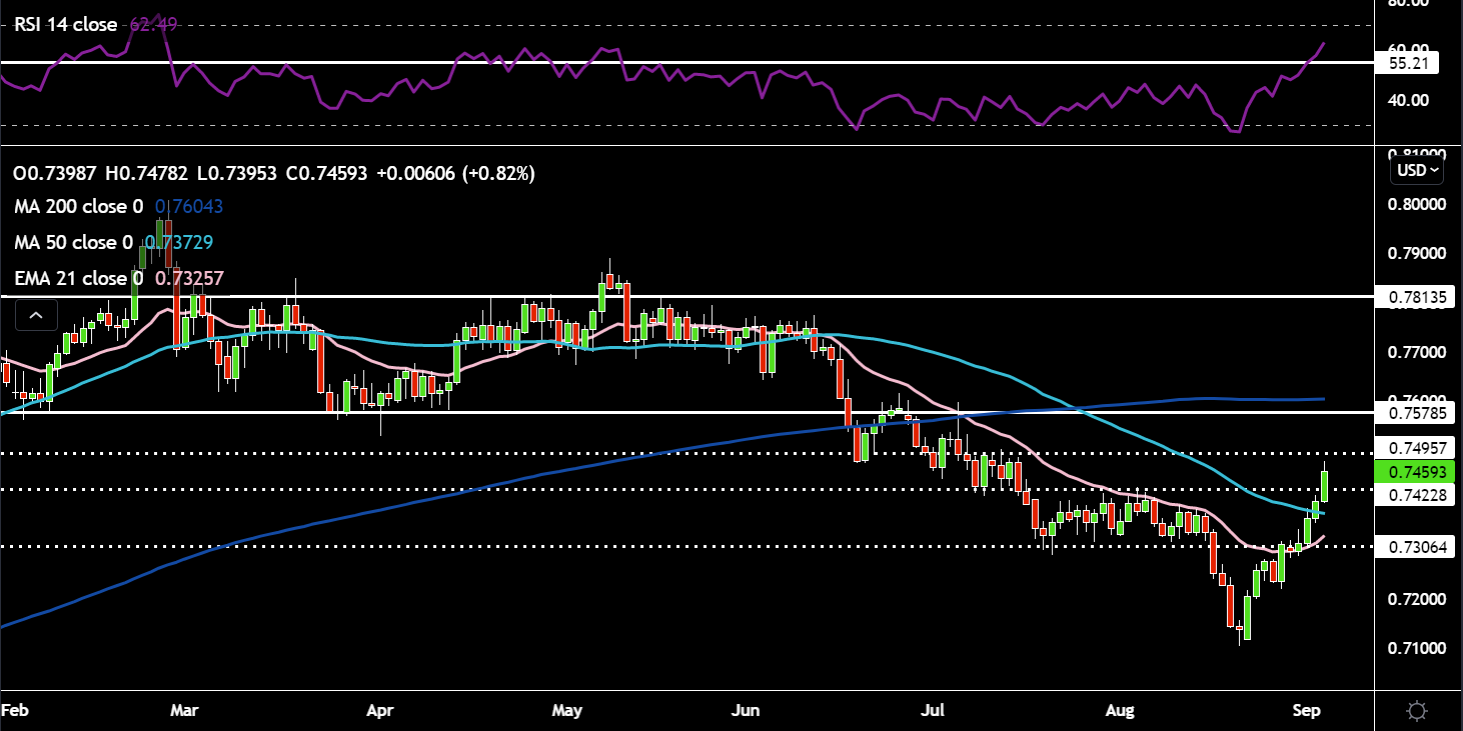
AUD is putting in some good upside pip moves and now finds itself above the 50-day SMA with the 21-day EMA curling upwards too. Price is also above the 0.74228 horizontal resistance. The RSI is racing above the 55 level. Targets wise, I like 0.75 on the upside and for a continuation of the uptrend 0.757-0.76 (200-day SMA). On the downside I'd see what price does around 0.7372 (50-day SMA) and the 0.73 support level.
Gold:
With US 10-year yields below where I think fair value is and inflation likely having hit its peak, real yields should move in a Northern direction of travel from here. However, that’s more of a medium term view. Today’s NFP report has put pressure. Real yields are a tad higher on the week, but the yellow metal has got help from the dollar weakness. Price has been rangebound prior to today as traders wait for the jobs release before taking a position.
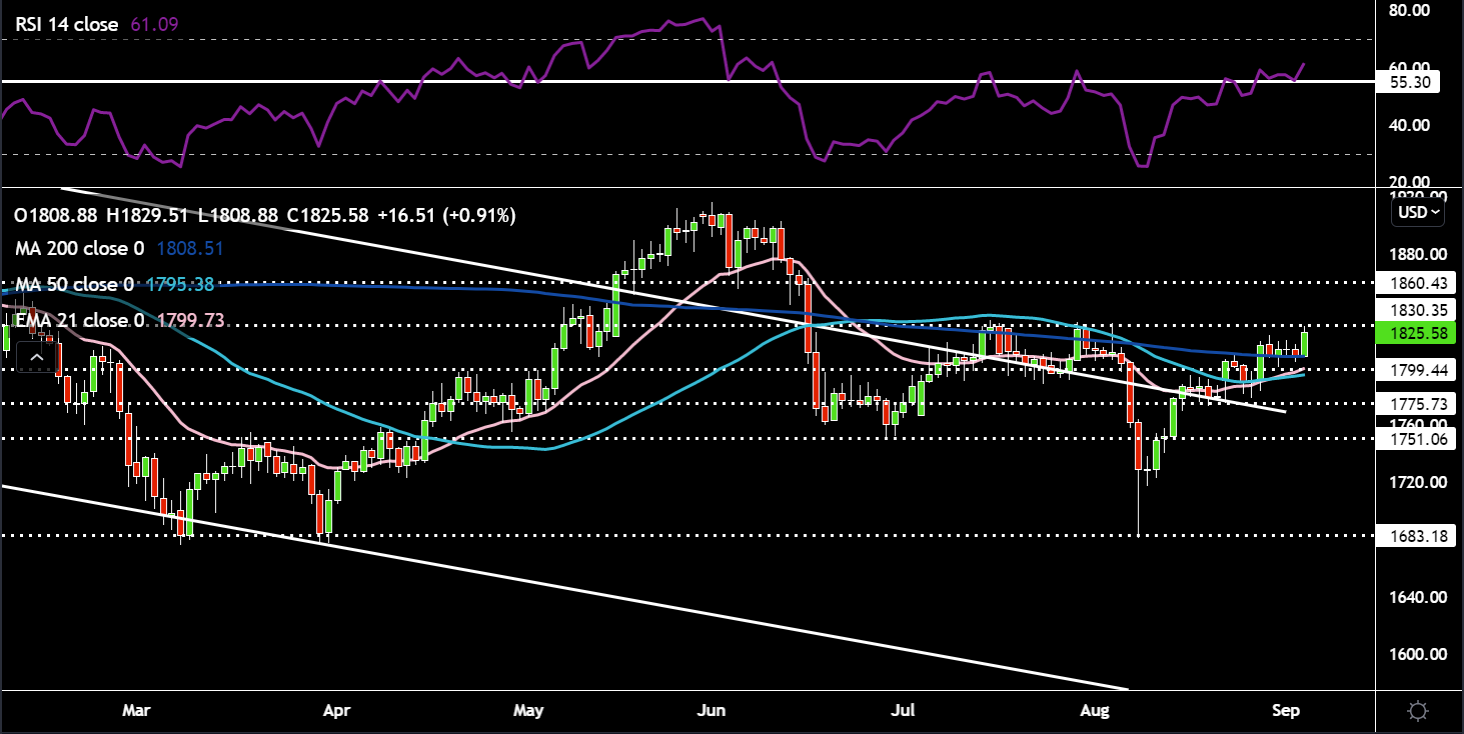
Gold is now a couple points above its 200-day SMA. The 50-day SMA has turned back upwards, which begs the question if we could see that death cross reversed. The RSI is above the 55 resistance level which marked previous tops. $1830 is key resistance as we saw a double top. Could we be setting up for a triple top? Beyond $1830 if gold gets its bullish shine back $1860 would be the next target on the upside. On the downside $1800 horizontal support with the 50-day SMA a tad below that would be important. Further below would bring the $1775 horizontal support into play as well as the upper trend line of the descending channel.
Oil:
Oil has been its usual volatile self this week with price sketching out a lovely v shape on the charts. Hurricane Ida led to circa 95% of production getting taken offline (roughly 1.74mln bpd). Price initially fell as traders believed supply could return before refining (which would mean more supply vs lower refining demand). Since Ida hit land, its ferocity has been downgraded to a Category 1 hurricane and is now less likely to influence oil markets. The OPEC+ meeting on Wednesday saw the status quo schedule of 400k bpd every month kept in place. The next time we’ll hear from the oil cartel is October 4. Oil popped higher on Thursday with the larger than expected drawdown in crude inventories – 7.2 mln vs 2.5 mln expected. Next week’s data will contain the distortions caused by Hurrican Ida. Talks between Iran and the US are still moving at a snail’s pace, allowing the market to not fret over any imminent additional supply.
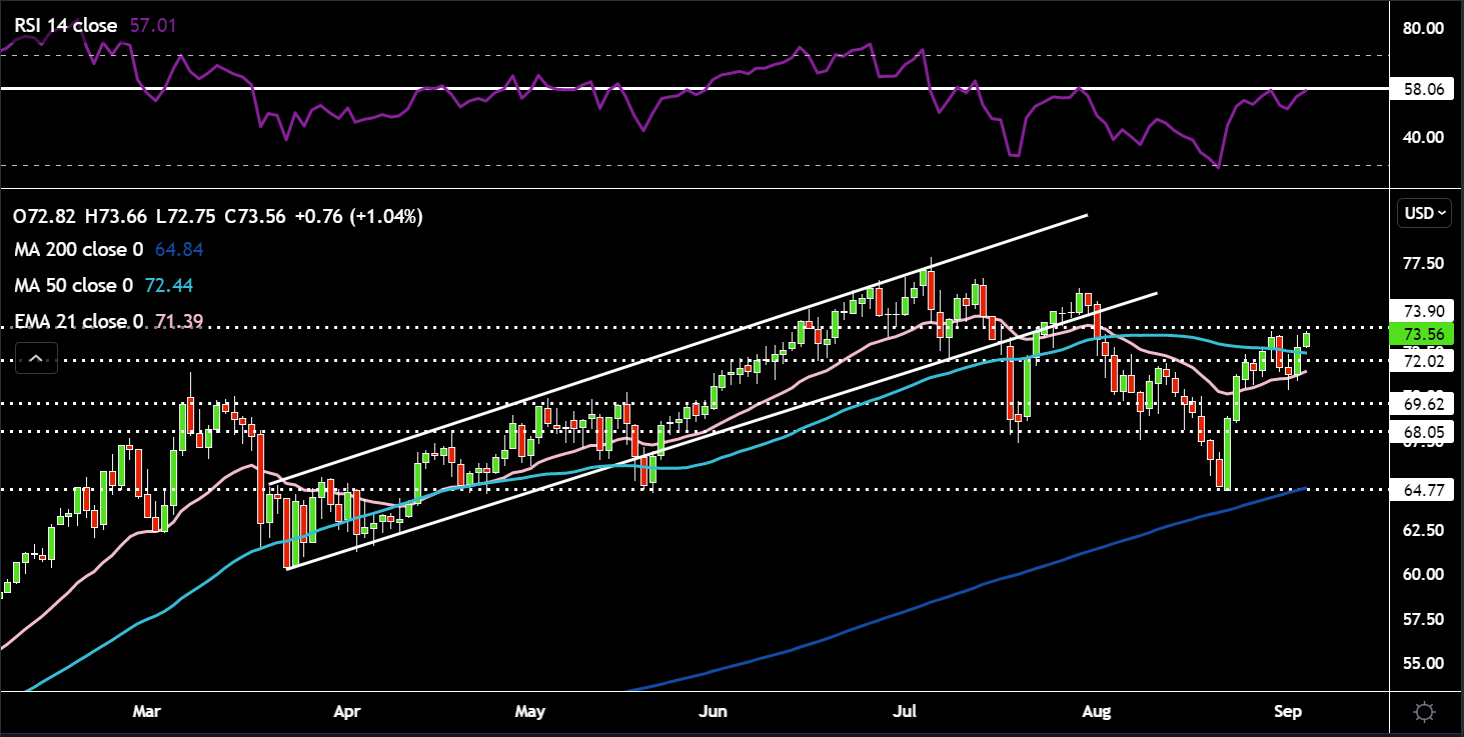
Price is just shy of $74. It has had a decent rally off the 21-day EMA support. Price is now back above its 50-day SMA. The RSI is back at the 58 resistance level, which marked previous price rallies. $74/75 would be my upside targets, beyond that the 6 July high of $77.82 would come into play. On the downside the 21-day EMA and $70 horizontal support would be key.
Ready to trade one of the many opportunities above? Start trading FX and commodities CFDs now
Related articles


The material provided here has not been prepared in accordance with legal requirements designed to promote the independence of investment research and as such is considered to be a marketing communication. Whilst it is not subject to any prohibition on dealing ahead of the dissemination of investment research we will not seek to take any advantage before providing it to our clients.
Pepperstone doesn’t represent that the material provided here is accurate, current or complete, and therefore shouldn’t be relied upon as such. The information, whether from a third party or not, isn’t to be considered as a recommendation; or an offer to buy or sell; or the solicitation of an offer to buy or sell any security, financial product or instrument; or to participate in any particular trading strategy. It does not take into account readers’ financial situation or investment objectives. We advise any readers of this content to seek their own advice. Without the approval of Pepperstone, reproduction or redistribution of this information isn’t permitted.