- English
- 简体中文
- 繁体中文
- ไทย
- Tiếng Việt
- Español
- Português
- لغة عربية
- English
- 简体中文
- 繁体中文
- ไทย
- Tiếng Việt
- Español
- Português
- لغة عربية
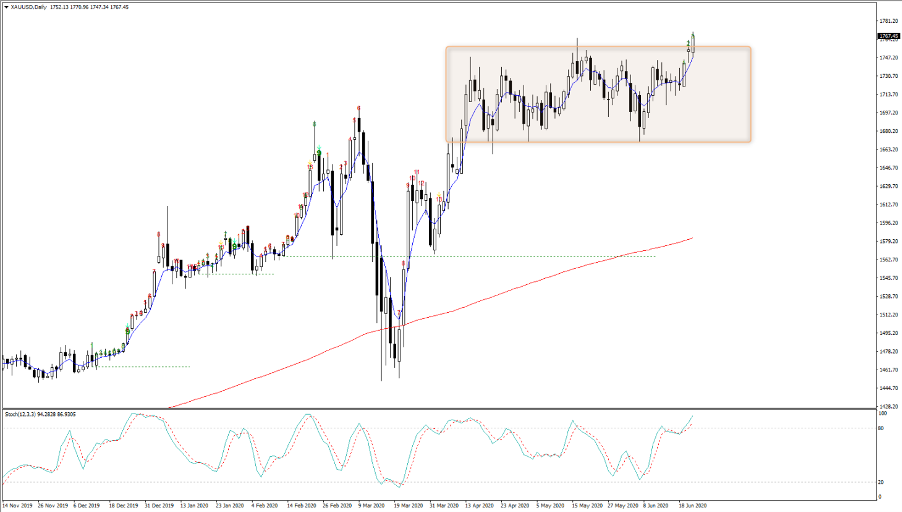
The Daily Fix: Gold finally breaks out with $1800 in its sights

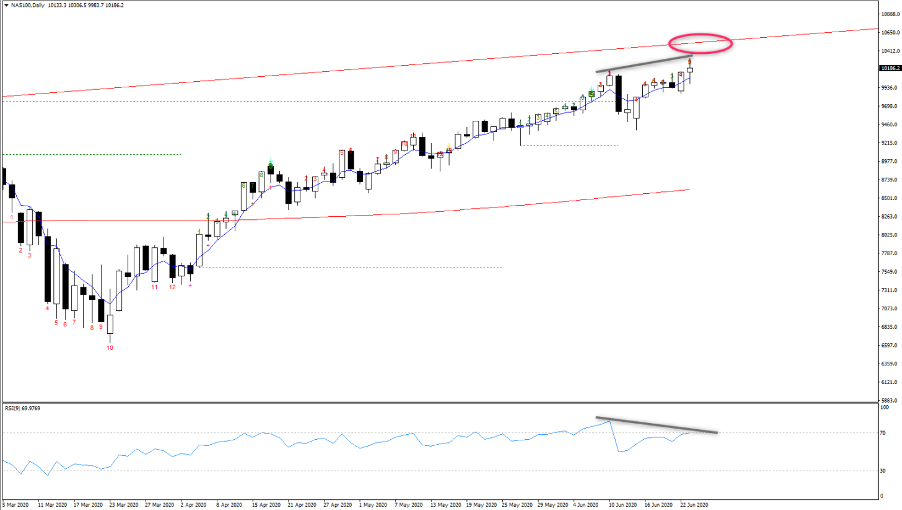
I have 10,500 (trend resistance and R3/pivot) as my upside target here, although there are signs of divergence between price and the 9-day RSI, which puts the index on alert for potential fatigue and modest reversal.
What is driving this the move in risk? Well news aside, positioning, systematic funds drip-feeding further capital into the market chasing the trend, and perhaps more from retail. As detailed in yesterday’s report (and video), the US bond market holds the clues and it’s the same reason why gold has broken out to the highest levels since 2012.
As a gold bull I would have liked to see WTI push through $41.15 (the March gap), and more of a bid in copper, which would have lifted inflation expectations (in the bond market) even higher. However, as it was, we still saw US 5- and 10-year ‘breakevens’ (a bond instrument portraying average inflation expectations over a period) up 3bp apiece. Again, we saw no movement in the US nominal bond yields through 2-year Treasuries to 10yr Treasuries (UST 30 did move up 3bp) - so once again we see ‘real’ (inflation-adjusted) yields moving deeper in negative territory.
Consider that gold is viewed by the market as a zero-coupon bond, so when real (or inflation-adjusted) US Treasury yields head lower, the relative attractiveness of gold increases. This chart tells the story of gold:
- Upper pane - we see gold (inverted) vs US 5yr real yields. For the stats heads out there, a 2-year regression shows the correlation coefficient between the two variables at 0.904. That being, 90% of the variance in gold can be explained by the inflation-adjusted US Treasury – i.e. it’s incredibly significant.
- Middle pane – the construct of real yield. We see 5-year inflation expectations moving higher, yet nominal bonds remain anchored. The perfect backdrop for gold, albeit, the absolute level of inflation expectations will in no way trouble the Fed.
- Lower pane – the total USD value of bonds (globally) that has a negative yield. While the correlation with gold comes and goes, if global bond yields head lower then gold will find buyers as a hedge against diminishing returns in fixed income.
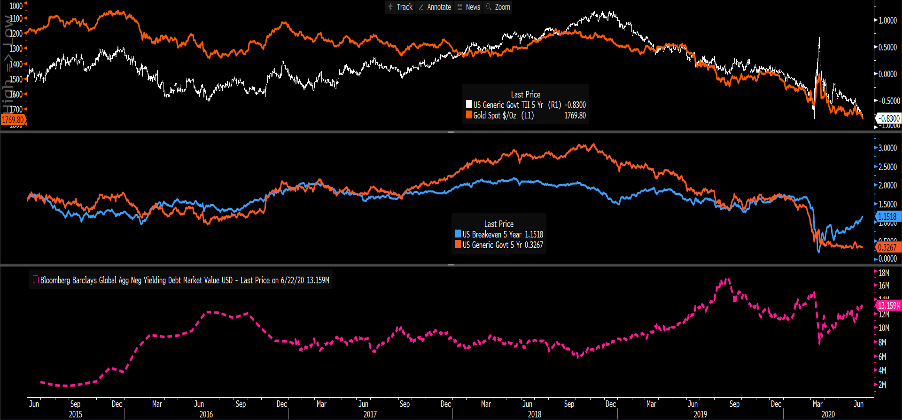
(Source: Bloomberg)
We can also marry the moves in the bond market with positive market semantics, which has caused the USD to weaken on a broad basis, with capital repatriated out of the USD. Lower real yields and USD weakness - That is a red rag to a gold bull and precious metals more broadly.
The currency effect is important because while you can trade gold in USD, EUR, GBP, CHF and AUD with Pepperstone, we naturally want to be long an underlying asset in the weakest currency (or conversely to be short in the strongest) - in this case it has been the USD. For perspective, the NOK was the strongest currency on the day, and gold priced in NOK is flat.
What I also like about the breakout in gold, is that outside of the ETF space, there are very signs of euphoria and gold is not over-loved. The obvious target now is 1796 - the October 2012 high, which preceded a 34% decline. Let us look at the evidence for this call.
Gold futures – as per the weekly CoT report, managed money holds 105,000 net long gold futures contracts. The blue line represents the average from 2006 (when the CFTC started to compile the data), where we see 1 & 2 standard deviation moves either side of the mean. As we see, gold is below the average.
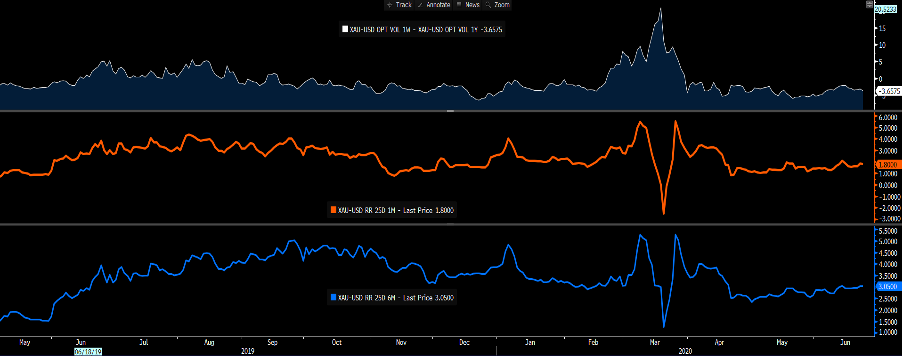
Sentiment in the options market
Upper pane – Gold 1-week (options) implied volatility minus 1-year implied vol. If traders were betting on a near-term impulsive rally, we’d see this spread moving markedly wider, with traders’ bigger buyers of ST volatility, just like we did in March.
Middle pane – Gold 1-month risk reversals (RR). RR take 25-delta call volatility and subtract put vol. The higher this premium the greater the demand for bullish options structure. So, we see call vol trading at 1.8 volatility premium to puts, which shows the market is bullish, but I’d be more concerned at euphoric conditions above 4. All very neutral.
Lower pane - Gold 6-month risk reversals. A similar set as above but using 6-month options.
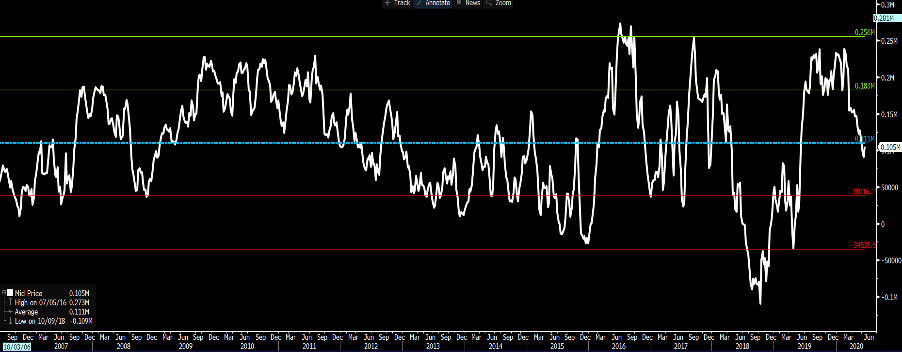
Gold ETF flows (GLD ETF) – this is where we can see some signs of euphoria, with the cumulative money flow moving progressively higher. The bulls will spin this that it shows the insatiable demand for gold, and naturally, we always want to follow flow.
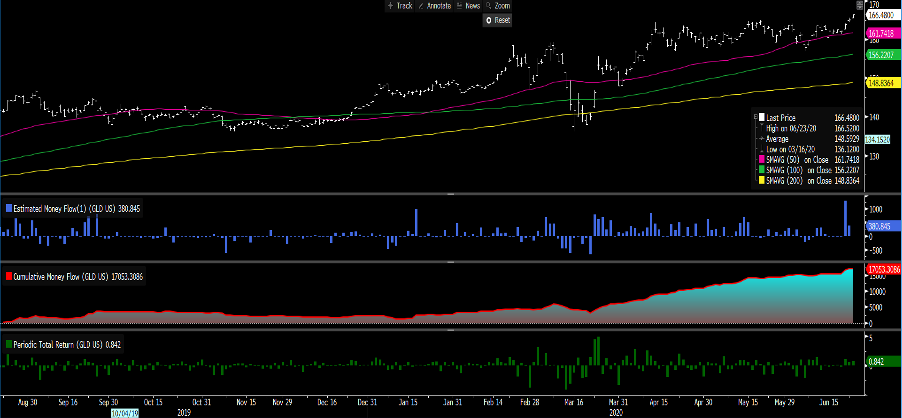
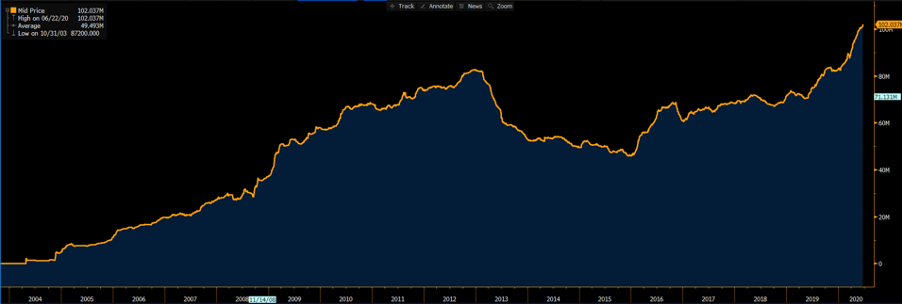
Holding in ETF funds – following on the GLD chart, we see record holdings in gold ETF funds. Expect this to only increase.
Conclusion
I continue to hold a constructive bias, but as always, it’s good to understand one’s risk and the potential catalysts for a reversal – it’s one function of managing risk. As I see it, the clear risk to gold is higher real yields and perversely a sell-off in equities, which causes USD strength. Until that time the path of least resistance is higher.
Related articles


Ready to trade?
It's quick and easy to get started. Apply in minutes with our simple application process.
The material provided here has not been prepared in accordance with legal requirements designed to promote the independence of investment research and as such is considered to be a marketing communication. Whilst it is not subject to any prohibition on dealing ahead of the dissemination of investment research we will not seek to take any advantage before providing it to our clients.
Pepperstone doesn’t represent that the material provided here is accurate, current or complete, and therefore shouldn’t be relied upon as such. The information, whether from a third party or not, isn’t to be considered as a recommendation; or an offer to buy or sell; or the solicitation of an offer to buy or sell any security, financial product or instrument; or to participate in any particular trading strategy. It does not take into account readers’ financial situation or investment objectives. We advise any readers of this content to seek their own advice. Without the approval of Pepperstone, reproduction or redistribution of this information isn’t permitted.