- English
- 简体中文
- 繁体中文
- ไทย
- Tiếng Việt
- Español
- Português
- لغة عربية
- English
- 简体中文
- 繁体中文
- ไทย
- Tiếng Việt
- Español
- Português
- لغة عربية
Analysis

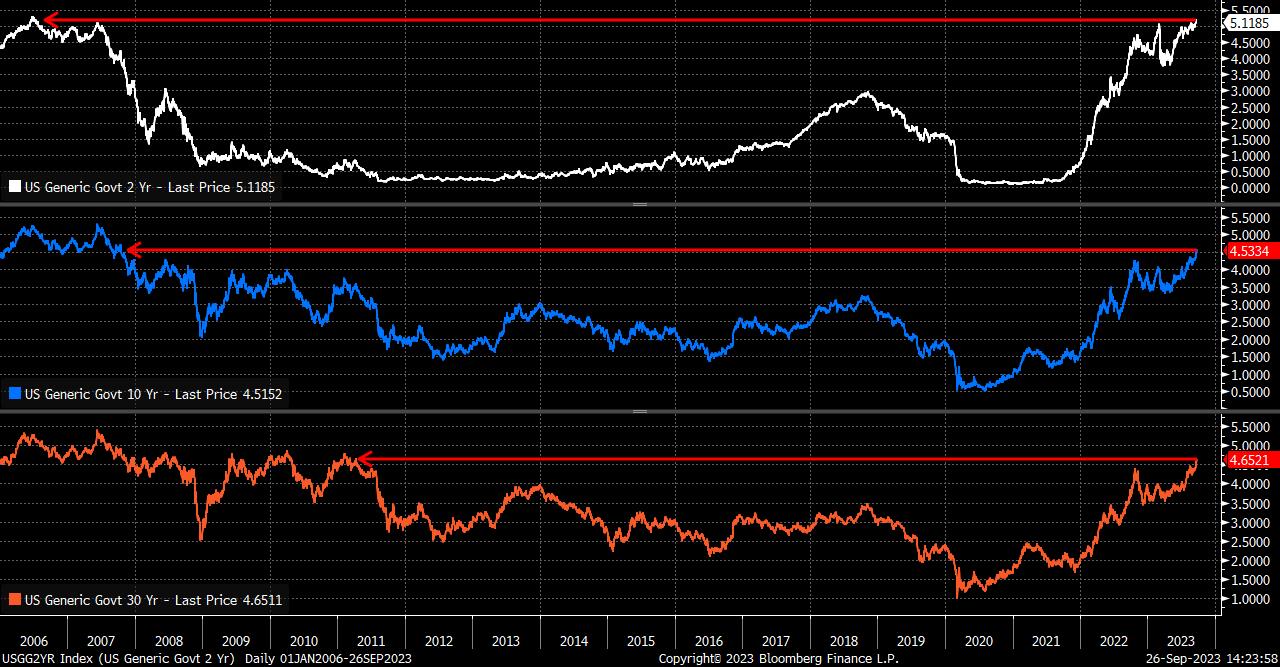
Treasuries – Epitomising ‘higher for longer’
Treasury yields have shot higher across the curve, which has bear steepened, over the last week, with almost every day marked by a headline (or three) heralding new cycle highs. Unsurprisingly, the Fed’s hawkish revision to the dot plot, pencilling in just 50bp of cuts next year (half the magnitude forecast in June), while leaving the door open to another hike before the end of the year, has been the primary catalyst for the move, as the ‘higher for longer’ policy stance appears, at long last, to have sunk into the market’s mind.
Unsurprisingly, with 2s at their highest yield since 2006, 10s their highest since 2007, and 30s their highest since 2011, the attraction of Treasuries over the longer-run is starting to markedly increase. This is amplified by the likelihood that the Fed have all-but-reached the terminal rate, and with US inflation looking to have decisively peaked, with relatively immaculate disinflation continuing. It may need, however, either a sharp weakening in economic growth – which seems unlikely for now – to decisively turn the tide against bond bears, particularly with a wave of supply continuing to engulf the market.
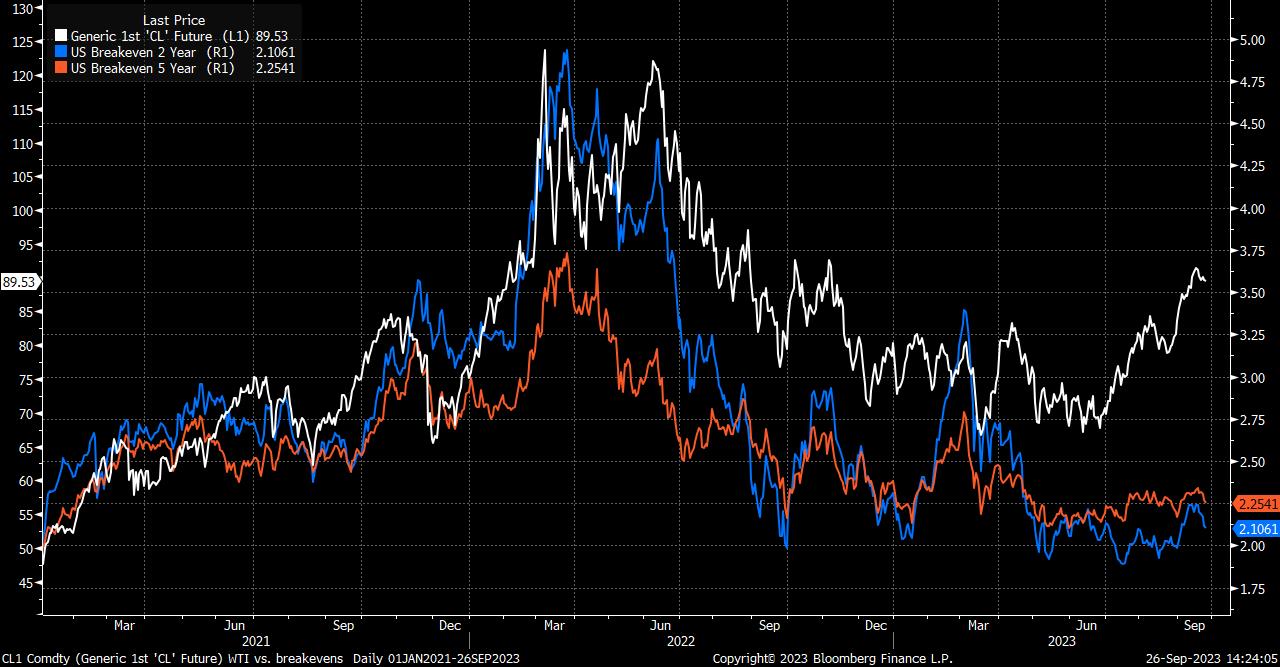
Crude – Not Yet An Inflationary Concern
Both Brent and WTI have come off the boil a little this week, with the former backing away from the cycle highs just above $95bbl, while the latter has dipped back under the psychologically key $90bbl handle. Nevertheless, despite paring gains, both blends of Crude remain around 30% above the lows seen during the summer.
Many may be concerned about, and have rightly flagged, the inflationary implications of such a rally, though the market is displaying few signs of concern about a sustained increase in price pressures just yet. Both 2- and 5-year US inflation breakevens remain well within the range traded all year at levels which are, broadly speaking, compatible with a return to central banks’ 2% inflation target. Policymakers are likely to remain similarly unperturbed by the recent surge in prices, given the tendency to focus on core and ‘supercore’ measures of inflation, to gauge underlying price pressures. Nevertheless, with both the technical and fundamental outlooks remaining bullish, and calls for $100bbl by year-end continuing to mount, markets may be unable to ignore oil forever.
Cable – Yield Spreads Point To Further Downside
The pound is, for the second year running, enduring a torrid September, in fact being set for its worst monthly performance since the turmoil in the aftermath of Liz Truss’ mini-budget 12 months ago. Cable has now fallen below its 200-day moving average for the first time since March, with spot trading to its lowest since the same month.
Further downside looks set to be on the cards, with a test of the 1.20 handle having something of an inevitable felling to it at this point, with the bearish factors mounting up for the GBP – slowing economic growth, softening consumer spending, a deteriorating services sector outlook, rising unemployment, and an upcoming remortgaging cliff. The Bank of England are also doing little to help the quid, having delivered a dovish surprise last week in maintaining Bank Rate at 5.25%, and strongly implying that terminal has now been reached, in contrast to the still-hawkish FOMC. This has sent gilts and Treasuries in opposite directions, the former rallying, and the latter slumping, taking the 10-year UK-US spread to its tightest since, you guessed it, March 2023, applying yet further downwards pressure on cable, and allowing the bears to retain the upper hand.
_gb_2023-09-26_14-24-09.jpg)
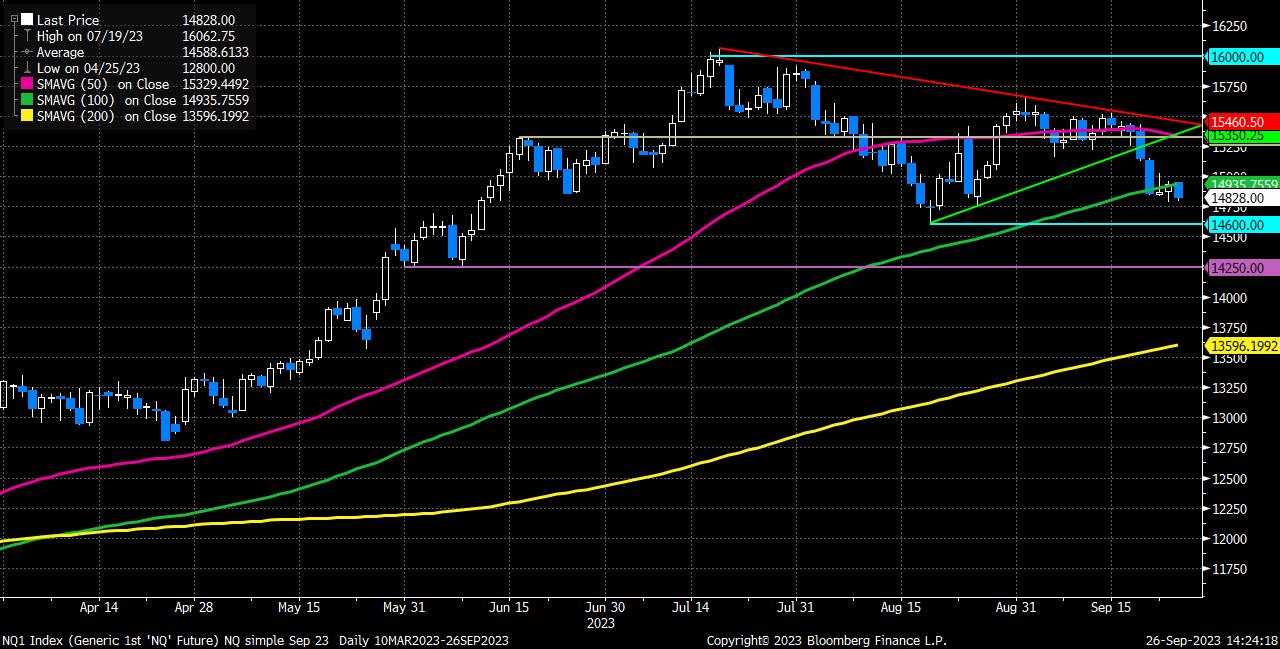
Nasdaq 100 – Under Pressure
As yields have risen, and the FOMC’s ‘higher for longer’ stance has finally sunk in, equities have come under pressure, with the tech sector – by proxy the Nasdaq – bearing the brunt of the market’s ire.
Having spent most of early-September consolidating in a tight range around 15,300, price has now decisively broken to the downside, breaking beneath the ascending trendline in place over the summer, and closing below the 100-day moving average for the first time since January. The bears have decisively wrestled control of proceedings here, though the index has consolidated around 14,800 since the new trading week has got underway. To the downside, 14,600 stands out as the most significant near-term support, being the August low, below which the bears may look to the May/June lows at 14,250 as the next target. Selling into strength seems the preferred strategy for now, unless the index can reclaim the 100-day moving average on a closing basis.
USD/CHF – Divergence At Play
The Swissie is perhaps the best display of the divergences driving the G10 FX market at the moment, with vast growth and policy divergences between each side of the pair.
On the growth side, the US economy continues to impress, growing at an annualised pace north of 2% in Q2, with recent PMIs pointing to a moderating, but still solid pace of GDP growth in the third quarter. In contrast, the Swiss economy unexpectedly stagnated last quarter, and continues to face significant downside risks as a spillover from the woes seen in the eurozone, and continued lack of recovery in China. Meanwhile, from a policy standpoint, the FOMC’s hawkish stance has been outlined above, while the Swiss National Bank unexpectedly kept rates on hold last week, and appear to have reached the end of the tightening cycle.
This has all sent USD/CHF back above the 200-day moving average, for the first time since last November, while having also closed above the psychologically important 0.9100 handle, and the 61.8% retracement of the decline in the early part of the year. The bulls are in control here, targeting the mid-0.92s, with dips likely to be strongly bought above the aforementioned 200dma.
_us_2023-09-26_14-24-22.jpg)
Related articles


The material provided here has not been prepared in accordance with legal requirements designed to promote the independence of investment research and as such is considered to be a marketing communication. Whilst it is not subject to any prohibition on dealing ahead of the dissemination of investment research we will not seek to take any advantage before providing it to our clients.
Pepperstone doesn’t represent that the material provided here is accurate, current or complete, and therefore shouldn’t be relied upon as such. The information, whether from a third party or not, isn’t to be considered as a recommendation; or an offer to buy or sell; or the solicitation of an offer to buy or sell any security, financial product or instrument; or to participate in any particular trading strategy. It does not take into account readers’ financial situation or investment objectives. We advise any readers of this content to seek their own advice. Without the approval of Pepperstone, reproduction or redistribution of this information isn’t permitted.