- English
- 简体中文
- 繁体中文
- ไทย
- Tiếng Việt
- Español
- Português
- لغة عربية
- English
- 简体中文
- 繁体中文
- ไทย
- Tiếng Việt
- Español
- Português
- لغة عربية
Analysis
.jpg?height=93&quality=100)
The euro can’t seem to find any friends at the moment, succumbing to selling pressure against the dollar and pound. Not even hawkish remarks from Weidmann about the ECB having to tighten policy in order to counter inflation could stem the weakness. Heaping on the bearish factors was the ZEW Economic Sentiment Index which missed on the current conditions and standard reading too. We’ve got the final reading of July inflation data for Germany out tomorrow and UK Q2 GDP (which if really impresses) could add to the negative sentiment currently playing out in EURGBP. For EURUSD, a solid inflation print out of the US could raise tapering expectations putting further pressure on the cross. Let’s take a look at the charts now for potential tradeable opportunities.
EURUSD:
EURUSD has been on a strong descent post the NFP report as price was capped by the 21-day EMA and 1.185 horizontal resistance. The RSI peaked at key resistance around 52 and has now fallen quite substantially, bringing oversold conditions into view. The death cross divergence is widening further. My first target lower would be 1.17 (around the March 31 lows), below that the October and November 2020 double bottom lows around 1.16 would be the next pivotal level. On the upside monitor 1.18 and 1.185 (21-day EMA and horizontal resistance).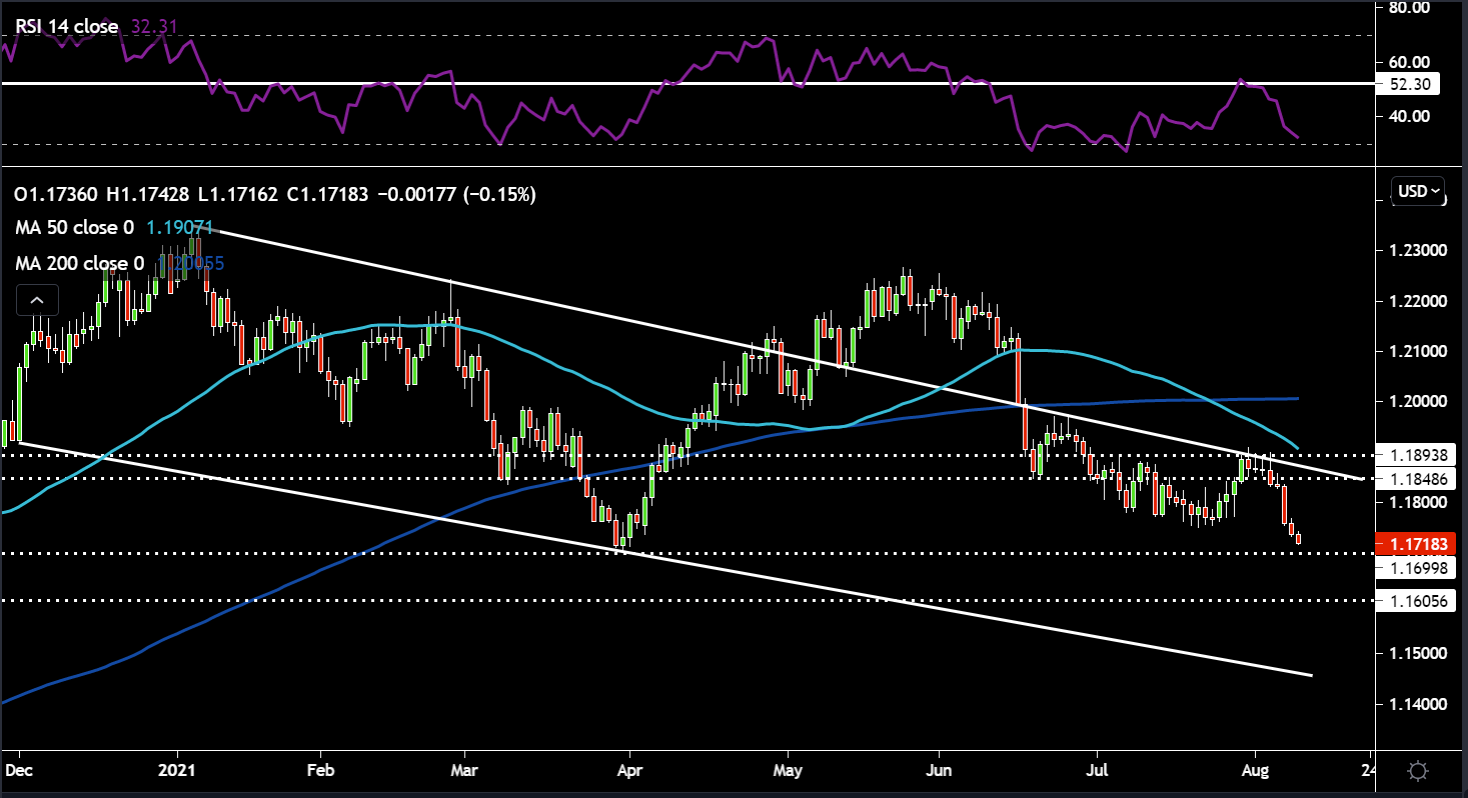
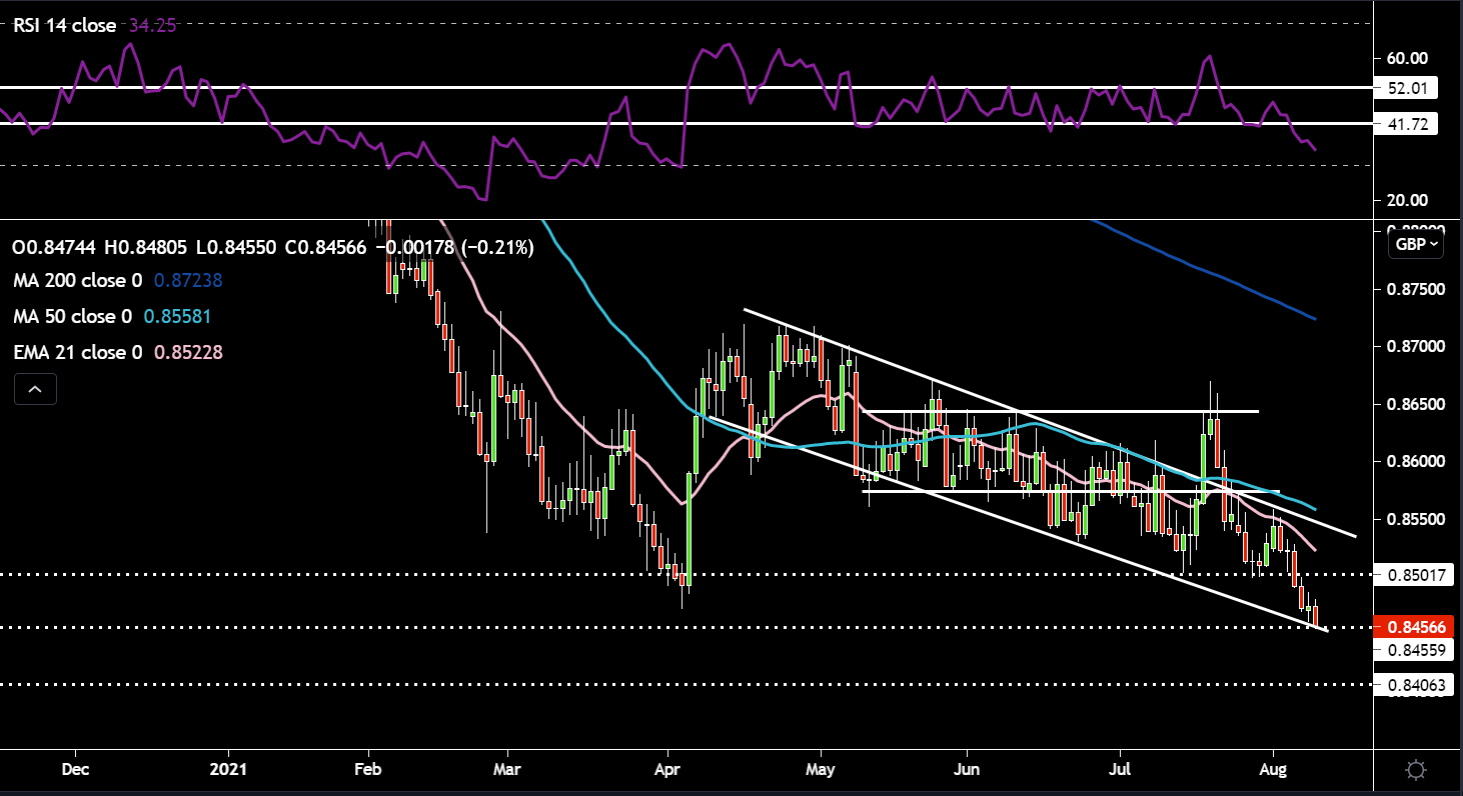
EURGBP:
EURGBP continues to push lower, now taking out the 5 April 2021 low of 0.847. Price is right on the lower trend line of the descending channel as well as horizontal support around 0.845. A breach of this would see us head towards 0.84 and from there the December 2019 and February 2020 lows of 0.83 would be on the scoreboard. The RSI is steadily declining on its way to oversold territory. On upside rallies I’d ben looking at shorting opportunities – using the 21-day EMA and resistance levels as guides. 0.85 and 0.855 are potential zones with some uplift of the RSI.
The material provided here has not been prepared in accordance with legal requirements designed to promote the independence of investment research and as such is considered to be a marketing communication. Whilst it is not subject to any prohibition on dealing ahead of the dissemination of investment research we will not seek to take any advantage before providing it to our clients.
Pepperstone doesn’t represent that the material provided here is accurate, current or complete, and therefore shouldn’t be relied upon as such. The information, whether from a third party or not, isn’t to be considered as a recommendation; or an offer to buy or sell; or the solicitation of an offer to buy or sell any security, financial product or instrument; or to participate in any particular trading strategy. It does not take into account readers’ financial situation or investment objectives. We advise any readers of this content to seek their own advice. Without the approval of Pepperstone, reproduction or redistribution of this information isn’t permitted.