- English
- 简体中文
- 繁体中文
- ไทย
- Tiếng Việt
- Español
- Português
- لغة عربية
- English
- 简体中文
- 繁体中文
- ไทย
- Tiếng Việt
- Español
- Português
- لغة عربية
Analysis
The Daily Fix: Economic and solvency matter - what to watch this week

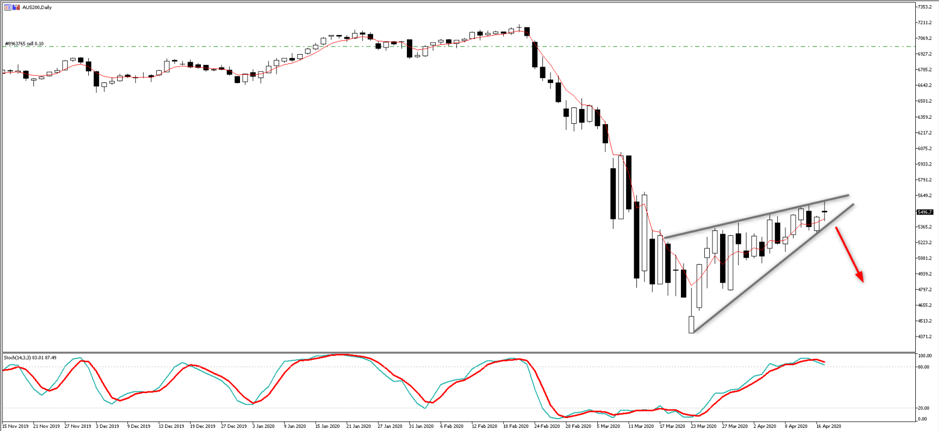
Keep an eye on the ASX 200 as price action is certainly looking less favourable for bullish upside and after a solid run, we’re seeing the daily ranges contract and indecision to push price higher. A rising wedge in the mix for the pattern traders out there, married with a stochastic shift in momentum.
Can the Aussie market lead a potential reversal?
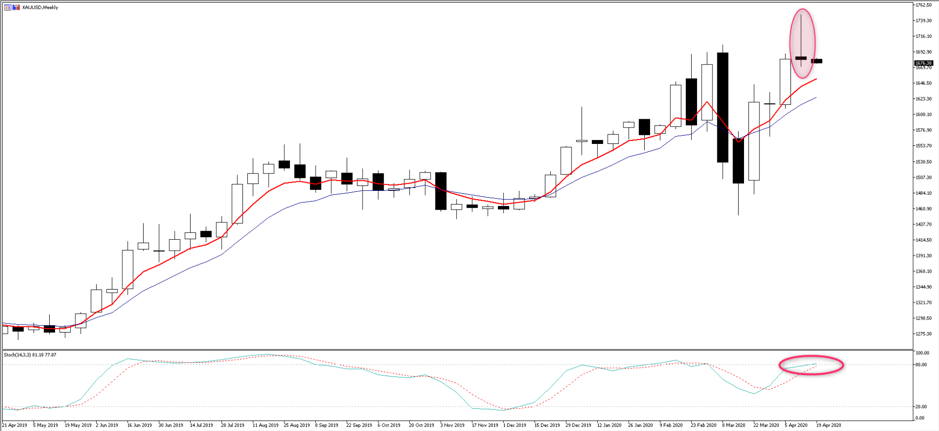
So, one to put on the radar, even if the lead from Wall Street continues to be positive, with the S&P 500 closing +2.7% and the Russell 2000 +4.3%. despite a 2% closing decline in June crude. US equity indices aside, we saw a largely unchanged move across the US Treasury curve, while breakevens (inflation expectations) fell 4bp, resulting in 5- and 10-year ‘real’ yields gaining 4 and 5bp respectively. Gold was hit hard, with a downside move of 2% and the weekly chart closed with a rather ominous looking candle, with spot -0.3% on open today. One to watch for a kick lower that may resonate with price action traders, even if the fundamentals for gold are solid and perhaps the Fed announcing it was halving the daily pace of bond-buying to $15b is playing into the move – recall, this is one-fifth of the initial size of Fed asset purchases.
Gold bulls will say $15b is still a huge number and ultimately the Fed’s balance sheet has moved to $6.36t, taking excess reserves to $2.64t and these actions should support gold.
Copper is 0.2% lower on open, after gaining 2.2% on Friday and is another that hasn’t gone unnoticed and the daily shows how ‘The Doc’ is at a very delicate stage in the run. I am compelled to sell this move, especially when you look at the 20-year chart and how price is pushing on the former trend.
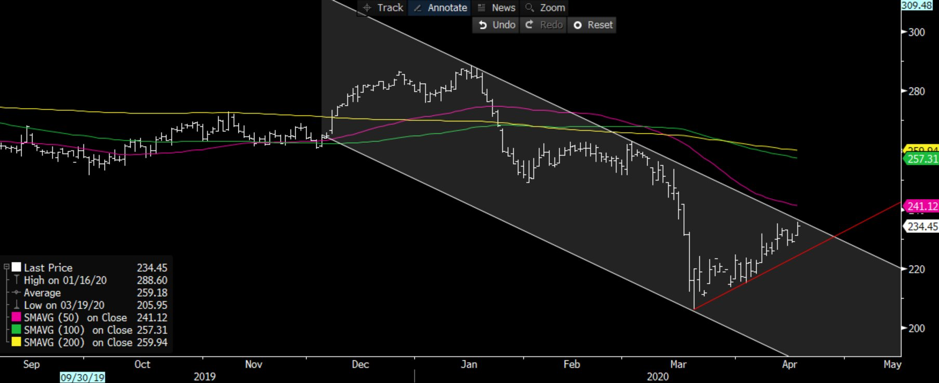
Is copper just following the S&P 500 or did the market price in too much bad news for 2020/21?
Personally, I fail to see economics lifting the fortunes of the metal and I know many are looking at 2021 and suggesting better times are ahead. However, we are coming into the eye of the storm and as the market starts to focus less on virus headlines, or at least will be less sensitive to better news, we will focus more on the lasting effects on the economy and solvency.
There is little doubt that last week saw an accelerant in the debate around the disconnect between the financial markets and the real economy. Awful Chinese Q1 GDP, US retail sales, NY manufacturing, and Aussie business and consumer confidence – to name a few – and this week that view will be pushed further with traders eyeing German ZEW, EU consumer confidence, EU PMI’s, weekly US jobless claims and German IFO.
That’s ahead of US ISM and NFP’s on 2 and 8 May respectively, where I am already seeing calls for as many as 28 million job losses in April.
It's hard not to think this week’s data will be ugly though, and with so much data out of Europe this week, it's fitting that we also get a Eurozone Head of State meeting (23 April). Expectations for this meeting to be a volatility event are low, with a focus on near-term clues around debt mutualisation. There is also speculation (source: FT) that the ECB is pushing for a so-called bad bank, which would ring-fence the bad loans on the balance sheets of EU banks. Whether this gets much airplay at this meeting is yet to be seen, but with the EU Stoxx bank index at such precarious levels, it is something EUR traders will be keen to watch.
As will be the case for Italian debt, with a new fiscal stimulus expected from the Italian govt, and narrative from the credit rating agencies, with S&P and Moody’s due to review on Friday and 8 May respectively. Few expect a sovereign ratings downgrade at this juncture, but any widening of the BTP-German bund yield spread could weigh on the EUR.
Trading the EUR this week
Trading the EUR will be interesting this week then, especially when taken into context of the debate being had as to where to for the USD. Funding markets aside, you still pay carry to be short the USD and that often gets overlooked.
Options markets often give good insight, and I see EURUSD 1-week risk reversals (1-week call volatility minus 1 week put vol) headed into -0.84. This shows a slight increase in put vol buying, which offers sentiment that traders are seeing modest downside risks. 1-month RR sit at -0.94 and shows a rising belief in downside potential. Spot EURUSD has found sellers into the 20-day MA and the bears need EURUSD to clear 1.0816 for a test of the 1.0766 swing. It’s a tough pair to trade now, and EURCHF is perhaps the cleaner trade – that is, if bearish EU assets.
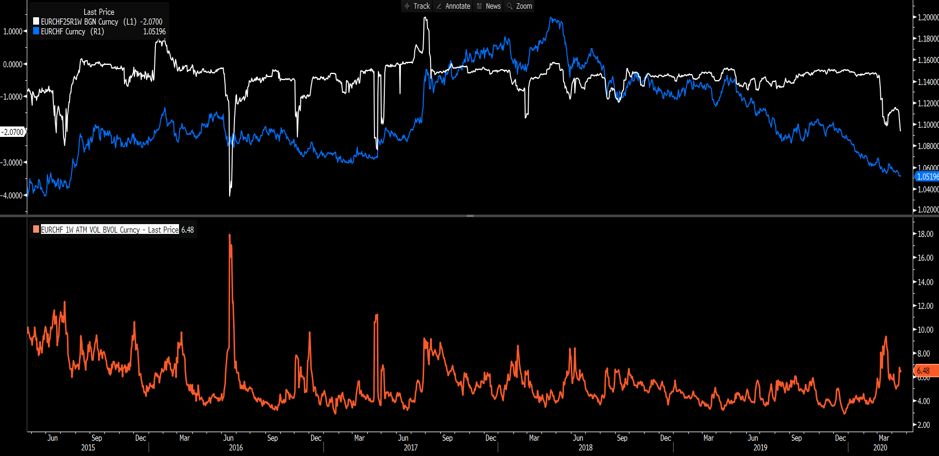
Certainly, we’re seeing that in risk reversals (white line), where options traders are big relative buyers of EURCHF downside volatility. The moves in spot into the low 1.05 shows the momentum here and options traders are betting on greater downside…the question is whether this is too much of a consensus trade. Price will tell, of course, although I have no position at this stage, but a number of savvy traders have told me they are expecting a bullish reversal this week.
The material provided here has not been prepared in accordance with legal requirements designed to promote the independence of investment research and as such is considered to be a marketing communication. Whilst it is not subject to any prohibition on dealing ahead of the dissemination of investment research we will not seek to take any advantage before providing it to our clients.
Pepperstone doesn’t represent that the material provided here is accurate, current or complete, and therefore shouldn’t be relied upon as such. The information, whether from a third party or not, isn’t to be considered as a recommendation; or an offer to buy or sell; or the solicitation of an offer to buy or sell any security, financial product or instrument; or to participate in any particular trading strategy. It does not take into account readers’ financial situation or investment objectives. We advise any readers of this content to seek their own advice. Without the approval of Pepperstone, reproduction or redistribution of this information isn’t permitted.