- English
- 简体中文
- 繁体中文
- ไทย
- Tiếng Việt
- Español
- Português
- لغة عربية
The Daily Fix: Gold, crude and the liquidity vs earning dynamic
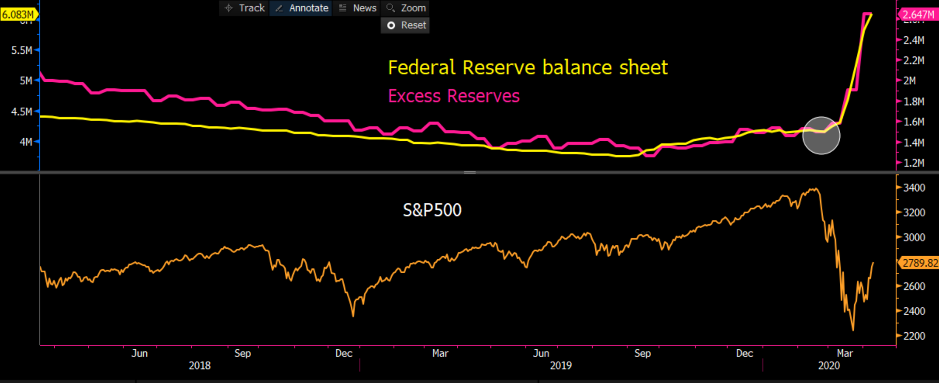
The Fed is now working with the US Treasury department, not just to buy investment-grade credit, but now recently downgraded corporate debt (that fell to junk status) and high yield ETFs. We all know the backdrop out there is an economic and health problem, and OK the Fed created the backdrop that resulted in the 35% sell-off in the S&P500 (in 23 days). But they also know that they can’t let the financial markets now become the problem.
The Fed is suppressing volatility (again) and is trying to do their ‘whatever it takes’ moment. Of course, it doesn’t solve economics and it doesn’t solve the health crisis – but it does buy time and it allows a more efficient functioning marketplace. This takes me to my offset - Earnings are too high: the question is whether they will actually matter in this environment of incredible central bank action. Surely, Q1 will be poor and overlooked. Q2 will be awful, and likely some -20% YoY, but with FY20 EPS now at $142, if the likes of Goldman’s and Bank of America are indeed correct with their call and EPS is downgraded to $110, on today’s price, it puts the S&P500 on 25x forward earnings and in this economic climate that is dot.com era multiples.
Some say 2020 is a write-off and to look at 2021, but consensus numbers here seem too high as well and also due to be heavily downgraded. We ask how far liquidity can go? Well, with economics about to start really starting to deteriorate from here (watch China’s Q1 GDP on Friday with consensus at -6% in Q1). It still feels like there is modest further upside to the US and global equities, but if the S&P500 is my guide then I’d expect price to be capped into 2934/2909, where we have the 50- and 20-day MA and 61.8% fibo of the 35% sell-off. That said, we’re seeing S&P500 futures now -1.4% and maybe that’s is indeed telling us a message.
Is the price war really over?
Oil is a must-watch today, where we finally saw the agreement to cut 9.7mbd of output from OPEC and more from Russia, US and others. We’ve seen crude open strongly out of the gates this morning, but it doesn’t feel like anyone is buying this as a lasting solution though, and a 5% rally in Brent crude is hardly emphatic – I guess this is Easter Monday liquidity at play here. But given demand is going to get slammed into Q2 and this output cut is needed, and anyhow, inventories will build in the coming months and enforcement of output levels takes hold. Markets will feed off the unity though and the idea that the price war has abated…for now.
Gold looking attractive
Gold and precious metals have come firmly back on the radar as the yellow metal gained 2.2% last week, although this was partly a USD move, as gold priced in AUD and some of the higher beta currencies had a poor showing. We’ve seen gold find small sellers on open today, but I feel pullbacks are buying opportunity.

"Source: Bloomberg"
Gold is a hedge against the madness and the experimental actions from the central bank world. It is a hedge against falling real yields, which have partly been driven by rising inflation expectations. It is a hedge against the debasing of fiat currency. The technical set-up is most compelling, where we can choose any time frame and it suggests the balance of probability is for higher prices. I know, we in CFD land don’t look at monthly charts but have a look at the gold monthly chart and you’ll see the rejection of $1670 area (in the prior two months) has given way.
I look at excess reserves, in the US, Europe, Australia and Japan (I can go on), and immediately think of positioning and sentiment reading. On the key metrics I look, they are not stretched. Managed money in the weekly commitment of trader’s report is high, but I am not too concerned here. If I look at 1-month 25-delta risk reversals, they sit a 2.66 vols (that being call volatility trades at a 2.66 vol premium to puts) and that is not stretched by any means. I look at gold futures and they have broken out and held the BO highs. A higher oil price helps, not only with higher inflation expectations but gold is a capital-intensive commodity to mine and you often see gold reflecting the cost to produce.
The other consideration is whether equity traders are now buying equity index futures, or stocks and buying gold as a hedge – a barbell strategy. Makes sense if its liquidity that is driving the capital markets.
The material provided here has not been prepared in accordance with legal requirements designed to promote the independence of investment research and as such is considered to be a marketing communication. Whilst it is not subject to any prohibition on dealing ahead of the dissemination of investment research we will not seek to take any advantage before providing it to our clients.
Pepperstone doesn’t represent that the material provided here is accurate, current or complete, and therefore shouldn’t be relied upon as such. The information, whether from a third party or not, isn’t to be considered as a recommendation; or an offer to buy or sell; or the solicitation of an offer to buy or sell any security, financial product or instrument; or to participate in any particular trading strategy. It does not take into account readers’ financial situation or investment objectives. We advise any readers of this content to seek their own advice. Without the approval of Pepperstone, reproduction or redistribution of this information isn’t permitted.