- English
- 简体中文
- 繁体中文
- ไทย
- Tiếng Việt
- Español
- Português
- لغة عربية
- English
- 简体中文
- 繁体中文
- ไทย
- Tiếng Việt
- Español
- Português
- لغة عربية
.jpg?height=93&quality=100)
USD:
The dollar has been under pressure this week and bulls would have been getting a tad nervous as price slid below the 200-day SMA. There’s a couple factors at play here. The US economic outperformance narrative is now pervasive and has definitely been priced in, in essence it’s priced for perfection. Where the disappointment or jitters may have started to creep in is when Yellen announced her $2.5 trillion Tax plan being announced and how that may dent US growth prospects. The other significant event was the dovish Fed minutes which delivered no surprises, with the committee reiterating a very accommodative stance with no need to tighten policy anytime soon. I think the recent bid into the US 5-year and modest unwinding of interest hikes seen in the Eurodollar December 2022 futures contract is more of a temporary move as opposed to a change in narrative of the market aligning their view with the Fed on rate hikes. However, though it may be temporary the more negative real yield has weighed on the dollar this week. The vaccine rollout continues to impress and should help keep the dollar outperformance narrative alive. Short covering has been substantial and that tailwind for the dollar is practically over. Lastly, given the dollar tends to attract safe-haven flows could an escalation in geopolitical tensions between China and Taiwan as well as Russia and Ukraine spill over into flows that benefit the dollar? The US is considering sending warships to the Black Sea according to CNN. PPI data just released, strongly beat expectations, this on top of strong China numbers too.
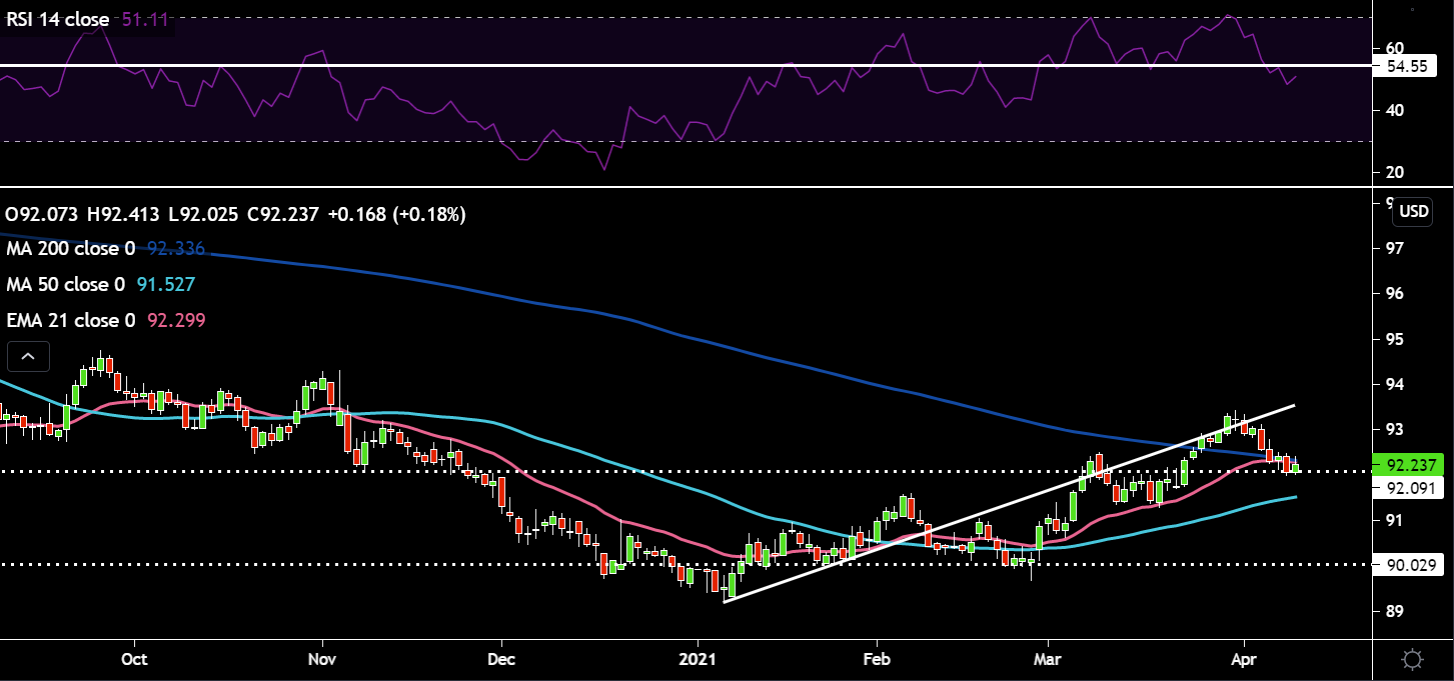
The technicals don’t provide a clear picture on the greenback’s next direction of travel. Bears and Bulls will be watching where price closes into the weekend – below or above the 200-day SMA. Price is right on the horizontal support of 92 and is just below the 21-day EMA and 200-day SMA. The RSI moved lower from overbought territory and has ominously dropped below the 54 support which held on prior price dips. If price can continue its ascent upwards we could see the 50-day SMA cross above the 200-day SMA (golden cross – bullish). 92.5 and the prior high of 93.437 come back into play if this was to play out. On a deeper pullback I’d keep an eye on the 50-day SMA for support at 91.5.
EURUSD:
The euro has been pushing higher this week, I put this down to some positivity around an expected improvement in the vaccine rollout as the Commission projects the bloc will hit immunization targets earlier. However, you’d be forgiven for being sceptical given the EU’s track record of delivering on important projects in a timely manner. The recovery fund has still not been approved and is currently being held up in the German Constitutional Court. Germany has secured Russia’s sputnik vaccine, however, there are fears the European Medical regulator will take its time for approval. More positive news came out that Italy is set to ease lockdown restrictions in most of the country.
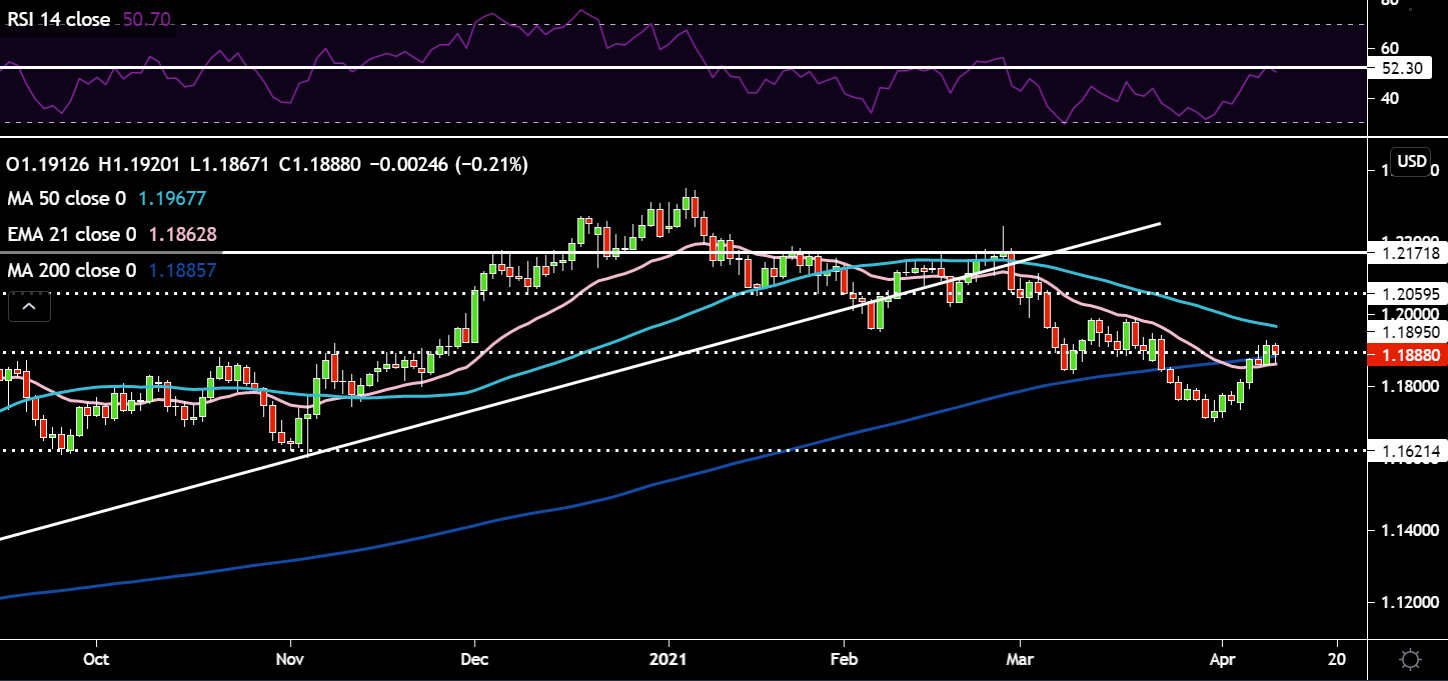
Technically speaking, the EURUSD bounced right off its 38.2% Fibonacci level and stormed higher slicing through the 21-day EMA and 200-day SMA. Some high altitude sickness seems to have set in as price peaks its head ever so slightly above the 200-day SMA and 1.19 resistance level. Interestingly, the RSI has rolled over right at the 52 resistance. If price turns lower we could see a death cross as the 50-day SMA crosses below the 200-day SMA. The next weeks will be key for this cross.
GBPUSD:
The pound has found no love this week as investors got jittery about blood clot concerns relating to the AstraZeneca vaccine (which the UK is quite heavily reliant on) and how this could slowdown the reopening of the economy. UK medical regulators also have now recommended that under-30s use an alternative vaccine. However, this looks to be overblown as the UK government health advisors reiterated that its plan to vaccinate all adults by the end of July is still on track. I think more of the weakness in cable came from cross flows in EURGBP. On the positioning front, GBP boasts the title of the largest net speculators long according to CFTC data, this can lead to fast/hot money unwinding their positions and accelerating a downside move. On a seasonality basis, April does tend to be a strong month for Sterling, so we will have to see if this year continues that trend.
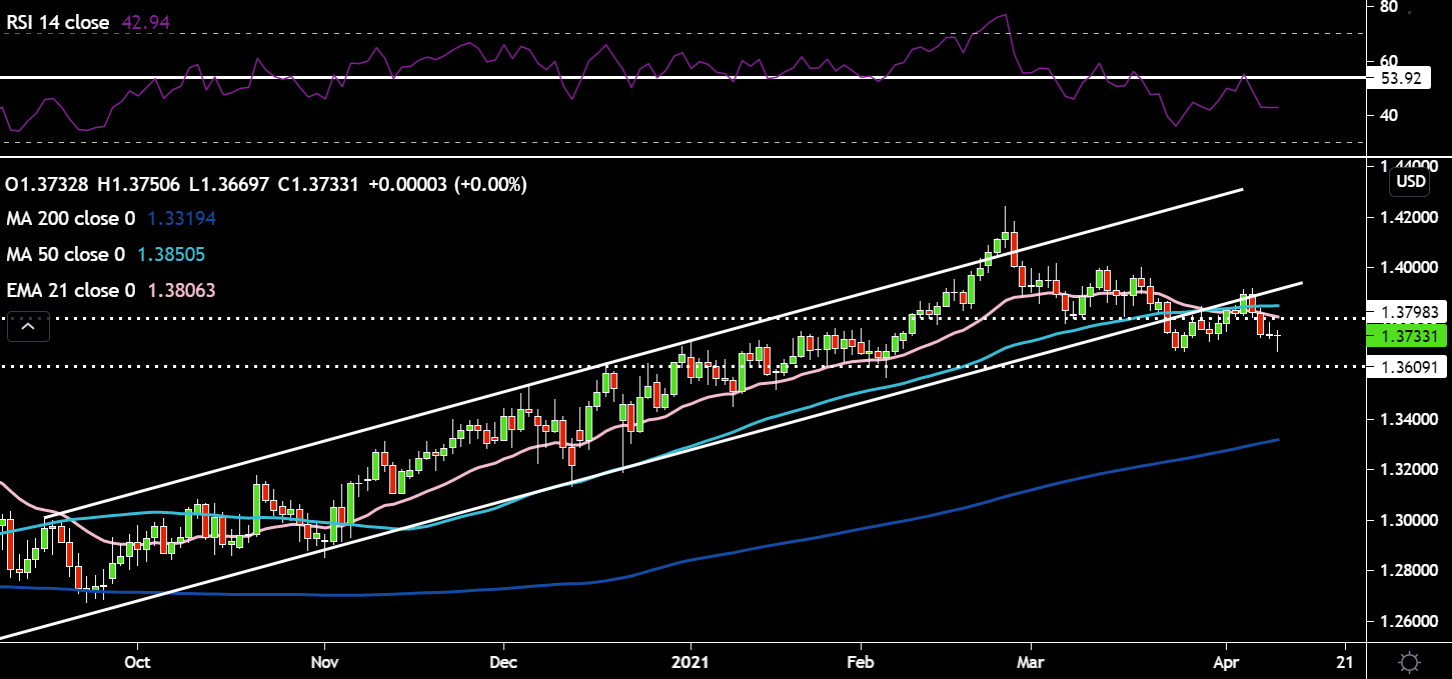
Cable broke through key support – lower line of ascending channel, 1.38 support level, 50-day SMA and 21-day EMA. Price looked like it could take out 1.367 March 21 low, but buyers have come back in and pushed price higher into the weekend. It looks like a mini double bottom could be forming on Cable (bullish pattern). The RSI has also made some negative divergence, indicating selling momentum was weaker on this push lower. However, I’d like to see the RSI back above 53 and in the ascending channel to feel more confident on longs. The next big event risk for the pound is the Scottish Elections on May 6.
USDJPY:
This week’s consolidation in the US 10-year yield has helped the Yen see some buying flows. However, I think this consolidation lower in yields will be short lived. Q2 is going to have some incredibly strong economic data releases, which will filter into higher yields, thereby, putting the Yen under pressure.
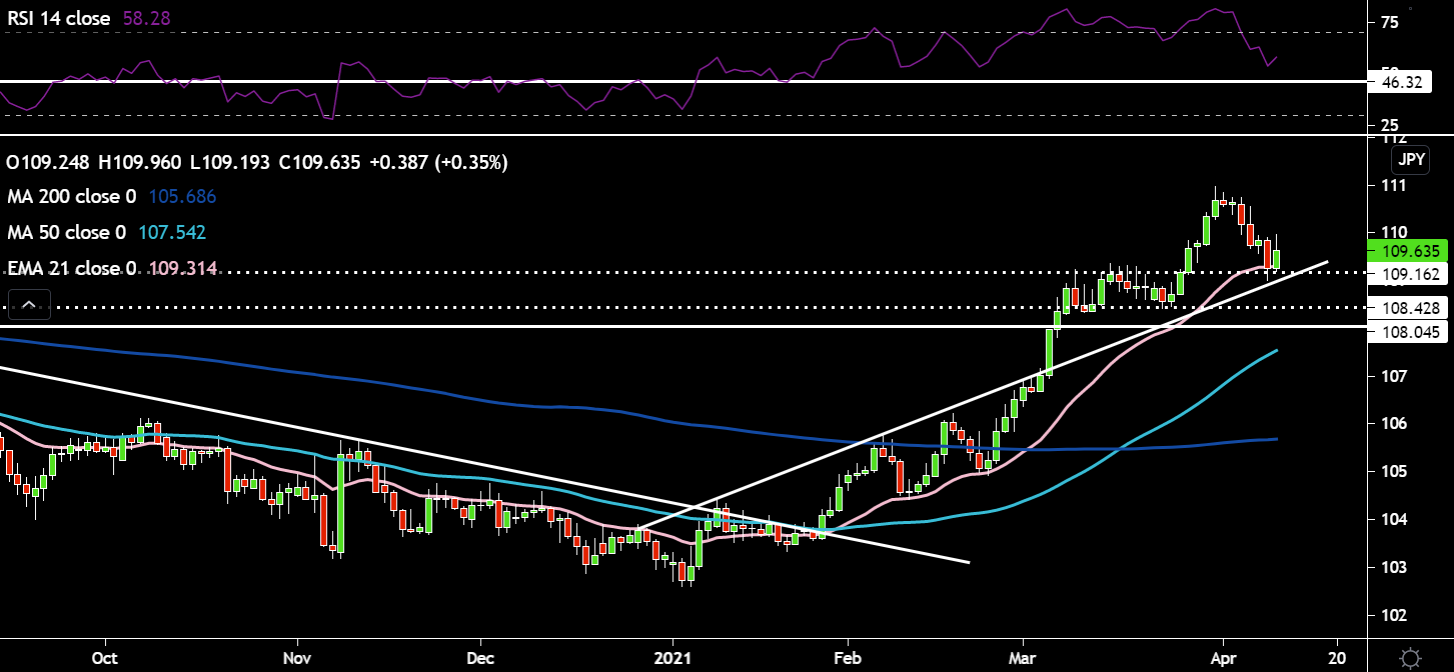
USDJPY has been offered all week. Today price bounced right off the 109.2 former range resistance, 21-day EMA and uptrend line. The RSI still remains above 46 support to keep the buy the dips strategy alive. If you believe US yields will go higher then USDJPY is a good candidate for moves upwards. 111 the former 2-week high would be the first target on the long side.
USDCAD:
Although, not a currency pair which usually features in the macro series, I do find the Loonie an increasingly interesting prospect. USDCAD has been moving higher throughout this week on worrying signs of a 3rd covid wave spreading in Canada. The oil price is basically flat for the week, so the Loonie hasn’t received any assistance on that front. However, today’s labour data, which was very strong has seen USDCAD move lower.
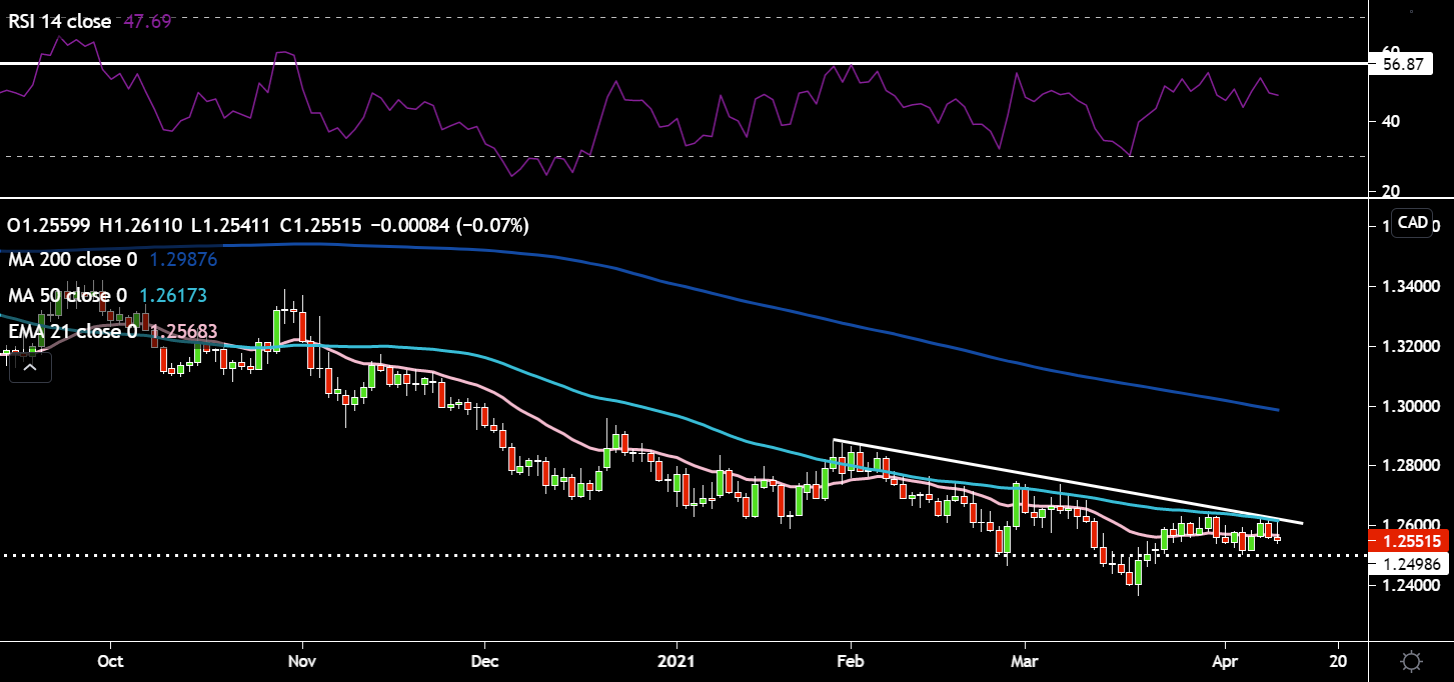
The question remains will USDCAD break to the upside through the 50-day SMA and downtrend line resistance or will price behave like it has in the past with short lived rallies being sold into the 50-day SMA. Well today price got sold back down again as it battled the 50-day SMA and downtrend line. The RSI is back up around the 56 resistance, marking tops in prior price rallies. What may work in the bulls favour, however, is what looks to be a rough potential inverted head and shoulders formation (typically bullish). The neckline would come in around the 1.263 level, if the formation plays out the projected move would be to circa 1.29. Price resistance around 1.27 would have to be cleared first. For the short the rallies camp, a good first initial target to the downside would be around 1.25 support. Lower down we have the March 18 lows of 1.236.
Crude Oil:
Crude has lost some of its recent volatility and excitement as it has been rangebound this week without any major news flow to spark a new directional bias in price. The demand outlook is definitely improving for H2, however, in the short term there are headwinds from covid in Europe, India and Brazil helping to keep price stuck in a range. We had two sizeable crude inventory drawdowns this week, now having flushed out the distortions from the Texas Freeze. The US Energy Administration have cut their oil production forecast for this year, highlighting potentially lower shale production. US Iran Nuclear talks are ongoing with traders eyeing any potential rollbacks of sanctions, however, initial proposals have been rejected by Iran. Adding uncertainty to the demand picture, the UK government has still not confirmed if international travel will be allowed from May 17 – the obvious takeaway from this is lower jet fuel demand if the timeline is pushed back further.
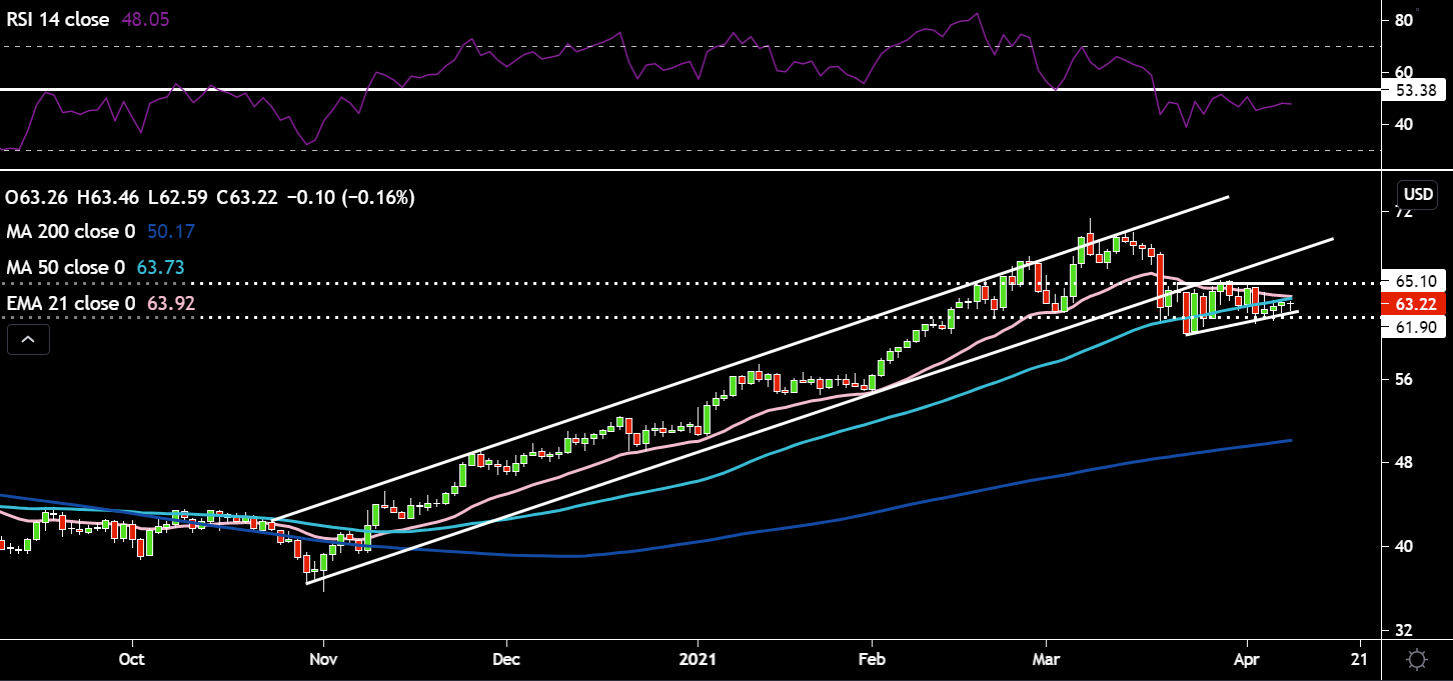
Oil has been unexciting this week and remains in a tight range between $62 and $65. There is a mini flat sided ascending triangle forming though as price lows make successive higher highs. There is some immediate price resistance in the form of the 21-day EMA and 50-day SMA around 63.7/9 region. The RSI remains below the 53 resistance level too. The $65 range resistance needs to be taken out first and the shorter term moving averages move higher if we are to see price move back into its ascending channel. There’s not much support below the $62 level, which means if price slides below that it could move as low as $55.
Gold:
Gold has been in favour this week as both nominal and real yields were softer. This fed into a weaker dollar which helped propel the yellow shiny metal higher. However, a significant chunk of those gains have been given back today despite very strong Chinese inflation data out earlier today. The stronger dollar and higher yields was too much for gold to overcome. As really strong Q2 Global inflation data drops onto the market it will be interesting to see which factors prove more important in driving gold’s price. If the dollar continues to strengthen in conjunction with higher yields, gold will probably struggle to continue moving upwards despite robust inflation metrics.
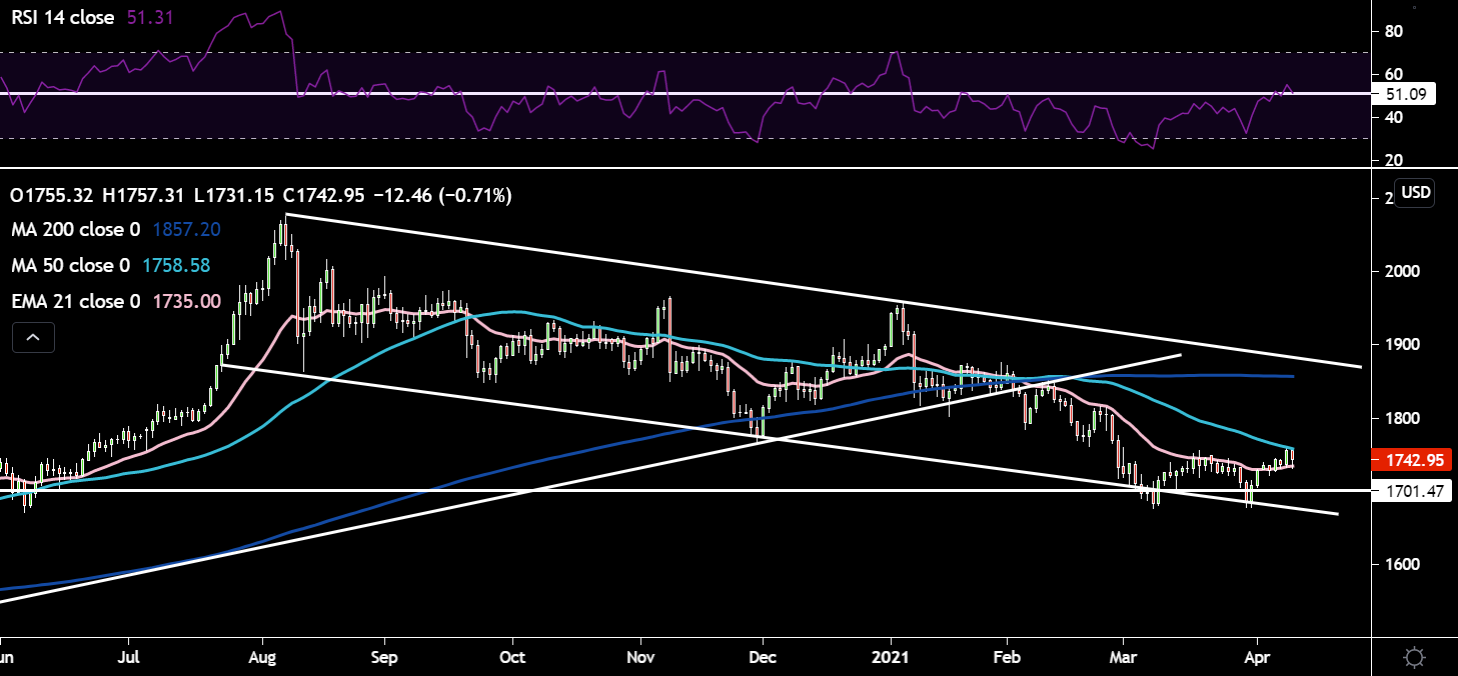
Gold is currently being squeezed between the 21-day EMA and 50-day SMA. It does look like a mini double bottom pattern formed over the last couple of weeks. If it plays out fully then price could move as high as $1825. The RSI is above the 51 resistance level, but looks like it’s rolling over – the key question will be if it dips briefly and continues its move higher. $1800 would be the first price target to the upside; on the downside $1720 and $1700 would come into play.
Bitcoin:
Bitcoin has been under pressure this week, but is seeing a decent move higher into the weekend off its 50-day SMA. Next week, the leading cryptocurrency exchange in the US, Coinbase will be listing directly on the Nasdaq on April 14 with the ticker COIN. Bitcoin has been benefiting at the expense of gold as flow data indicates. Rising real yields are not good for the shiny yellow metal, but Bitcoin can produce high single digit yields in a crypto savings account. Therefore, in an environment of rising yields, Bitcoin becomes the more attractive option vs yieldless gold. A British Quant firm, Quant Insight Ltd. has also indicated through their research that Bitcoin is positively correlated with inflation breakevens, further cementing the idea that Bitcoin is being used as a hedge against runaway inflation/fiat debasement.
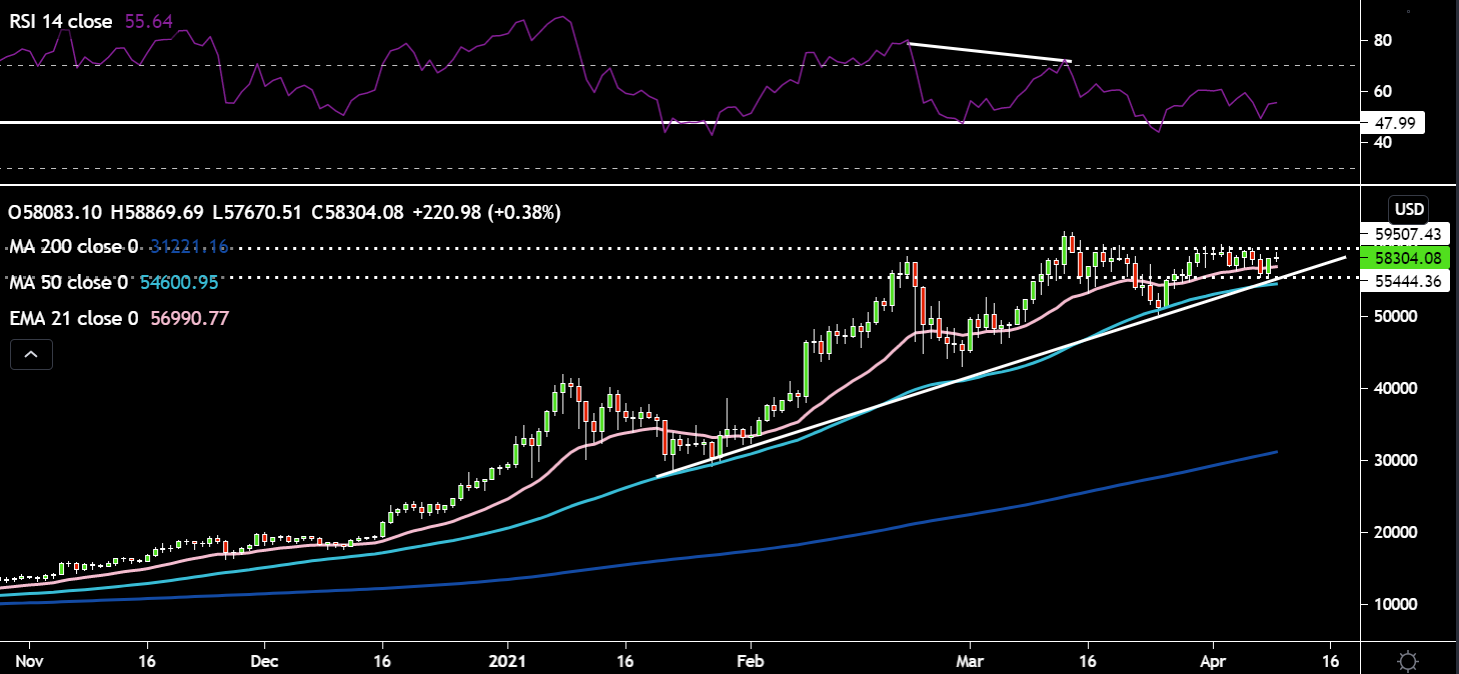
Bitcoin has been moving sideways in a range between $55500 and $59500. Price bounced strongly yesterday off the range support and uptrend line and is now pushing up against range resistance. The RSI remains above the 48 support level, keeping the uptrend intact. Will Coinbase’s listing propel price higher to take out the March 14 $61680 highs? One concerning signal for the bulls is the negative divergence which formed on the RSI between the late February and March 14 highs.
Related articles


Ready to trade?
It's quick and easy to get started. Apply in minutes with our simple application process.
The material provided here has not been prepared in accordance with legal requirements designed to promote the independence of investment research and as such is considered to be a marketing communication. Whilst it is not subject to any prohibition on dealing ahead of the dissemination of investment research we will not seek to take any advantage before providing it to our clients.
Pepperstone doesn’t represent that the material provided here is accurate, current or complete, and therefore shouldn’t be relied upon as such. The information, whether from a third party or not, isn’t to be considered as a recommendation; or an offer to buy or sell; or the solicitation of an offer to buy or sell any security, financial product or instrument; or to participate in any particular trading strategy. It does not take into account readers’ financial situation or investment objectives. We advise any readers of this content to seek their own advice. Without the approval of Pepperstone, reproduction or redistribution of this information isn’t permitted.