- English
- 简体中文
- 繁体中文
- ไทย
- Tiếng Việt
- Español
- Português
- لغة عربية
- English
- 简体中文
- 繁体中文
- ไทย
- Tiếng Việt
- Español
- Português
- لغة عربية
.jpg?height=93&quality=100)
The major macro variables driving markets, which traders need to keep an eye on are: Covid, Fed policy expectations, Fiscal policy through the prism of tax and spending, Inflation – will it be transitory or persistent and finally geopolitical flare ups – China & Taiwan, Russia & Ukraine and Iran
USD:
Yesterday’s price action in bonds had many market participants scratching their heads trying to figure out how bond yields could fall after strong retail sales, labour market data and manufacturing indices. Some of the narratives swirling around the market are that CTAs (short term momentum traders) started to cover their shorts and may have even flipped long as well as potential safe-haven flows from a souring relations between US and Russia after Biden banned US banks from issuing sovereign Russian debt. Surprisingly, the dollar dislocated from its usual correlation to yields and was quite resilient in the face of lower interest rates. Looking over the past 2 weeks the dollar has been softer, retreating from its short term high of 93.5. For me this boils down to: 1) US yields both nominal and real being a lot softer and rolling over lower. 2) The risk-on tone evidenced by an increasing equity market 3) US outperformance being fully priced in 4) The large net short positioning unwind has been exhausted with net specs almost flat now 5) Market rate hike expectations (eurodollar futures) paring back some of their tightening. FX markets are quite boring at the moment and are waiting for the next big catalyst to drive price action more decisively. We have Michigan Consumer Sentiment data out at 15:00 BST 00:00 AEST.
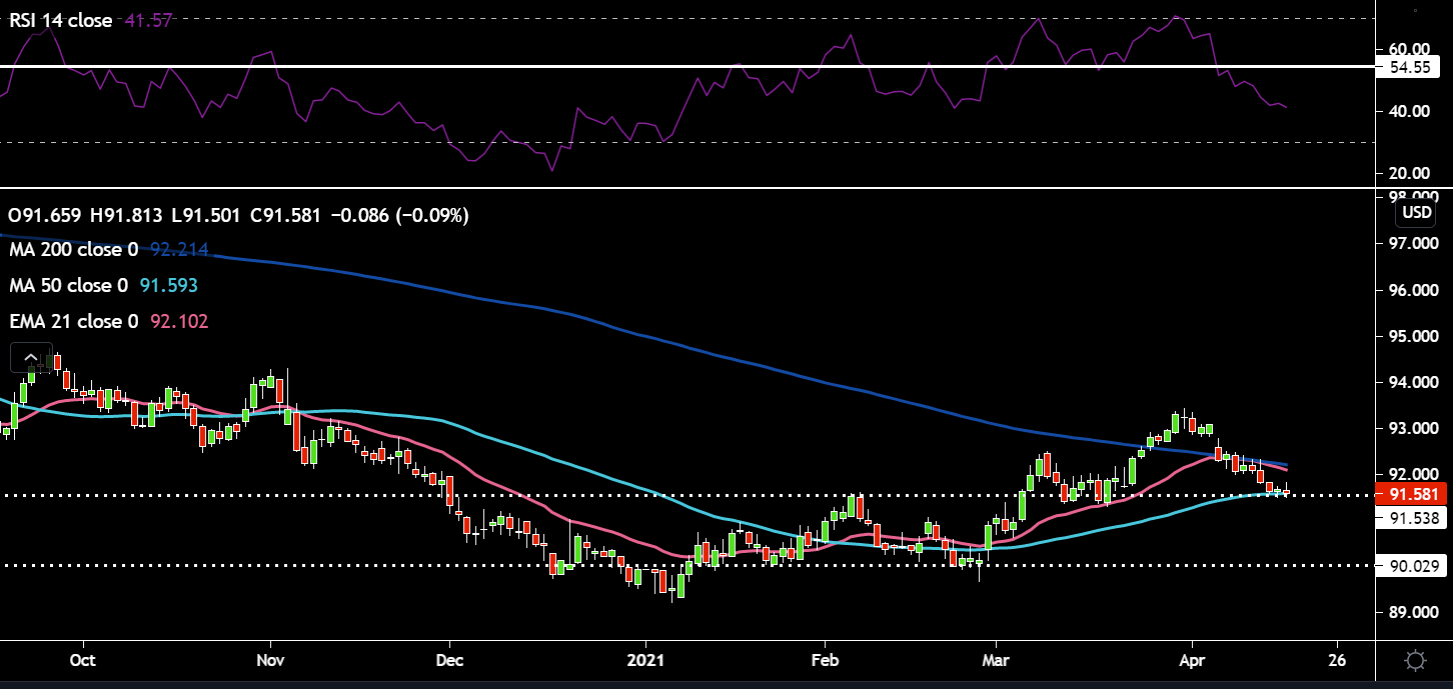
The technical indicate the dollar is at a key inflection point here. Price sits right on the 50-day SMA and horizontal support of 91.5 with the March 18 low of 91.3 very close. Bears and Bulls will be watching where price closes into the weekend – below or above the 50-day SMA. The 21-day EMA has rolled over lower. The RSI moved lower and has ominously dropped below the 54 support which held on prior price dips. Price needs to hold these levels and not close below that March 18 low or further price rises could be off the table. If price was to bounce off 91.5 support then rollover again we could see a head and shoulders pattern begin to form (typically bearish)
EURUSD:
There definitely seems to be a positive shift in sentiment towards the euro on the basis of an acceleration in their vaccination rollout leading to a swifter economic recovery buttressed by a supportive central bank and fiscal policy (still held up in German Constitutional Court). There were concerns after J&J suspended deliveries to the EU as blood clot issues flared up again (EU reliant on this vaccine), however, Pfizer and BioNTech said they will raise Covid-19 vaccine deliveries to the EU by 50 mln in Q2. Nobody wanted to touch the euro over the past few months, but now it looks like we’ve passed peak pessimism. Using the informational content provided by risk reversals, puts have dramatically reversed their premium over calls, implying downside bets/hedges are being unwound. US yields moving lower while core Euro area yields tick higher doesn’t harm the single currency either. On the economic data front we saw German 2021 GDP revised down to 3.7% from 4.7% and Italy was also cut from 6% to 4.5%, highlighting the urgency for the EU recovery fund to be deployed. German ZEW sentiment data was weaker and the final inflation data figures weren’t revised up or down from previous estimates. We have the ECB meeting next Thursday, which shouldn’t throw any curve balls our way. I will do a preview for this next week.
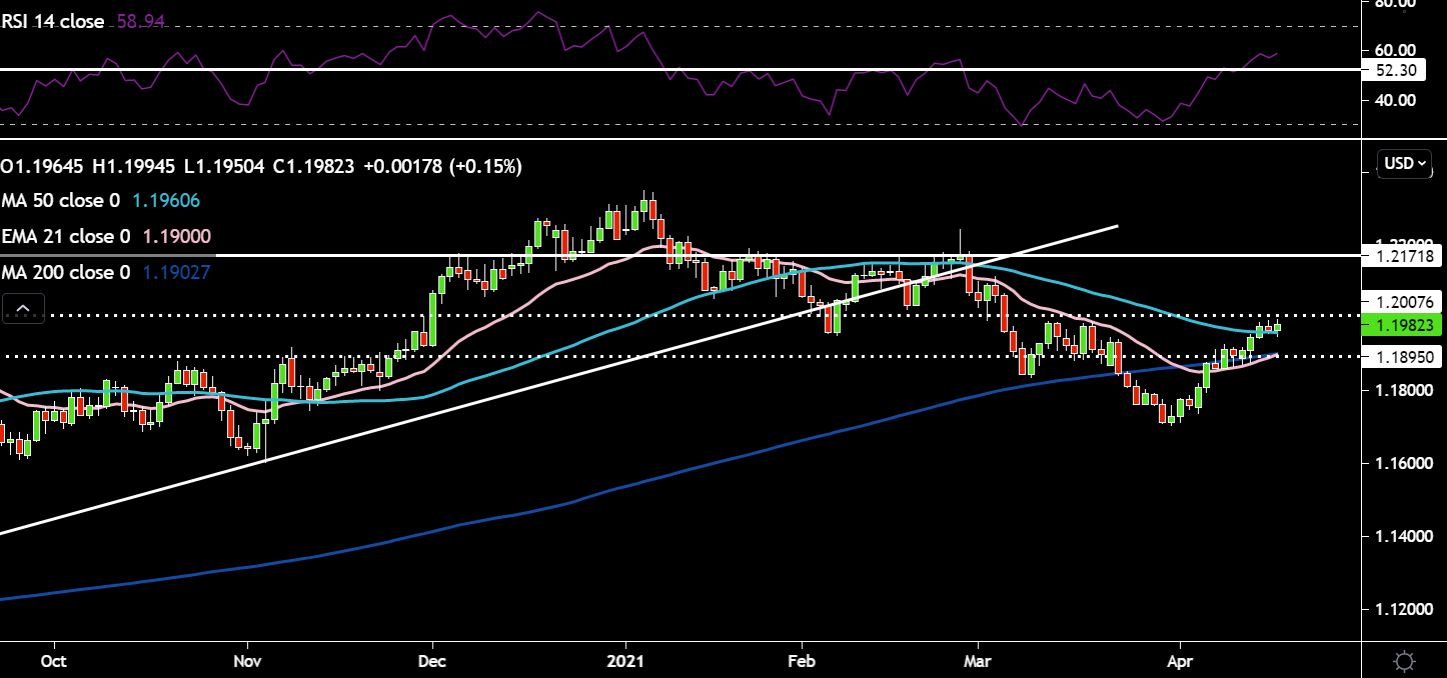
So far EURUSD seems to be holding its head above the 50-day SMA having a go at the key 1.20 level. The RSI has pushed through the 52 resistance which capped prior rallies in the downtrend. If price rolls over from the 1.20 level and holds the 1.19 and pushes higher again we could see an inverted head and shoulders pattern begin to form (typically bullish)
GBPUSD:
The pound has been trading in a narrow range of late between 1.365 and 1.38 without a new catalyst to drive price decisively in either direction. There seems to be some minor concerns growing that the early outperformance we saw in the beginning of the year is beginning to run out of gas. The vaccine rollout continues to chug along with the reopening roadmap unchanged for now. Sadly, for the sterling bulls, Andy Haldane the Chief Economist at the Bank of England will be departing in June. He was one of the more hawkish members on the MPC. Dovish undertones will be louder on the MPC with Andy leaving. On the geopolitical front, the UK and EU met last night to talk about issues related to NI. Both sides committed to finding solutions, however, the EU has not dropped its legal case against the UK. The UK has stated it will respond to the legal action by mid-May. The European parliament committee, just yesterday finally gave their blessing to the EU-UK trade deal. Lastly, seasonality in April does tend to blow in the pound's favour.
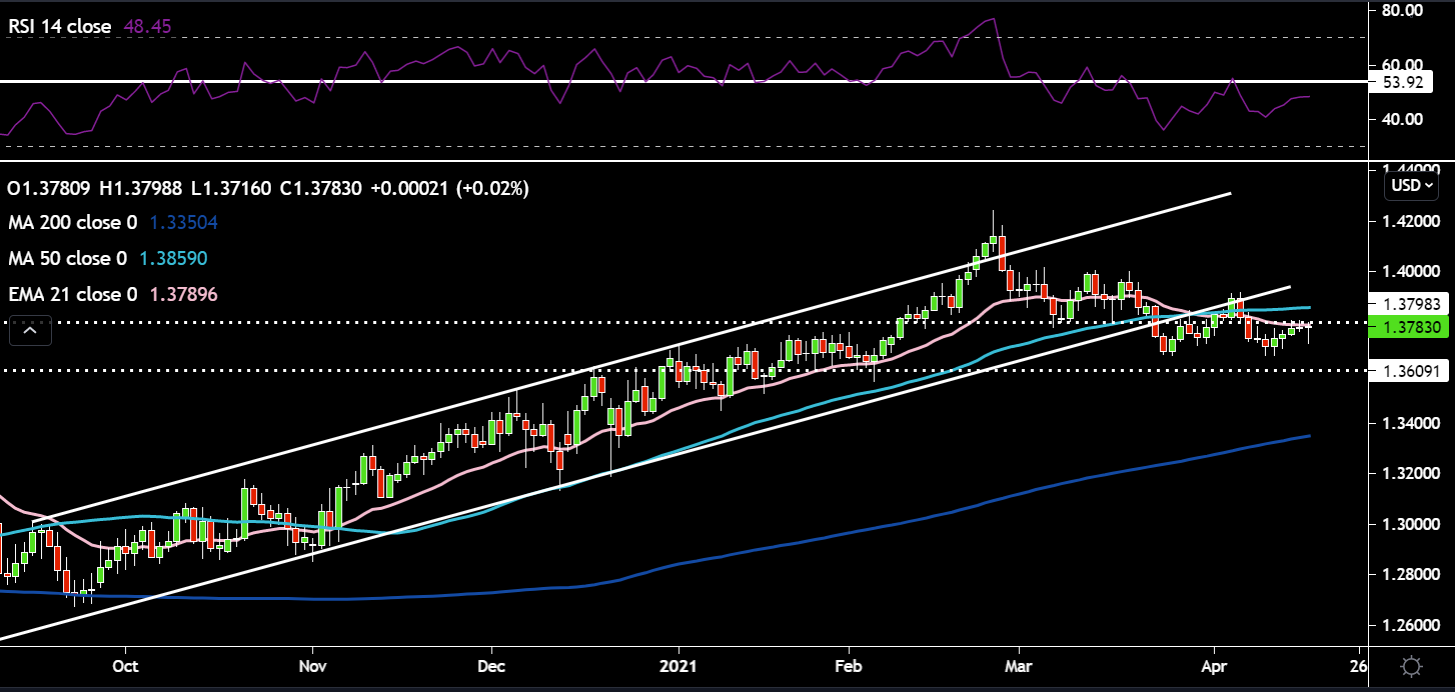
If price can break above the range resistance at 1.38 then a double bottom pattern (bullish) looks like it could play out for Cable. The RSI had made some negative divergence, indicating selling momentum was weaker on this push lower. However, I’d like to see the RSI back above 53, above the 21-day EMA & 50-day SMA and back in the ascending channel to feel more confident on longs.
AUDUSD:
With important Chinese data released earlier today, I thought the AUDUSD cross would be an interesting one to discuss. Chinese data came in mixed to slightly weaker than market expectations in my opinion. Q1 GDP missed on both a YoY and MoM basis and industrial production failed to meet market expectations. There was some positivity in the form of retail sales data which beat expectations handsomely. Local domestic Aussie employment data came in a lot higher than expectations earlier this week, but the composition of that increase (part-time workers) took some of the excitement out of the numbers. There are a couple of factors helping AUDUSD long positions – 1) Iron Ore and the general commodity complex continuing to push higher (a large part of the Aussie economy) 2) Given AUD’s high beta to risk, higher equity markets have been a tailwind for the currency 3) Softer US yields widening the interest differential.
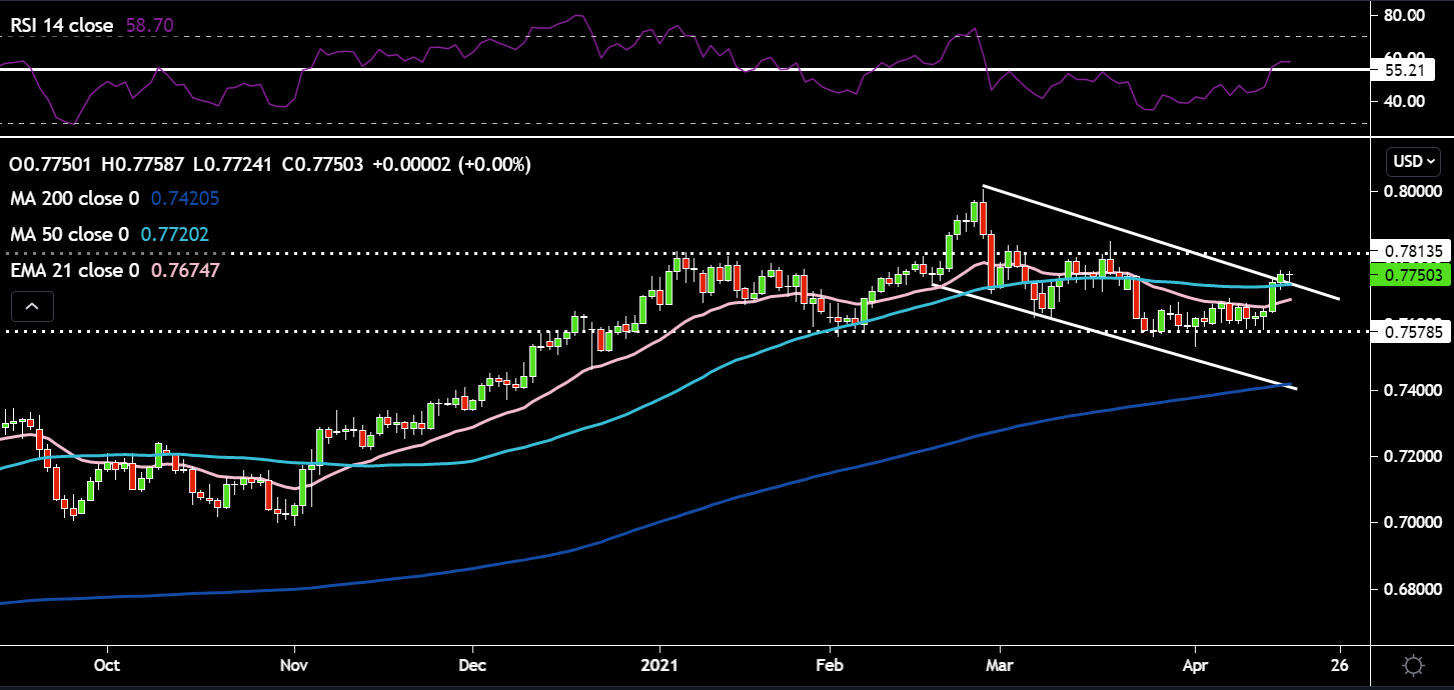
This cross is looking quite bullish on the charts. Price has broken above the mini descending channel which formed from the February 25 highs. The 50-day SMA has also been overcome and the RSI has cleared the 55 resistance level. One could say there is a rough looking inverted head and shoulders pattern playing out. We will have to see what price does as it gets closer to the range resistance around 0.78.
USDJPY:
The market is almost agnostic to Japanese specific data at the moment and instead are consumed with US data and how that feeds through into 10-year US yields, the main driver for this cross. This close relationship was on display yesterday as the 10-year slid close to 6 bps on a closing basis. One minor ancillary driver which certainly works against the yen is the very poor vaccine rollout, the lowest in the G10 FX space.
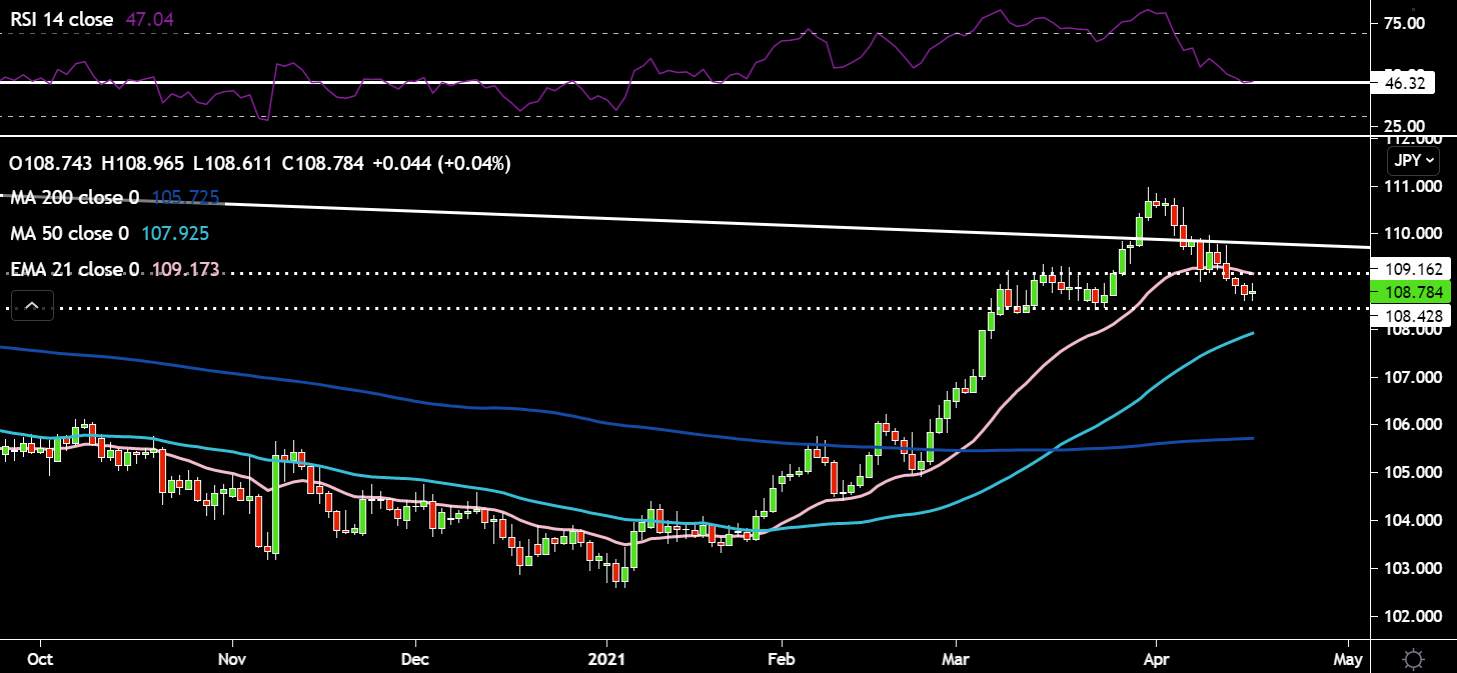
USDJPY has been offered all week. Price is clinging to the bottom of the range support around 108.4. The RSI is sitting right on the key 46 support level with a move higher or lower helping price find its next direction. If you believe the move in US yields lower was temporary and will resume its uptrend higher then USDJPY is a good candidate for moves upwards. 111 the former 2-week high would be the first target on the long side. Plenty of resistance to clear before getting there though.
Gold:
The shiny yellow metal seems to be back in vogue of late, with a number of factors working in its favour. Yields both nominal and real have been moving quite significantly lower. Real yields are particularly important for gold given their close correlation. A weaker greenback which allows global participants to get more bang for their buck when buying gold denominated in dollars. Decent inflation numbers out earlier this week from the US.
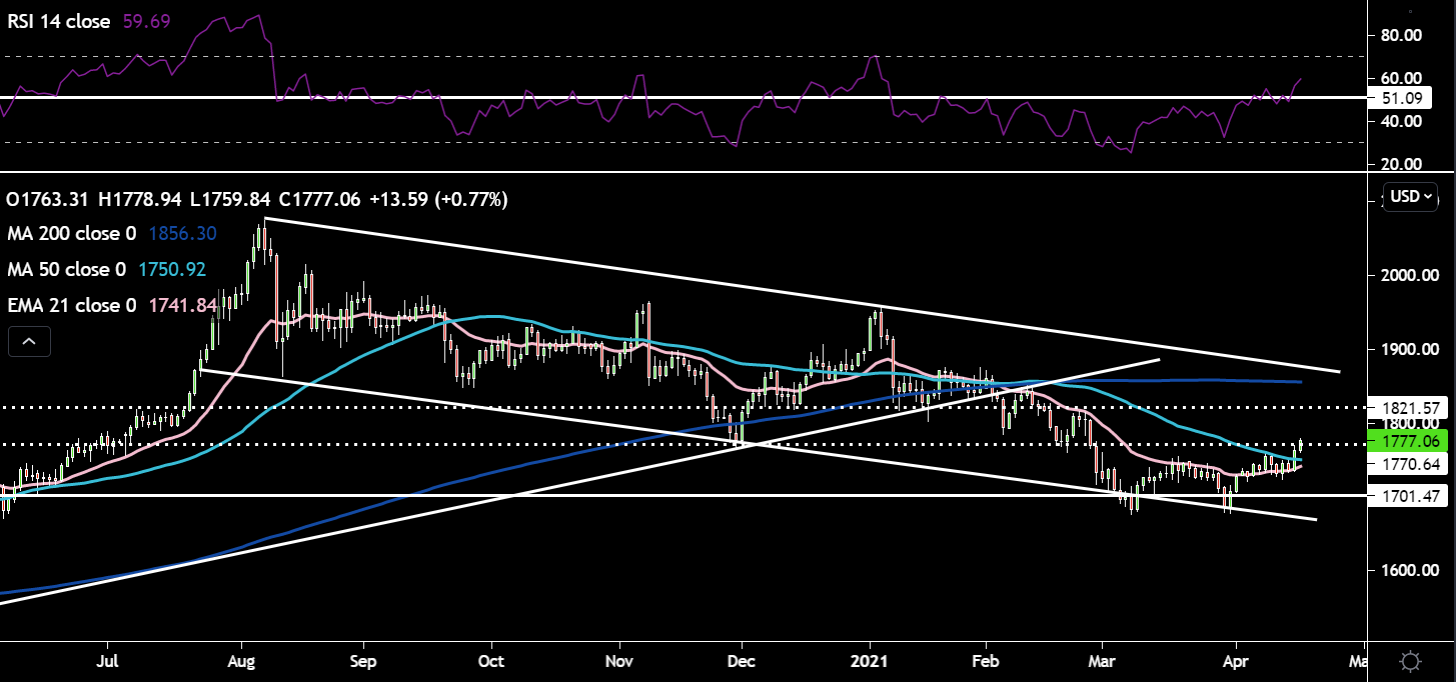
Gold is comfortably above the 21-day EMA and 50-day SMA with the 21-day EMA looking like it wants to cross above the 50-day SMA. It does look like the mini double bottom pattern which formed over the last couple of weeks is playing out. If it plays out fully then price could move as high as $1825, coinciding with strong resistance at $1820. The RSI dipped briefly around the 51 resistance level and has now continued to march higher. $1800 would be the first price target to the upside; on the downside $1720 and $1700 would be the levels to watch.
Oil:
The oil space is very interesting at the moment, with traders having to juggle various factors thrown at them. 1) In their monthly report, the IEA projected a significant increase in global oil demand as we move into the latter half of this year. 2) 3rd week in a row of crude inventory drawdowns with a particularly large drawdown on Wednesday in the official data, significantly above expectations 3) Weakness in the dollar 4) A bit more of a hawkish tone from Iran which could ruffle some feathers and keep sanctions in place. 5) Another drone attack on Saudi Oil Facilities for the 2nd time in a week, keeping the geopolitical risk premium chunky. 6) The revival of international air travel, the decision for travel on May 17 by the UK government will be an important one for jet fuel demand.
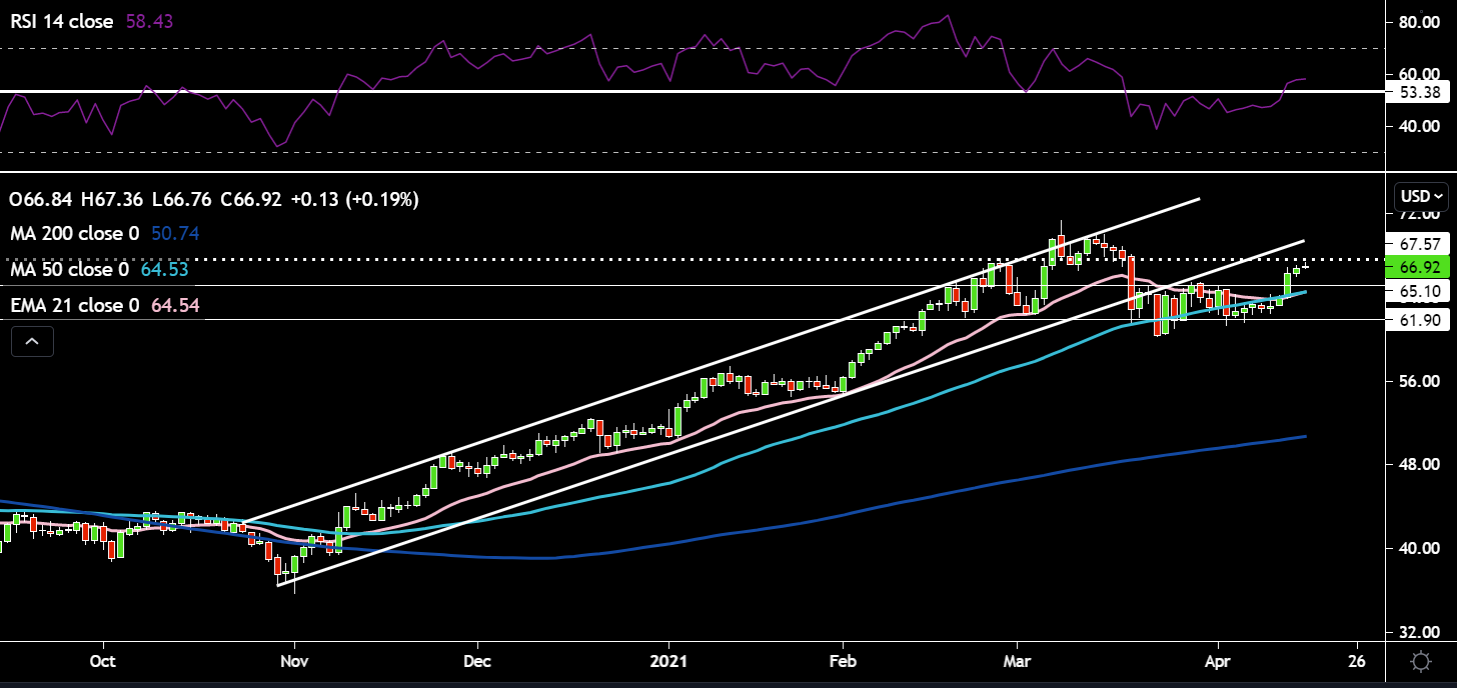
The technicals show a decisive break above the $62-65 range crude found itself in for the past 3-weeks. Both shorter-term moving averages – 21-day EMA and 50-day SMA look to be turning up from their sideways movement. The RSI has perched its head above the key 53 resistance level. It will need to remain above this “line in the sand” to continue its ascent higher. The first big price target higher comes in at $67.5, with further moves needing to break $69 to move back into the ascending channel. Once those levels are cleared the March 8 highs of $71.37 come back into play. To the downside I’d monitor the former range resistance which could now act as support around $65 (modestly above 21-day EMA and 50-day SMA). Below that the $62 range support would come into play. If price broke below the March 23 low of $60.3 then we could see some large selling given the lack of technical support until $56.
Bitcoin:
It seems like Bitcoin has been caught up in Coinbase’s price weakness and potentially some profit taking as we hit new highs just shy of 65k. Price is down almost 5% as I write this. Turkey banning crypto payments has also weighed on Bitcoin’s price.
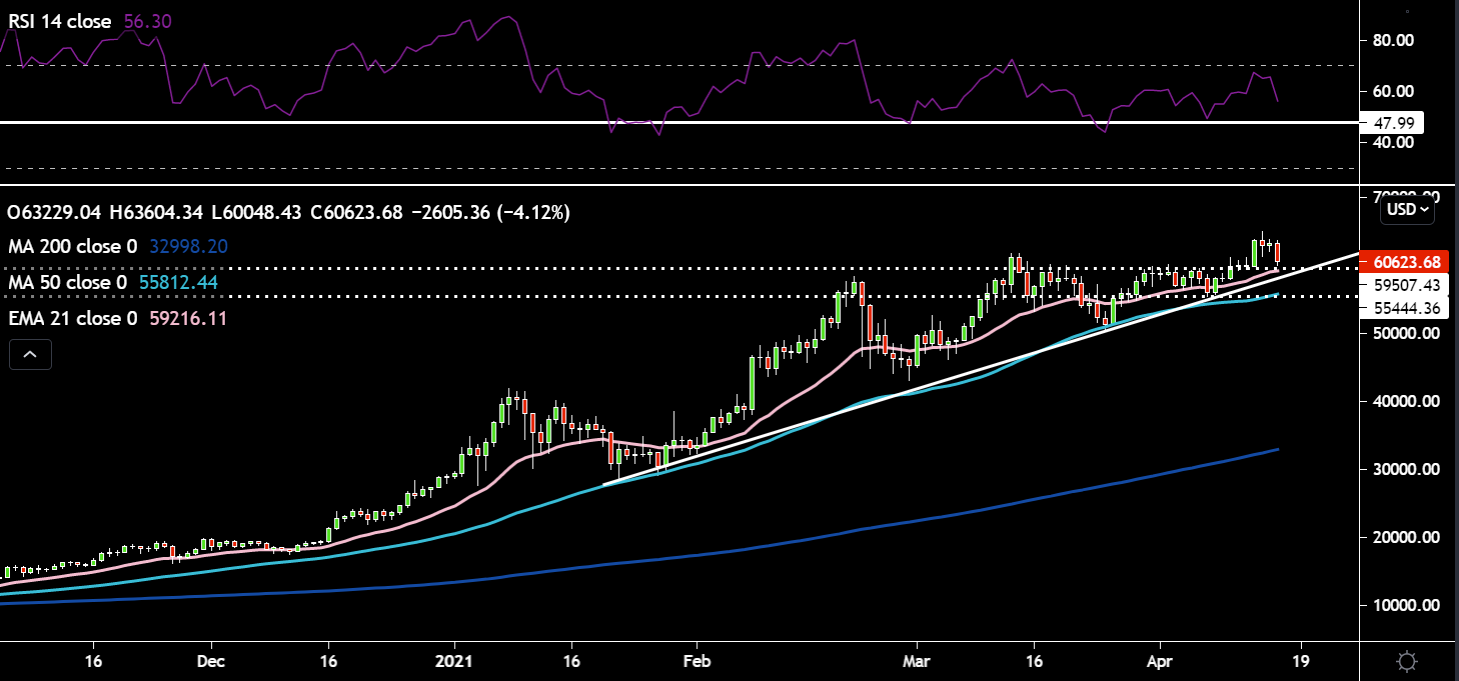
Bitcoin had been moving sideways in a range between $55500 and $59500. Price broke out to the topside as excitement around the Coinbase listing grew. New all-time highs were achieved just shy of 65k.The RSI remains above the 48 support level, keeping the uptrend intact, but has rolled over aggressively today. One concerning signal for the bulls is the negative divergence which formed on the RSI between the late February and March 14 highs and has now just put in another lower high despite higher price action. Price is sitting very close to the former range resistance at $59500, the 21-day EMA and uptrend line. Breaches of these could see accelerated selling pressure.
Related articles


Ready to trade?
It's quick and easy to get started. Apply in minutes with our simple application process.
The material provided here has not been prepared in accordance with legal requirements designed to promote the independence of investment research and as such is considered to be a marketing communication. Whilst it is not subject to any prohibition on dealing ahead of the dissemination of investment research we will not seek to take any advantage before providing it to our clients.
Pepperstone doesn’t represent that the material provided here is accurate, current or complete, and therefore shouldn’t be relied upon as such. The information, whether from a third party or not, isn’t to be considered as a recommendation; or an offer to buy or sell; or the solicitation of an offer to buy or sell any security, financial product or instrument; or to participate in any particular trading strategy. It does not take into account readers’ financial situation or investment objectives. We advise any readers of this content to seek their own advice. Without the approval of Pepperstone, reproduction or redistribution of this information isn’t permitted.