- English
- 简体中文
- 繁体中文
- ไทย
- Tiếng Việt
- Español
- Português
- لغة عربية
- English
- 简体中文
- 繁体中文
- ไทย
- Tiếng Việt
- Español
- Português
- لغة عربية
.jpg?height=93&quality=100)
DXY
The dollar’s fortunes have taken a turn today and the greenback is now paring back its recent consecutive 3-day losses. The dollar had a lot of events to digest this week namely, the stimulus bill, 10 and 30-year bond auctions, ECB meeting and now today’s PPI data which came in line with expectations on the MoM data, but beat on the YoY data. Core PPI missed very slightly on the YoY side. The dollar responded well and is moving higher at the time of writing. The 10-year and 30-year auctions were much improved on the terrible 7-year auction, with very small tails, strong bid to cover ratios and solid indirect demand (foreign demand). Dollar positioning remains still heavily short and this poses squeeze risk, especially given the strong upward GDP growth revisions we’re seeing for the US and the ambivalence of the Fed towards rising yields relative to the dovish ECB. Next week the spotlight will be given to the Fed. My colleague, Chris Weston has written a great preview on this here.
The technicals show a strong bullish candle today with price pushing back up to the 92 level. Will be interesting to see where we finish at the close today as a close above 92 would be dominant. The RSI has bounced off the 55 level and still has plenty room to run before it becomes overbought. The 21-day EMA and 50-day SMA provide dynamic support on the downside around 91.2 and 90.6 respectively. To the upside price targets would be 92, 92.5 and then 92.8 around the 200-day SMA.
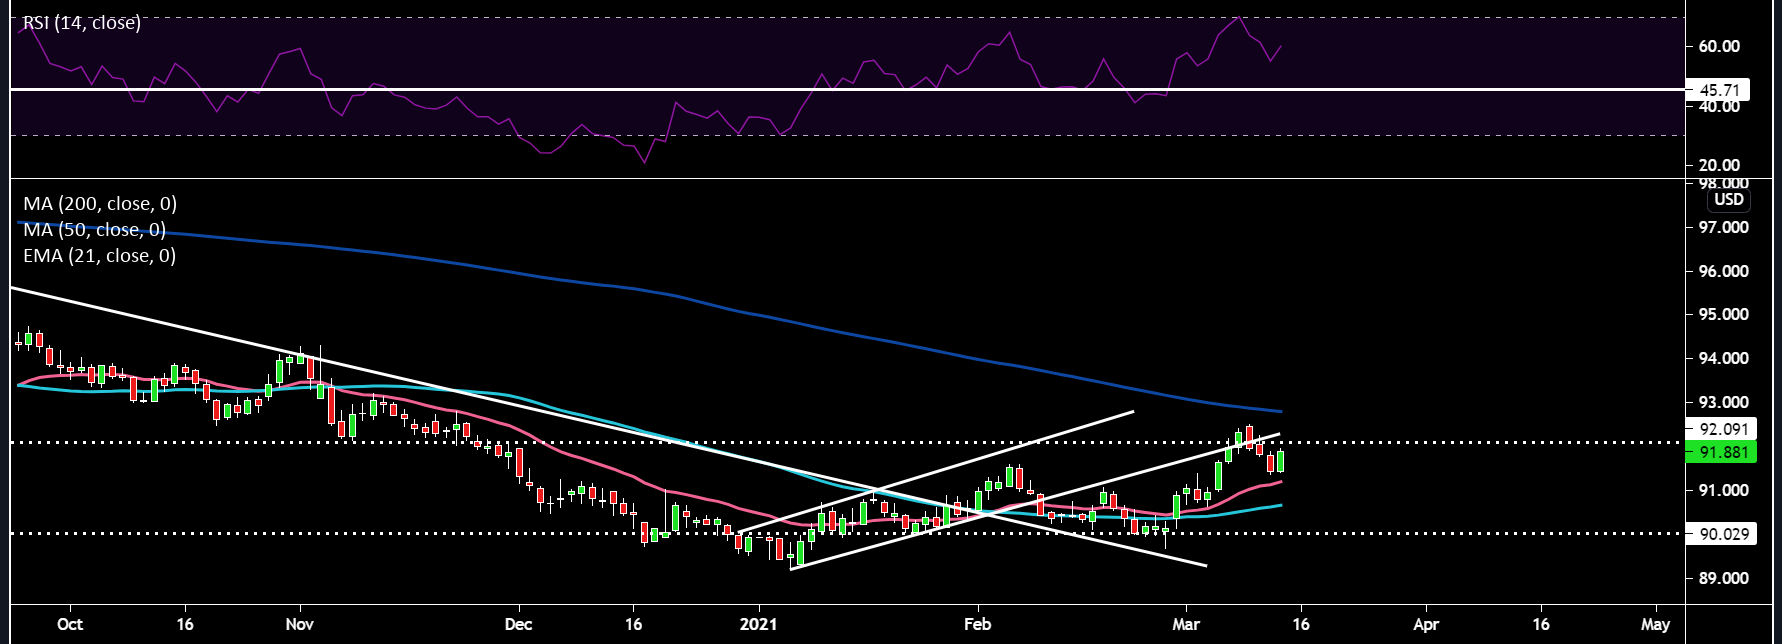
Pink line: 21-day EMA, Light Blue Line: 50-day SMA, Dark Blue Line: 200-day SMA (same for all other charts)
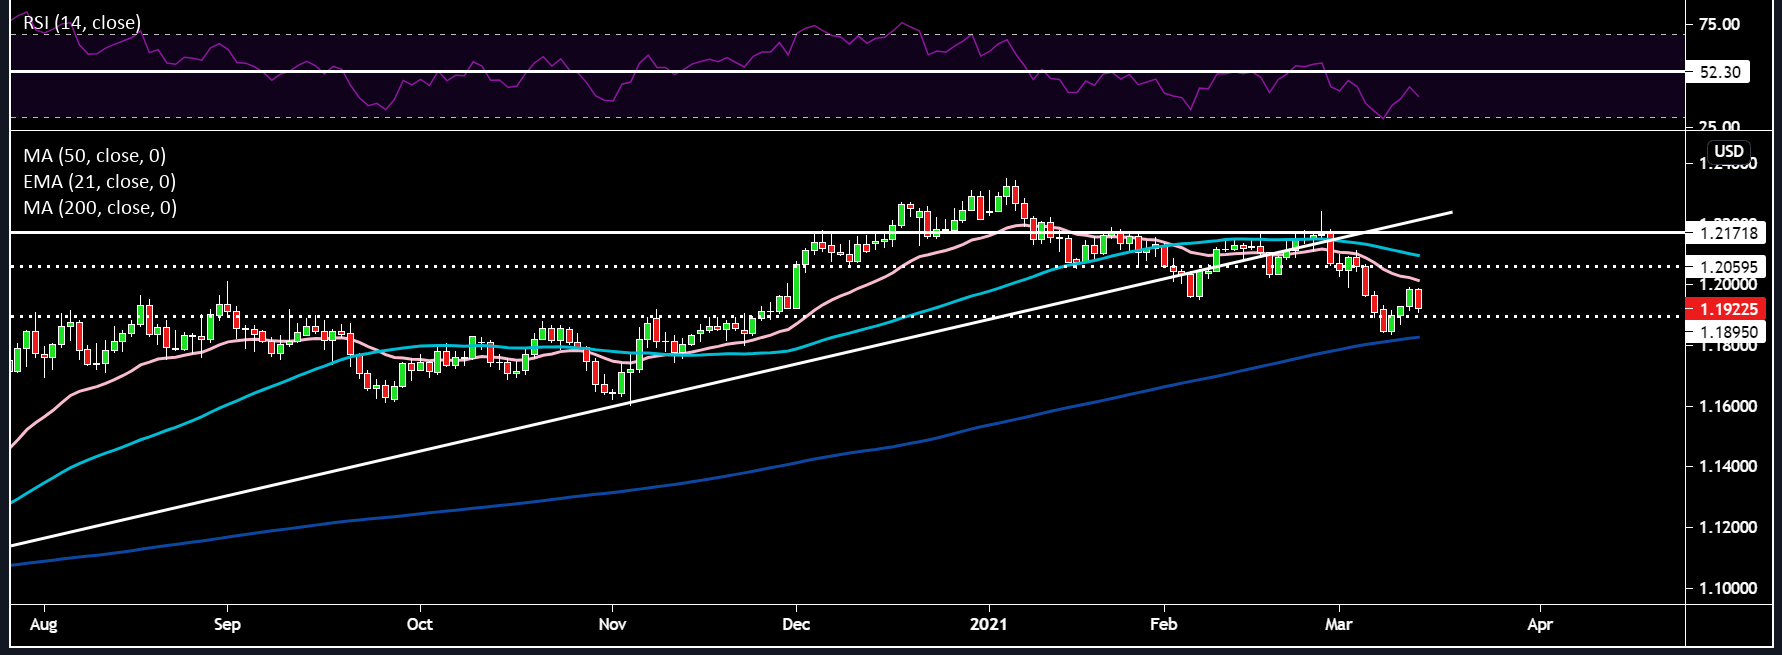
EURUSD
Yesterday, saw the much talked about ECB meeting take place with the euro first sliding by about 10-20 pips south on the back of “purchases under the PEPP over the next quarter to be conducted at a significantly higher pace”, the euro then rebounded into the close. Today, however, the price is yet again under pressure. In terms of the key points from the ECB meeting, rates were left unchanged, the size of PEPP was unchanged at €1.85 trillion and the end date of March 2022. By increasing the pace of purchases (no amount was given) without expanding the programme’s size, it means that buying volume will slow down towards the latter half of this year. An expansion to the PEPP envelope would have been more euro bearish and seems like the less likely scenario as the year progresses given Lagarde stated the risks to the economic outlook are now more balanced. Additionally, these economic projections excluded the effects of the $1.9 trillion stimulus in the US and the deployment of the EU recovery fund. There will be no yield curve control as Lagarde stated yesterday and the exchange rate will continue to be monitored. In terms of clarity on financing conditions, we didn’t get much which is disappointing, this is what we got - financing conditions are defined by a holistic set of indicators, spanning the entire transmission chain of monetary policy from risk-free interest rates and corporate borrowing costs. Lastly, the virus situation continues to go from bad to worse with Italy now implementing more lockdowns and virus cases rising broadly across Europe.
Price is currently being squeezed between the 1.19 and 1.20 levels. The 21-day EMA could act as dynamic resistance. The RSI has rolled over and looks to be heading lower. Price is hovering around the 23.6% Fibonacci level with a further move lower potentially tagging the 200-day SMA and below that the 38.2% Fibonacci level comes into play around the 1.17 level. Net specs positioning is still substantially long, which always poses the risk of a chunky sell-off.
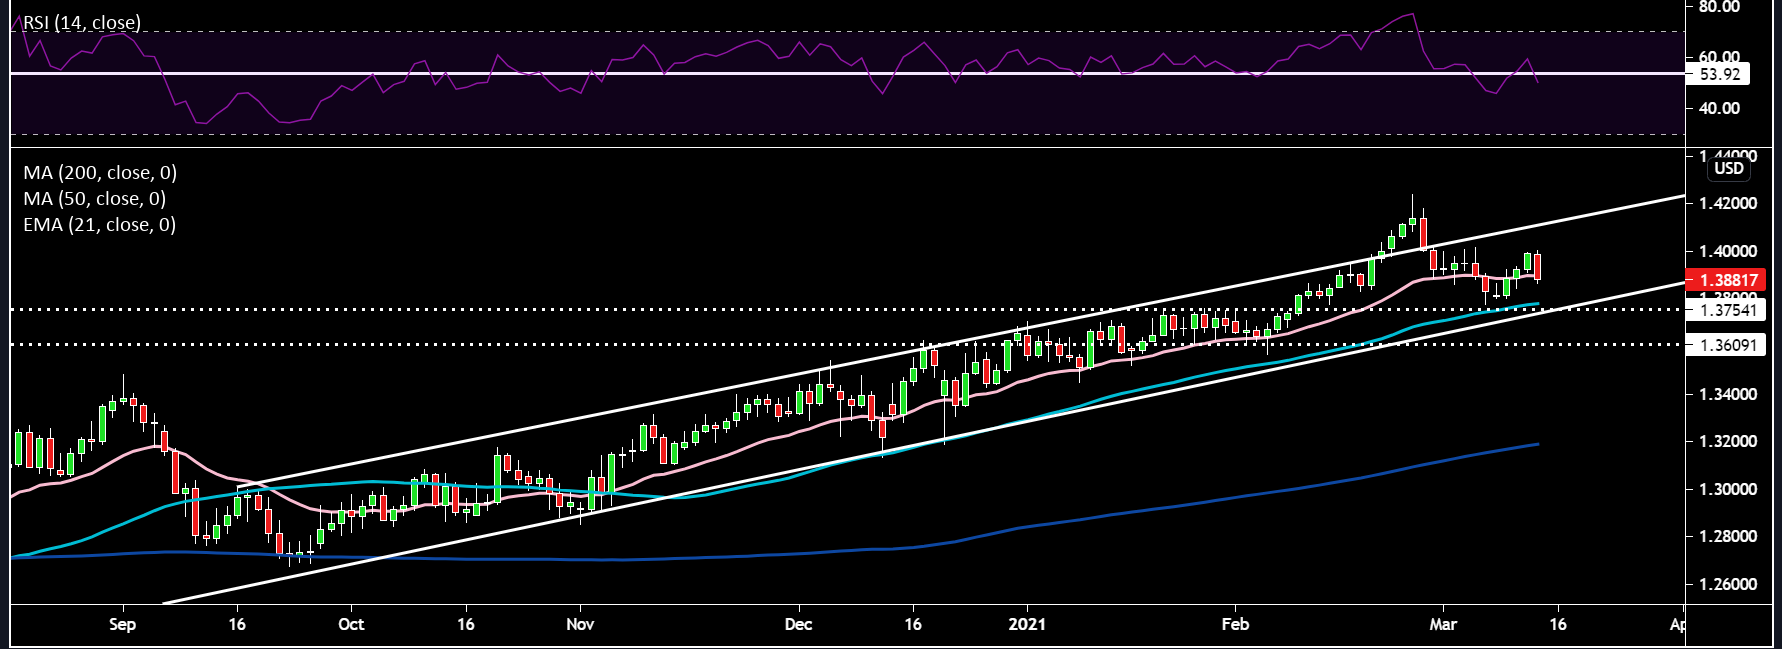
GBPUSD
Cable’s strong run of the last 3-days has met some pressure and price is in the red today despite much better than expected GDP Data and a much smaller than expected trade deficit, which feeds into a lower current account deficit and is usually positive for a currency. However, these numbers include some distortions, making us take them with a pinch of salt. The BoE’s Governor Bailey stated earlier this week that contingency planning for negative rates does not imply it is their chose policy tool. I am confident the UK will not see negative rates in this economic cycle. Geopolitically, the EU is preparing a legal response to the UK’s choice to waive checks on certain goods moving between Great Britain and Northern Ireland. For now markets don’t seem phased, but it’s one to keep an eye on. According to the Telegraph, Boris Johnson will make clear this Sunday that he will not allow a second Scottish independence referendum to go ahead, even if the SNP wins a majority in the May elections. Referendum polls indicate pro leave support has been declining in the polls, this would help remove a tail risk for sterling.
Price is sitting right in the middle of the ascending trend channel and on the 21-day EMA. It will be interesting to see if price can hold the 21-day EMA into the close this evening. The RSI has rolled over and moved below the 53 support level. On a more significant pullback there is a lot of support around the 1.375 level – lower uptrend line, horizontal support and the 50-day SMA. To the upside 1.40 and the previous high of 1.424 remain the targets.
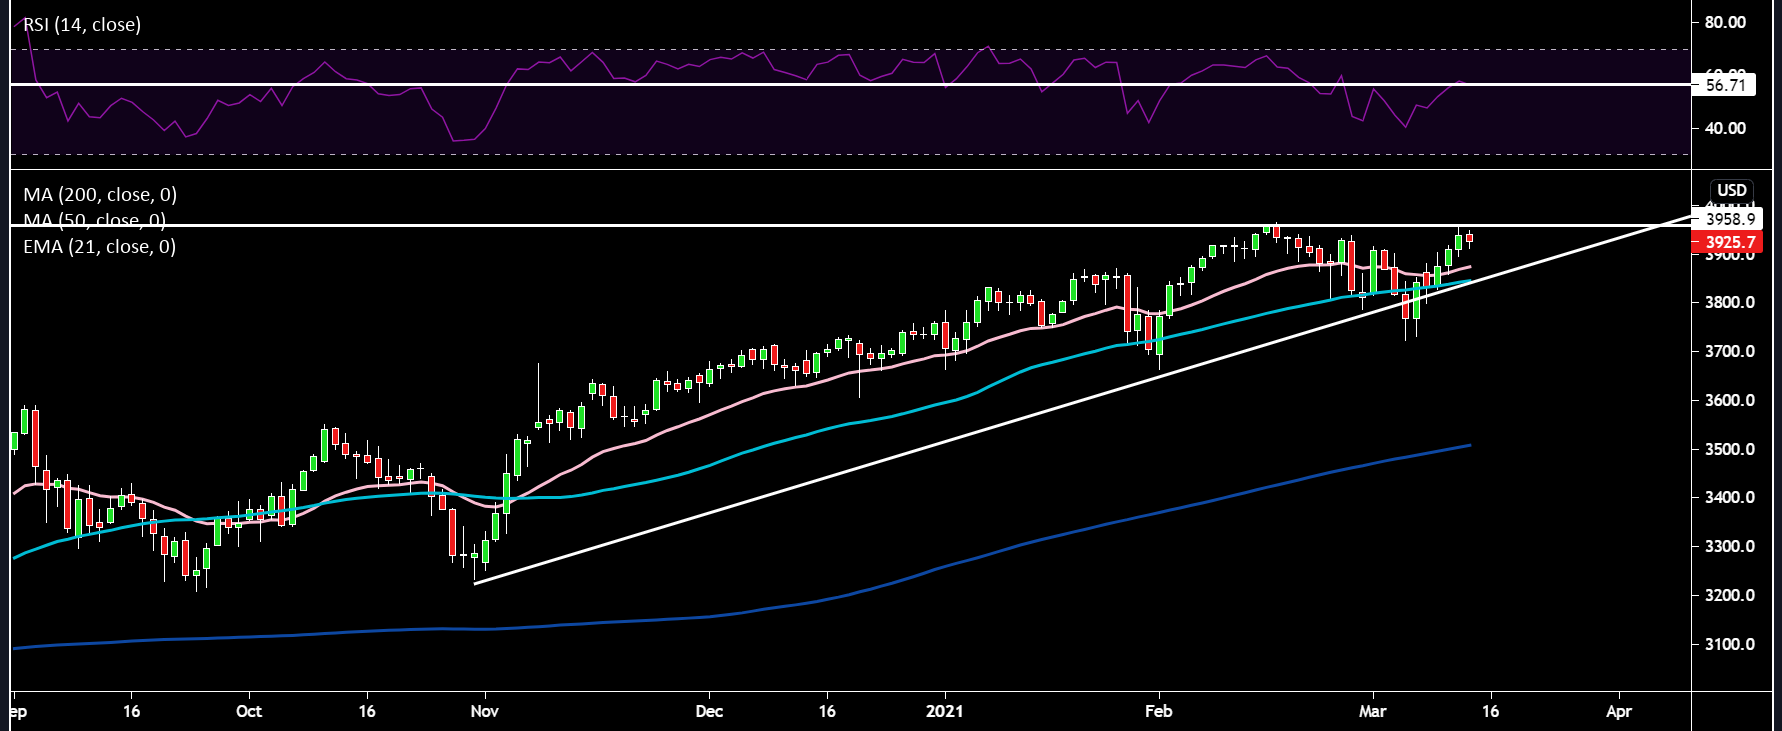
S&P500
The large rise in the US 10-year yield today is hurting equity markets. Price is also stalling at the previous all time high levels around 3960. The higher move in yields does no favours for the S&P 500, which has a large weighting towards tech stocks which are bond proxies. I think volatility and up down moves is to be expected as the market tries to calibrate the larger stimulus against higher yields. The path of least resistance still remains up, especially with retail traders set to receive their stimulus checks over the weekend. Price remains well supported around the 3850-70 zone and 4k seems like a very manageable price target. The RSI is right on the key 56 support line.
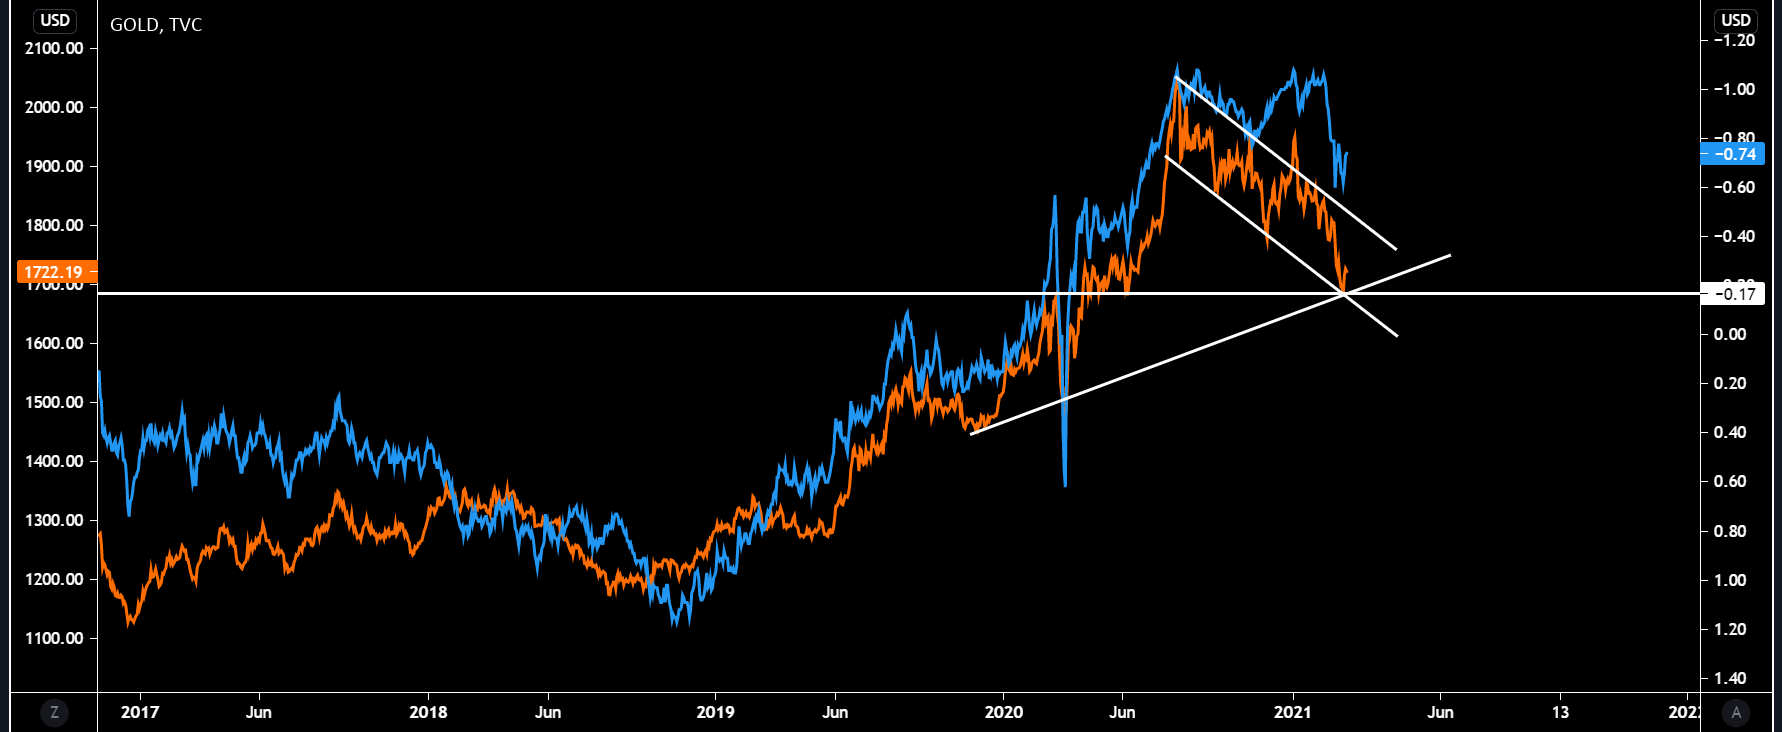
Gold
Gold is sliding from its recent high of $1740 as price action continues to be dictated by movements in the dollar and real yields – which have both moved higher. Gold bulls would have hoped Biden’s $1.9 trillion stimulus plan may have stoked some inflation fears, however, this week’s CPI print was certainly not pointing to that. I will be watching with a keen eye to see if Gold closes below the $1700 level this evening. That is key support coming from the horizontal white line, lower line of descending channel and the uptrend line from May 2019. In the chart the Blue line is the US 10-year real yield and the orange line is the price of gold. I’ve put this chart together to show the tight correlation between the two and the dominant effect real yields have on gold.
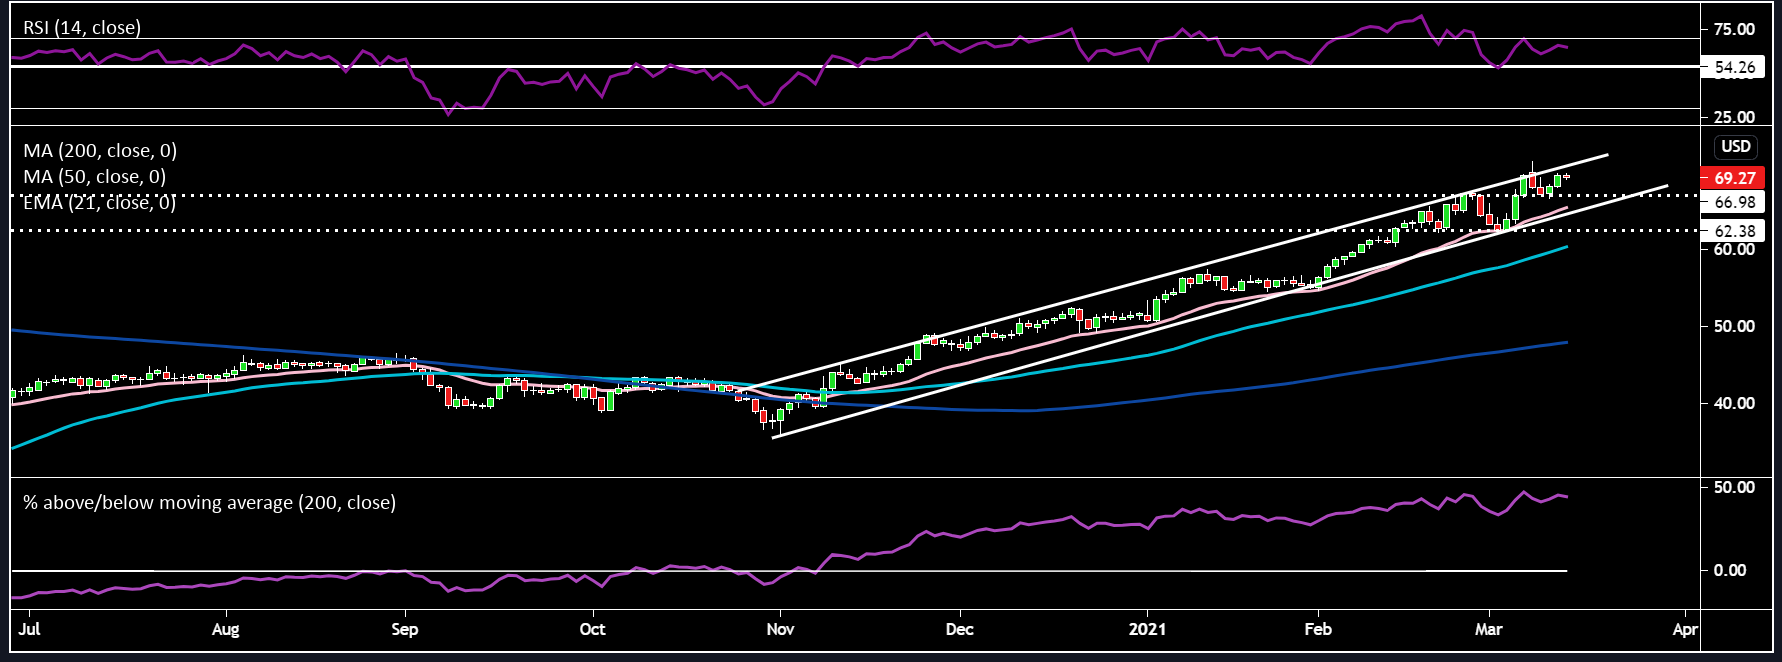
Oil
Oil has been strong over the past two days, holding the 67 support and having another go at 70. Price has been aided by the US stimulus bill with signs of demand increasing globally. OPEC’s monthly oil market report showed a slight upward revision to their expected global demand from 5.79 mln bpd previously to 5.89 mln bpd now, however they highlighted a weaker environment over the next 6 months. This is largely a result of the increasing restrictions that seem to be piling up over in Europe. Additionally, they foresee some extra supply coming from Non-OPEC participants. There was another large crude build this week of 12.79 mln vs 816k expectations. It seems likely this boils down to the weather issues we saw in Texas recently. The technicals remain solid with price moving nicely within the ascending trend channel. The 21-day EMA has provided good dynamic support for those wanting to express a long view. However, the RSI has begun to rollover and will need to hold 54 on any pullbacks to keep the bullish momentum going. 65-67 support will remain crucial. The other indicator I’ve put on the chart shows the % difference between the closing price and the 200-day SMA, which currently is stretched historically at 44.68. It may mean we could see some mean reversion from those extreme readings with price moving lower. For more ways to trade oil, check out this article
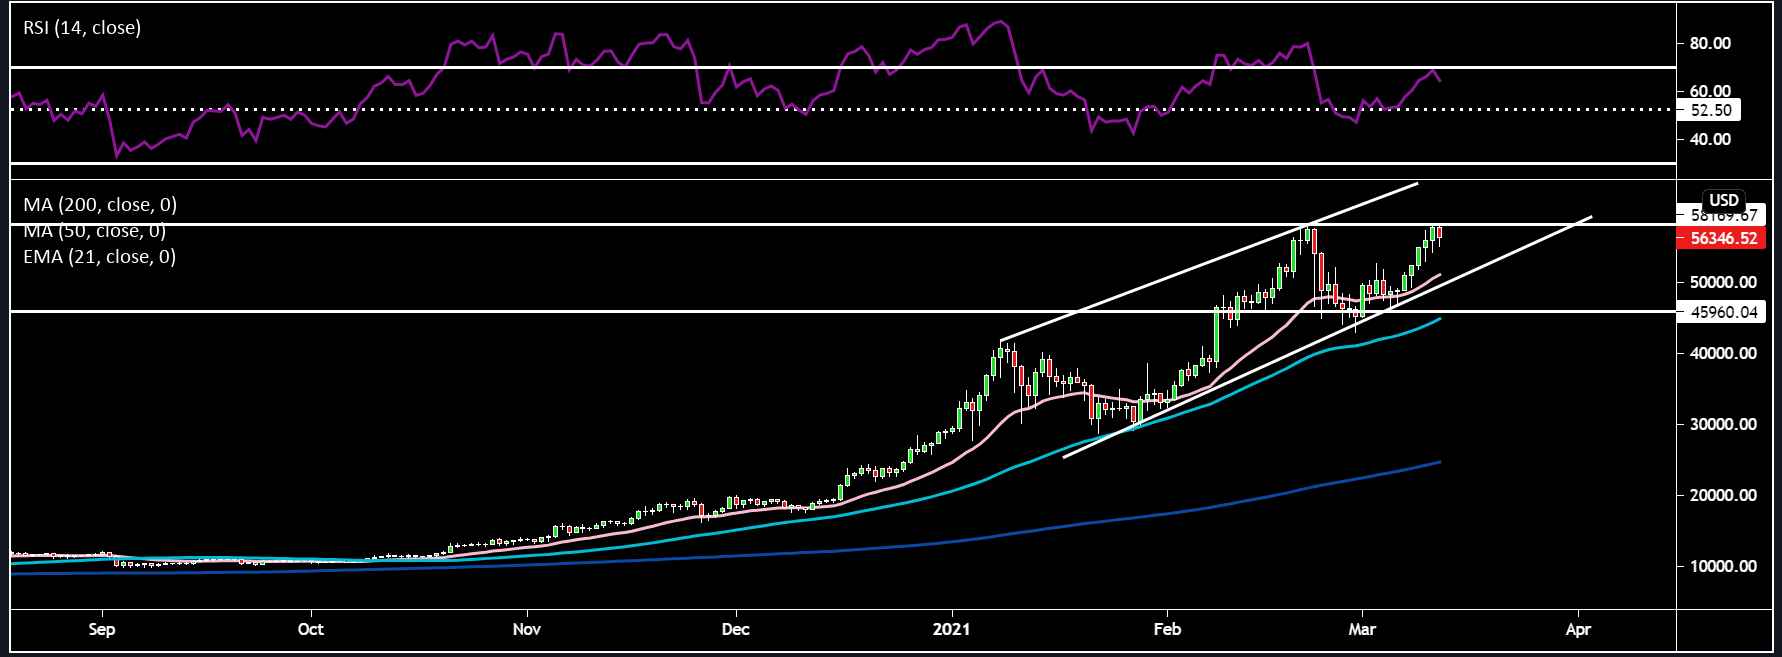
Bitcoin
Bitcoin has been on a tear of late, rising consecutively over the last 7 days. However, the steam seems to have run out as price tried to have a go at the all-time high of 58367. Recent strength may be down to front running the increase from retail investors deploying their stimmy checks into some of their favourite assets like Bitcoin. The direct deposits will be come as early as this weekend, so Monday could see a strong bid behind price. The SEC’s approval of a Bitcoin ETF should help propel price higher over the medium term. It is a question of when not if in terms of approval in my opinion. Price rocketed off the horizontal support at 45/46k, 21-day EMA and the lower line of the ascending trend channel. The RSI has begun to rollover from overbought and will need to remain above the 52 level on the RSI to keep the bullish trend intact. If we do see a pullback I’d monitor the 21-day EMA and lower line of the ascending channel around the 51 150 level.
Related articles
.jpg?height=420)
Ready to trade?
It's quick and easy to get started. Apply in minutes with our simple application process.
The material provided here has not been prepared in accordance with legal requirements designed to promote the independence of investment research and as such is considered to be a marketing communication. Whilst it is not subject to any prohibition on dealing ahead of the dissemination of investment research we will not seek to take any advantage before providing it to our clients.
Pepperstone doesn’t represent that the material provided here is accurate, current or complete, and therefore shouldn’t be relied upon as such. The information, whether from a third party or not, isn’t to be considered as a recommendation; or an offer to buy or sell; or the solicitation of an offer to buy or sell any security, financial product or instrument; or to participate in any particular trading strategy. It does not take into account readers’ financial situation or investment objectives. We advise any readers of this content to seek their own advice. Without the approval of Pepperstone, reproduction or redistribution of this information isn’t permitted.