- English
- 简体中文
- 繁体中文
- ไทย
- Tiếng Việt
- Español
- Português
- لغة عربية
In recent weeks during the Covid-19 stock market crash, interest in both silver and gold trading has skyrocketed with big moves on each metal. This week has seen a bottoming formation on both pairs and strong bullish momentum, so let’s take a look at what has happened and what to potentially expect over the coming weeks/months.
5 major differences between gold and silver
Here are five major differences between gold and silver, which traders need to be aware of before trading them.
Volatility
Gold is often less volatile than silver and generally falls less than silver during a commodity bear market as a percentage, but will also rise less during a commodity bull market. When trading silver, selling your position after large bullish movements will generally be critical to long-term success.
Industry
Silver is more widely used in the commercial landscape than gold, with over 56% of supply being used in industry each year. Gold has around 12% of supply being used each year so to put it simply, during poor economic times, gold often rises because of its perceived safe haven status vs silver which is linked more closely with the health of the economy due to its widespread use.
Affordability
Silver is obviously more affordable than gold per ounce which has advantages if you are looking at putting less money into an investment. However, this affordability has little impact on the general markets.
Storage
Because of the value of silver vs gold and the quantity of each metal produced each year, silver has a much higher storage cost per dollar invested. If you are trading silver this should be of relatively little concern but it's still an important fact.
Government holdings
It is widely known several central banks around the world stockpile gold assets, and this helps keep the perceived value of gold higher in times of volatility. In comparison, silver is held in relatively small quantities by central banks and is more widely used than stored.
Gold vs the Dow Jones Industrial Average

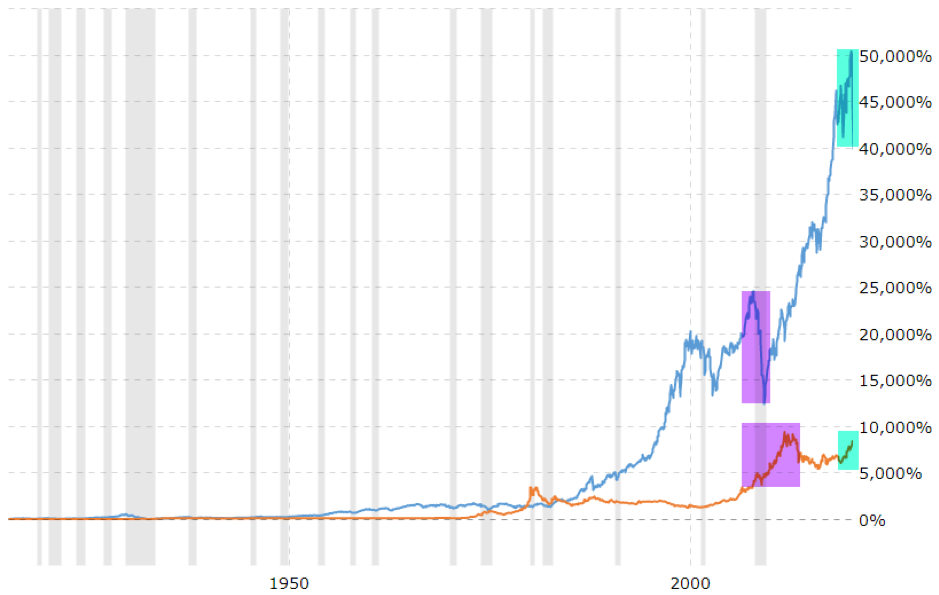
The chart above shows that gold has performed relatively well during periods of high volatility in the Dow Jones index. Often Gold is considered a partial hedge to economic uncertainty due to its perceived safe haven status, but in recent decades gold has significantly underperformed indices in terms of raw percentage returns.
The area highlighted in purple is the most interesting, as gold was already trending upwards before the global financial crisis happened in 2007. The strength continued during the GFC, even after the Dow Jones broke the bear trend, peaking at a price reached around the same time the Dow returned to its previous highs.
The area highlighted in green shows a similar trend from 2019 to the most recent crash, with gold strengthening throughout 2019 and continuing to strengthen during the current Covid-19 stock market crash. The question will be, will gold continue its uptrend well into and after the crisis as it did during the GFC?
Monthly gold flag pattern still intact

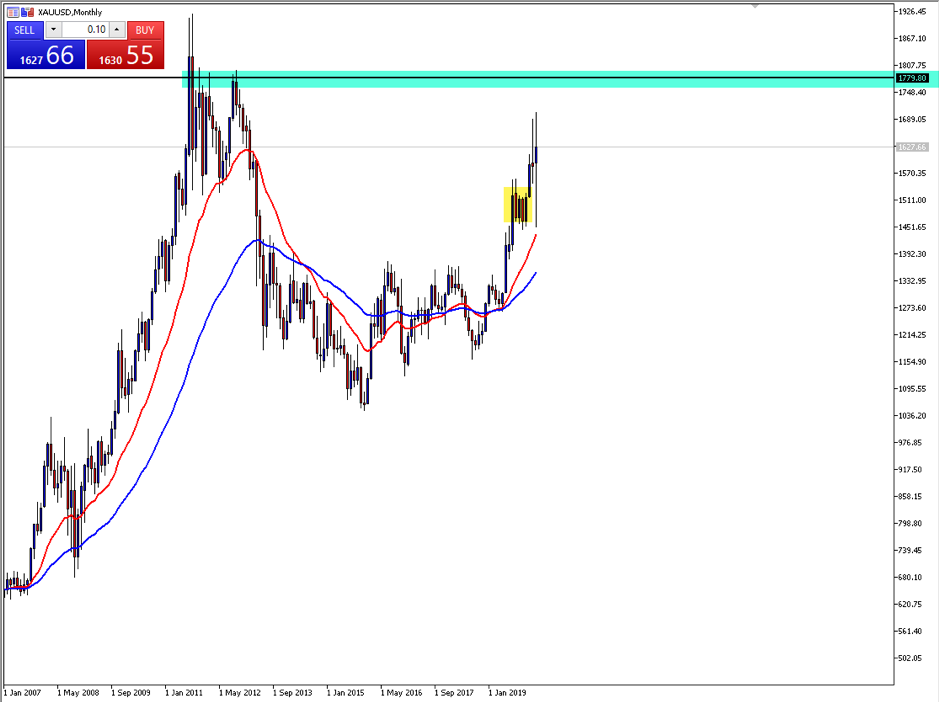
Several weeks ago, in our exclusive gold webinar and articles it was mentioned that a monthly flag pattern (highlighted in yellow) had formed, and that the expectation long term for such a pattern was the 1780 per ounce area highlighted in green. The last few weeks have shown some extreme volatility, but the longer-term trend has remained intact and the flag stop loss area was not breached.
Gold forms a base and breaks through a double bottom

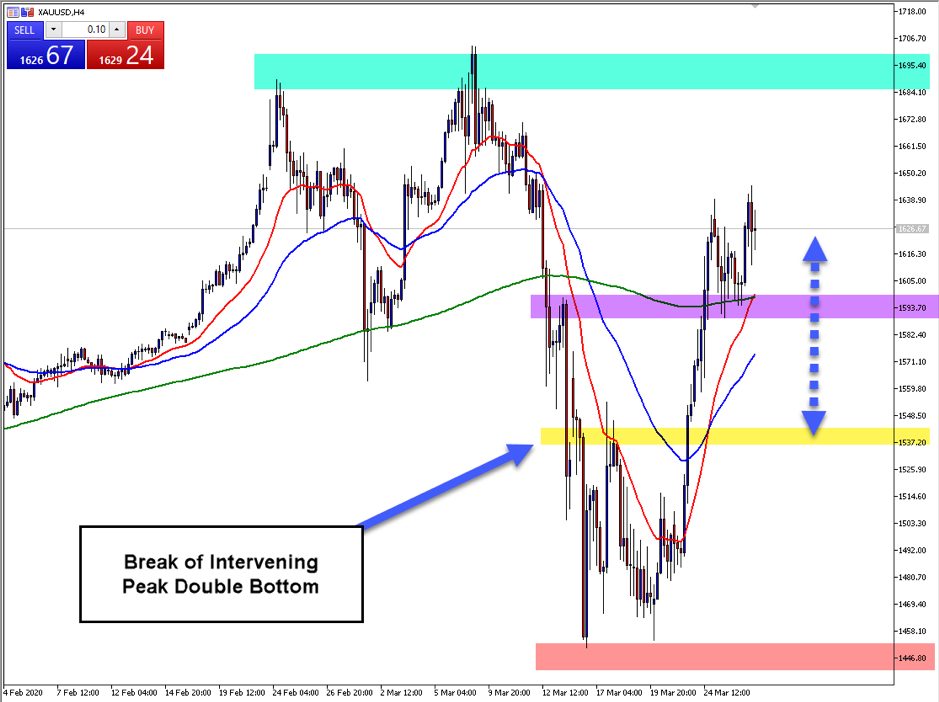
Gold reached lows of 1460 highlighted in red over the last two weeks, followed by significant purchasing of the metal, and bullish buyer momentum followed. Price then closed above the intervening peak at 1540 as highlighted in yellow, followed by the very quick completion of the double bottom pattern highlighted by the blue arrows.
Price has now retraced to the area highlighted in purple and found strong support, with the 200 moving average and 20 moving average acting as dynamic support. Now that price has made a new higher high, the level highlighted in green becomes the next technical target for gold.
While gold strengthens, silver hits a key zone

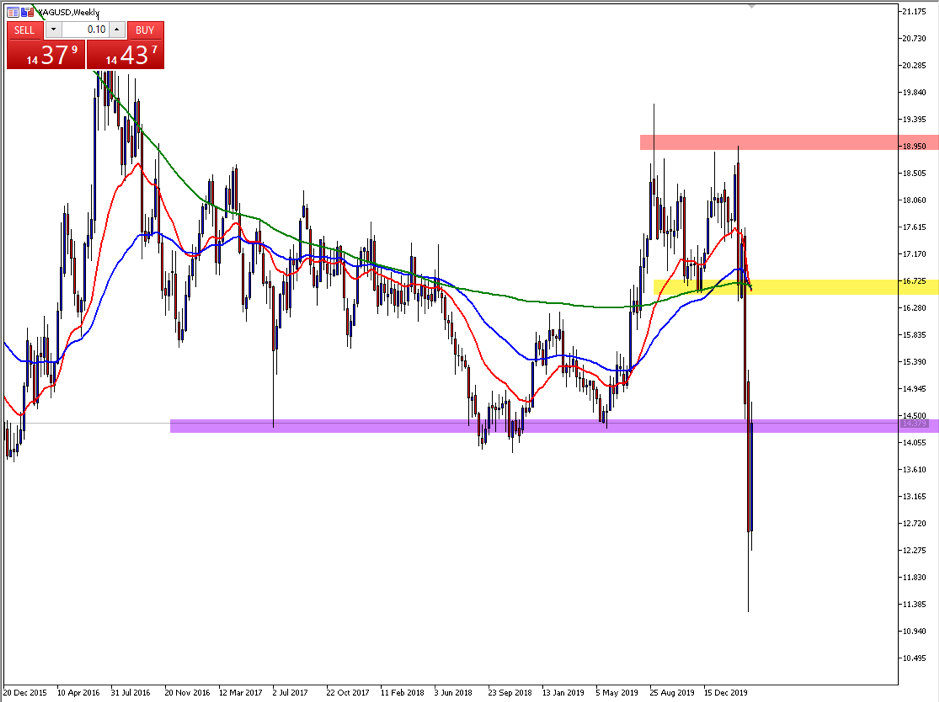
Silver’s weekly double top highlighted between the red and yellow zones on the chart above more than completed, with silver hitting significant lows at 11 dollars an ounce. As mentioned previously, silver has a tendency to react differently to gold, as much of silver’s worth is tied to its industrial use and the economic health of the global economy. The key area to watch for will be the 14.40 level. This area was previously incredibly strong support over the last few years, and you could expect some potential technical resistance at this zone. (highlighted in purple)
Which is the better metal to trade during stock market crashes?
While the similarities are clear between gold and silver, so too are the differences. Gold may be viewed as volatile, but the volatility present in silver is even higher during times of uncertainty. In terms of percentage movements, silver will generally provide larger returns each way while the price is partially tied up with the current worldwide economic outlook. On the other hand, gold is still considered a partial hedge against economic uncertainty. The answer to this question depends on whether a trader believes greater volatility equals greater opportunity.
The material provided here has not been prepared in accordance with legal requirements designed to promote the independence of investment research and as such is considered to be a marketing communication. Whilst it is not subject to any prohibition on dealing ahead of the dissemination of investment research we will not seek to take any advantage before providing it to our clients.
Pepperstone doesn’t represent that the material provided here is accurate, current or complete, and therefore shouldn’t be relied upon as such. The information, whether from a third party or not, isn’t to be considered as a recommendation; or an offer to buy or sell; or the solicitation of an offer to buy or sell any security, financial product or instrument; or to participate in any particular trading strategy. It does not take into account readers’ financial situation or investment objectives. We advise any readers of this content to seek their own advice. Without the approval of Pepperstone, reproduction or redistribution of this information isn’t permitted.
