5 Essential Charts That Are Front Of Mind

NAS100 – on a march to 17k
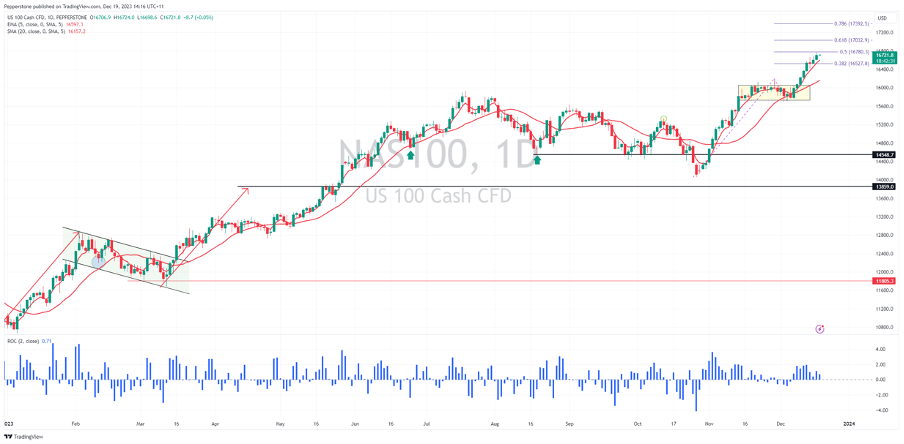
Despite various Fed members (Goolsbee, Bostic and Mester) putting out views around their call on rates for 2024, or pushing back on market pricing, the NAS100 refuses to cave and pushes further higher. Fundamentals really matter little at this stage, and the moves are driven by investor flows and FOMO capital. Some have said this is one where you either jump on the bull trend or simply get out of the way, where shorting of late has been costly. The prospect of a decent bout of profit-taking and flush out of extended longs is clearly growing and while classic oscillators, such as the RSI, flash extremes, so too do the market internals – here, we see 90% of NAS100 companies above their 50-day MA, 22% at 52 weeks and 40% with an RSI above 70. Maybe that 5% drawdown comes in early 2024, perhaps it comes post VIX expiration (17 Jan), but when it comes it will pay to be closest to the exit when the fire breaks out.
Market Excess Liquidity – the oxygen in the market’s lungs
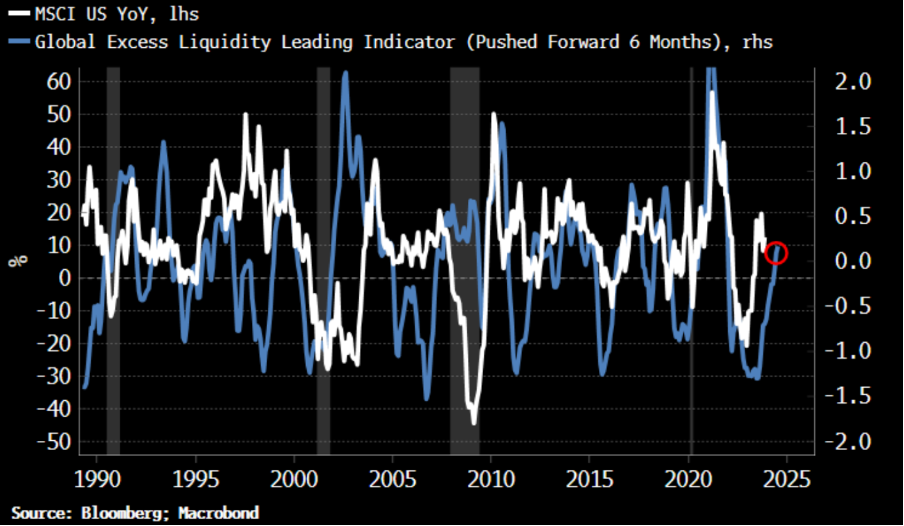
(Source: Bloomberg)
Over the past two years, many have played around with liquidity models that try to explain equity returns, typically involving aspects of the Fed’s balance sheet. This model (from Bloomberg analyst Simon White) involves looking at the difference between M1 growth and economic growth in the G10 region in USD terms. The recent bear trend in the USD has partly helped the level of excess liquidity and seems to neatly explain support in risky assets, such as equity. Many have also focused on the rise in US bank reserves since September, while China has been flooding the markets with liquidity using its repo and MLF facility. These have been seen as risk positive factors.
As with any one-way move in markets, many try to explain the moves with reasoning; where all roads typically lead to changes in system liquidity, as we can see in this chart. Let’s not forget that while we can get funky with models they are often overfitted – but for traders price is always true, it’s what we trade, and we can cut our craft by keeping things simple, reacting to price, and managing risk around this.
Brent Crude – transport concerns in the Red Sea offering upside risk to black gold
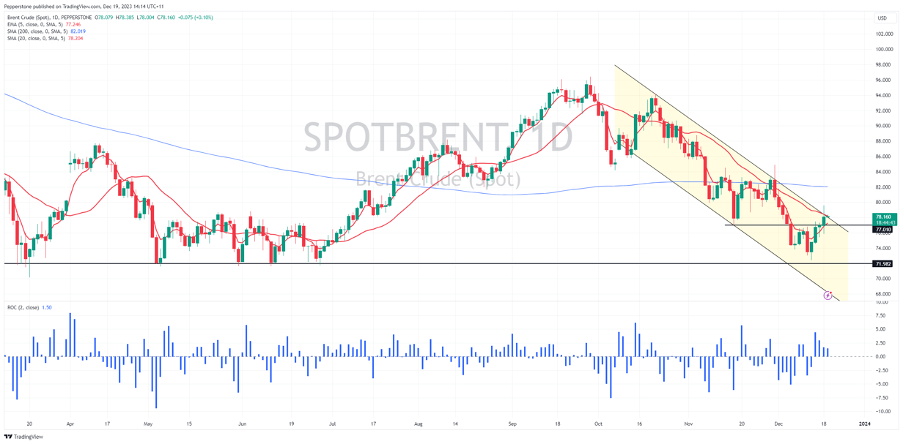
The market is watching supply disruptions in the Suez Canal, a route which records close to 12% of global trade. Headlines that multiple major shipping companies will stop transporting through this channel is dynamic and could impact in the near-term. In the prior session, we saw a sizeable reaction in EU TFF gas prices, but traders are also expressing supply concerns through long brent crude positions, where we saw our spot price trade above $79. Reports a US led naval presence is to head the Red Sea may limit the upside, but there has been momentum building and we see price (on the daily) threatening to break channel resistance – a break of trend resistance and the 20-day MA, may suggest the 200-day MA as a target for those who choose to trade with them.
Let’s also not forget the influence the recent fall in energy prices has had on macro markets, with the move lower in crude having a strong influence on the bond markets pricing of lower expected inflation. A sustained rise in crude could therefore become problematic for risk.
Small cap stocks to outperform large caps in 2024 – time for mean reversion?
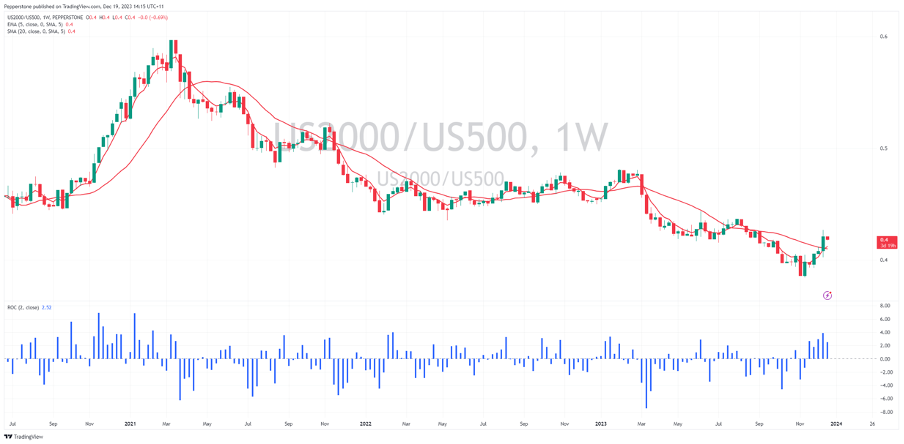
It has become a consensus view from the sell side that US small cap equities will have their time to shine in 2024 and will outperform US large caps equities. Consensus trades always worry, but the logic is sound. There are several reasons behind this thesis, but primarily this stems from a multi-year underperformance, a compelling relative valuation, and saturation of ownership (mega-cap names are massively over owned). Also, in an environment of lower rates, we should see reduced balance sheet concerns, notably around interest expense on borrowings. Lower bond yields may also take some of the pressure off mid- and regional US banks’ balance sheets which have been in the spotlight due to the level of bonds held to maturity.
While a US recession would be a massive headwind for small caps, if we do indeed get the soft landing priced by markets and the Fed ease the fed funds rate 3 to 4 times in 2024, the idea is small caps should claw some of that sizeable underperformance back. Ways to express this view are through long/short strategies, notably long US2000 / short US500, or long IWM ETF (Russell 2000 ETF) / short SPY ETF (S&P500 ETF).
EURAUD – divergence could be golden
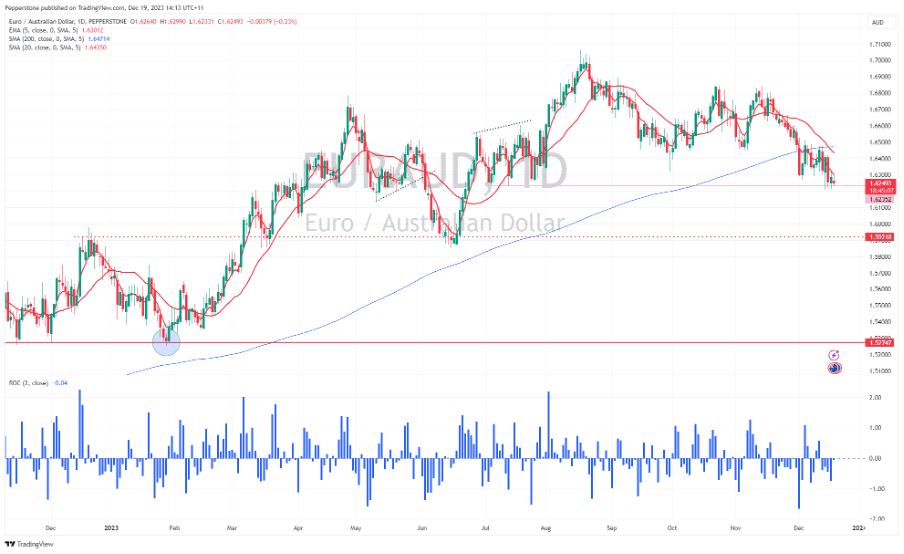
While the ECB are yet to align with the path of rate cuts priced into EU swaps pricing for 2024, it's clear that the market has incredibly high conviction they are coming from Q124. The RBA, on the other hand, could still hike rates in the February meeting, but that is fully conditional on the outcome of the Aus Q1 CPI print (due 31 January). The unemployment rate was also a growing concern and was a key reason for the RBA leaving rates unchanged, so the RBA will be assessing the Dec employment report (due 18 Jan). Either way, there are serious question marks about whether the RBA will cut rates in 2024, while the ECB have clear scope to start easing sooner. The EUR has recently been seen as a ‘recovery’ play, but that feels too premature at this stage and should revert to being a funding currency.
Both Europe and Australia benefit from a better feel towards China assets – should it happen in 2024 – but the AUD will outperform the EUR on this theme. Technically, the AUD looks the stronger play in the short-term and a breakthrough 1.6240 should be a momentum trigger for a deeper move below 1.6000. A trade to express now, and certainly in 2024.
Related articles


The material provided here has not been prepared in accordance with legal requirements designed to promote the independence of investment research and as such is considered to be a marketing communication. Whilst it is not subject to any prohibition on dealing ahead of the dissemination of investment research we will not seek to take any advantage before providing it to our clients.
Pepperstone doesn’t represent that the material provided here is accurate, current or complete, and therefore shouldn’t be relied upon as such. The information, whether from a third party or not, isn’t to be considered as a recommendation; or an offer to buy or sell; or the solicitation of an offer to buy or sell any security, financial product or instrument; or to participate in any particular trading strategy. It does not take into account readers’ financial situation or investment objectives. We advise any readers of this content to seek their own advice. Without the approval of Pepperstone, reproduction or redistribution of this information isn’t permitted.