How to trade market breakouts
Trading market breakouts is a popular and effective strategy, but it requires precision, patience, and understanding. This guide provides a comprehensive overview of breakout trading strategies, risk management, and key practices.

Understanding market breakouts
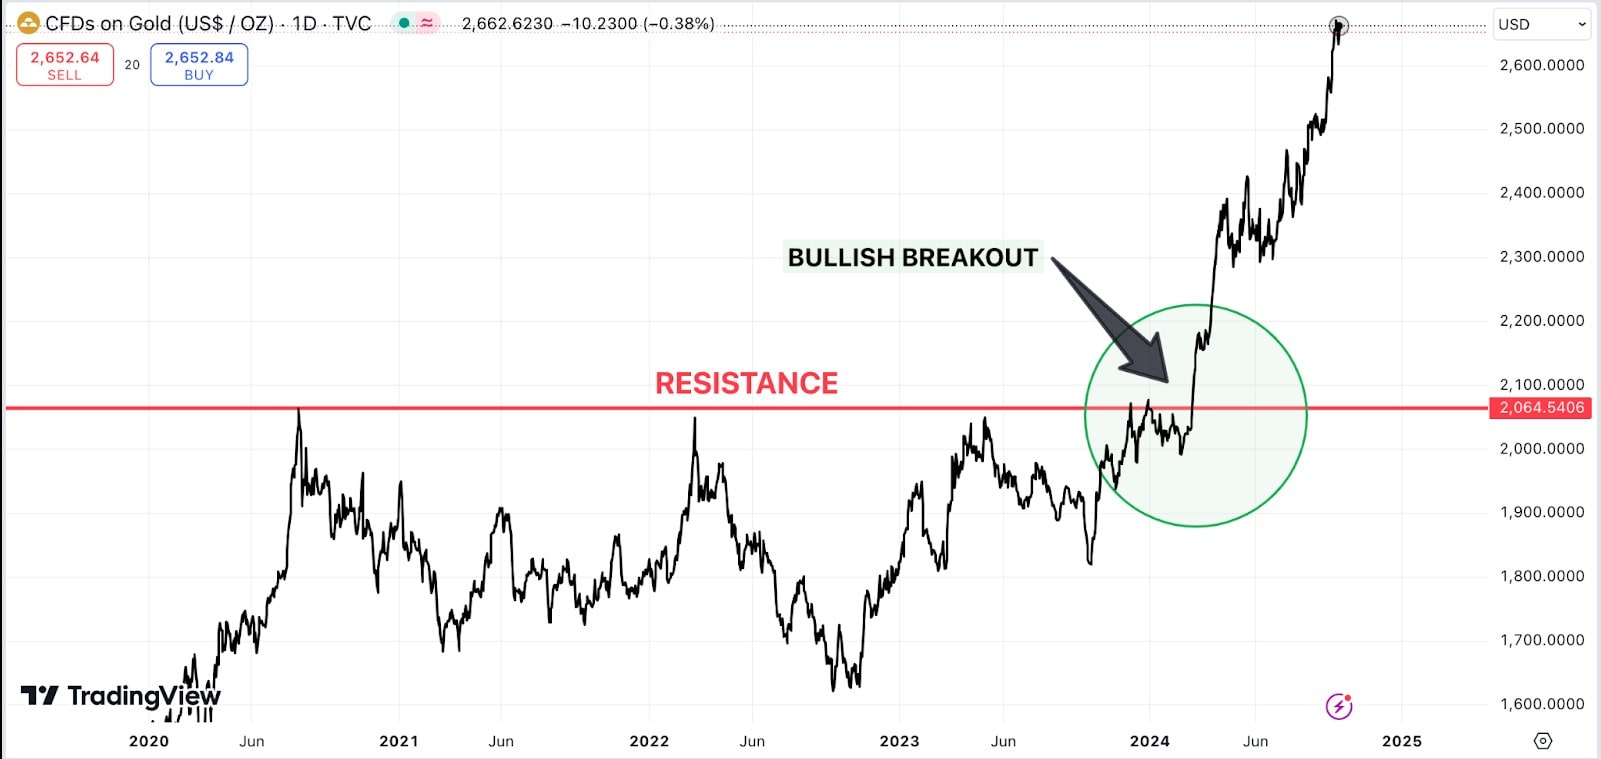
A market breakout occurs when the price of an asset moves beyond a defined support or resistance level with increased momentum. It often signals the potential for a new trend in the direction of the breakout. Traders look for breakouts because they can indicate a strong shift in market sentiment, often leading to sharp price movements.
Resistance: A price level on a chart signified with a horizontal trend line that identifies a high probability area where sellers are located based on prior behaviour.
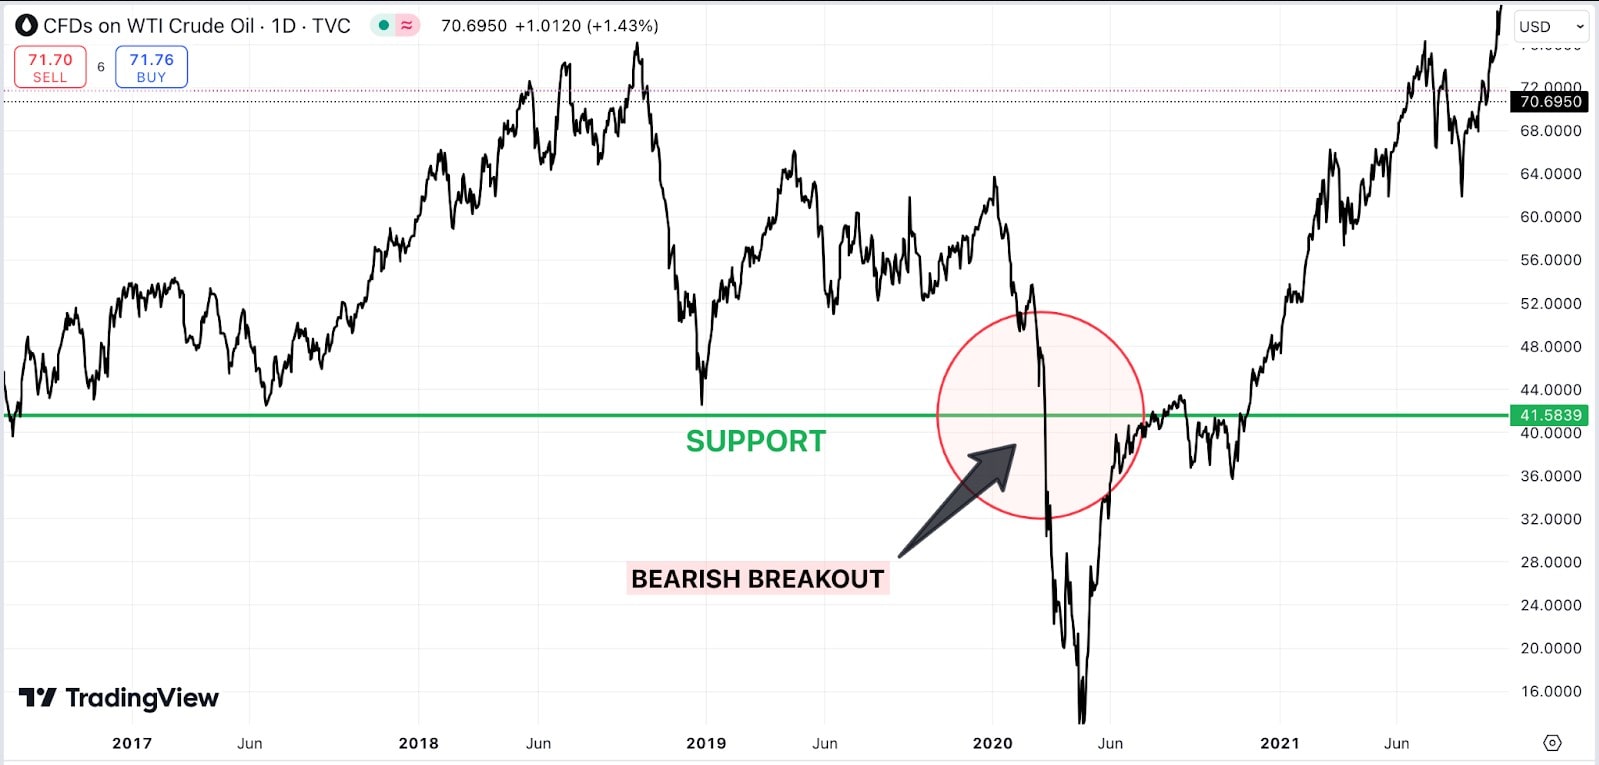
Support: A price level on a chart signified by a horizontal trend line that identifies a high probability area where buyers are located based on prior behaviour.
Be aware that trend lines identify ZONES of support and resistance as opposed to exact prices.
Breakouts can occur in both directions:
Bullish Breakout: When the price moves above a resistance level.
Bearish Breakout: When the price falls below a support level.
Confirming breakouts with volume
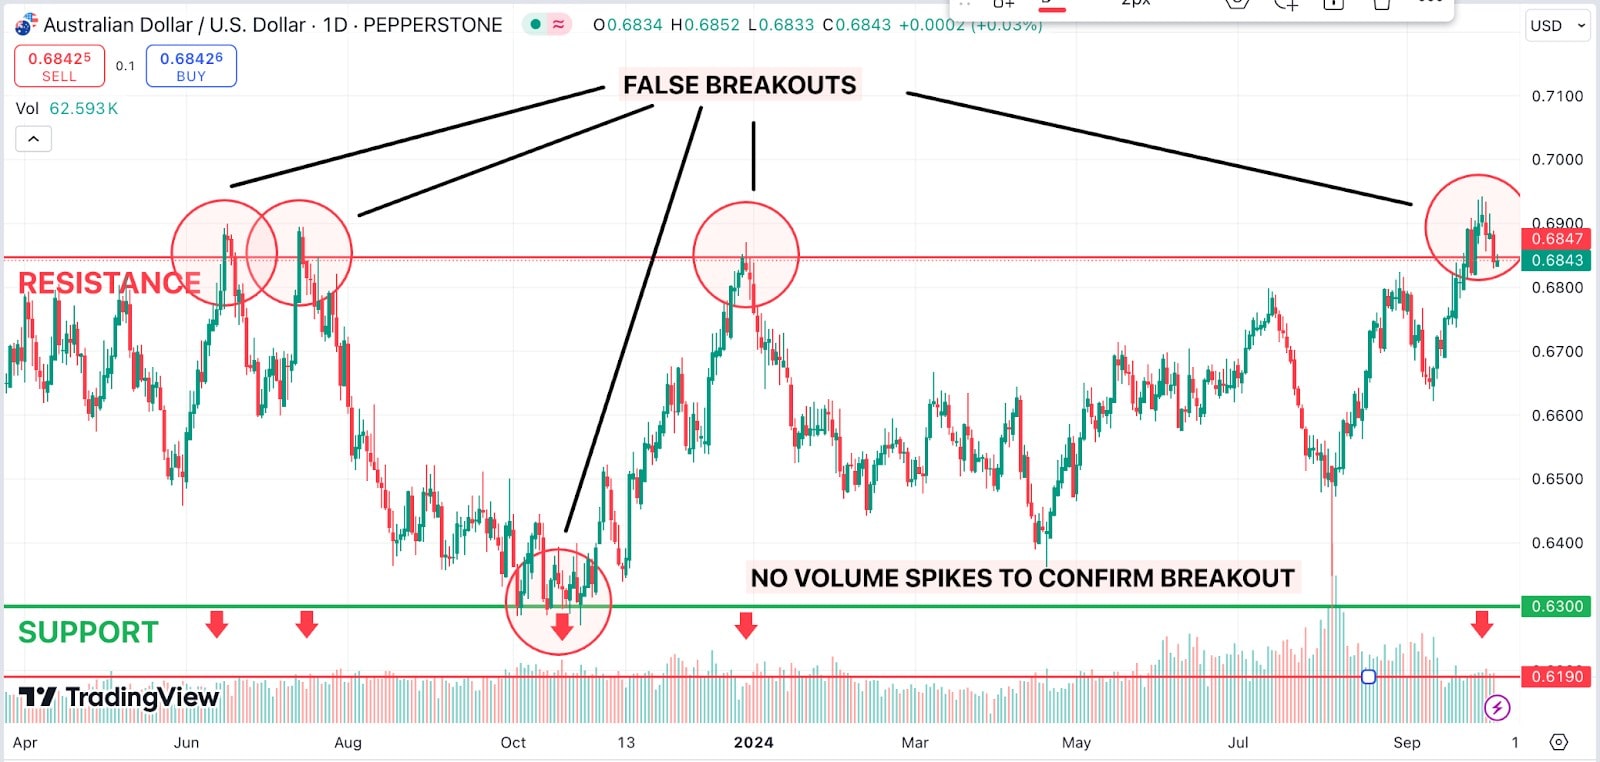
Volume is a critical factor in confirming breakouts but it should not be used alongside other indicators. While High volume on a breakout indicates strong conviction in the move, suggesting a higher chance of sustainability, it does not guarantee success, as false breakouts can still occur even with elevated volume. Conversely, low volume may signal limited support for the move, increasing the potential for a reversal.
High Volume: Confirms market participation, indicating strength behind the price movement.
Low Volume: Signals potential weakness or lack of market interest, increasing the risk of reversal.
To improve breakout confirmation, traders often compare the breakout day’s volume with the average trading volume over previous days or weeks (see ‘low volume period’ indicated on the chart above). A significant spike in volume increases the likelihood of a legitimate breakout.
False breakouts
False breakouts occur when the price briefly moves beyond support or resistance but quickly reverses direction, trapping traders who entered the market too early. Recognising false breakouts is critical to minimising losses.
Signs of False Breakouts: Low volume, lack of follow-through after the initial breakout, or immediate reversals.
Avoiding False Breakouts: Wait for a confirmed close beyond the breakout level, ideally accompanied by a substantial increase in volume to strengthen the breakout signal. Additionally, consider using confirmation indicators like moving averages or RSI to improve accuracy, while remaining aware that these lagging indicators may not fully account for rapid market reversals, which can increase risk in volatile conditions.
The role of market volatility
Volatility measures the rate at which the price of an asset changes and is a key factor in breakout trading. While breakout trading is often more effective in volatile markets, where price movements are pronounced and can present greater opportunities for gains, higher volatility also introduces increased risk. Price swings can be sudden and significant, leading to rapid reversals that can result in substantial losses if not managed carefully.
High Volatility: Leads to larger price swings, potentially amplifying profits and losses.
Low Volatility: Can result in breakouts lacking follow-through, limiting potential gains.
Risk management strategies should be adjusted depending on the volatility of the market. Balancing the pursuit of gains with the increased risk that comes with volatility is essential.
Risk management strategies
A simple risk management strategy for breakout trading should include the following:
- Limit Risk: Risk only 1-2% of your total trading account on each trade.
- Set Stop Loss: Place a stop loss just beyond the breakout level to guard against false moves.
- Use ATR: Use the Average True Range (ATR) to help determine a safe distance for your stop loss. (see ‘Setting Stop Loss Levels’ below)
- Risk/reward: Target a reward that is at least twice what is being risked (1:2 risk-reward).
- Take Partial Profits: Secure some profits at key levels to lock in gains.
- Adjust Stops: Move stop losses to lock in profits as the trade goes in the desired direction.
- Stay Disciplined: Stick to a plan and keep it simple to manage risk effectively.
Setting Stop-Loss Levels
A stop-loss order is designed to limit a trader's loss on a position by automatically closing the trade if the price moves against them. It’s essential to set stop-loss levels carefully in breakout trading.
Below Support/Above Resistance: For bullish breakouts, place the stop-loss below the previous support level. For bearish breakouts, position it above the previous resistance level.
ATR Method: Use the Average True Range (ATR) indicator (available on TradingView charting software) to calculate stop-loss levels. There isn't a specific number to focus on for ATR, as it varies based on the asset and its historical volatility. Instead, traders use ATR to compare current volatility to past levels. A higher ATR suggests greater volatility, so traders adjust their strategies accordingly, like widening stop-losses during higher volatility or tightening them during lower volatility. ATR is best used in relative terms rather than focusing on a fixed number.
Examples
Bullish Breakout Stop-Loss Positioning
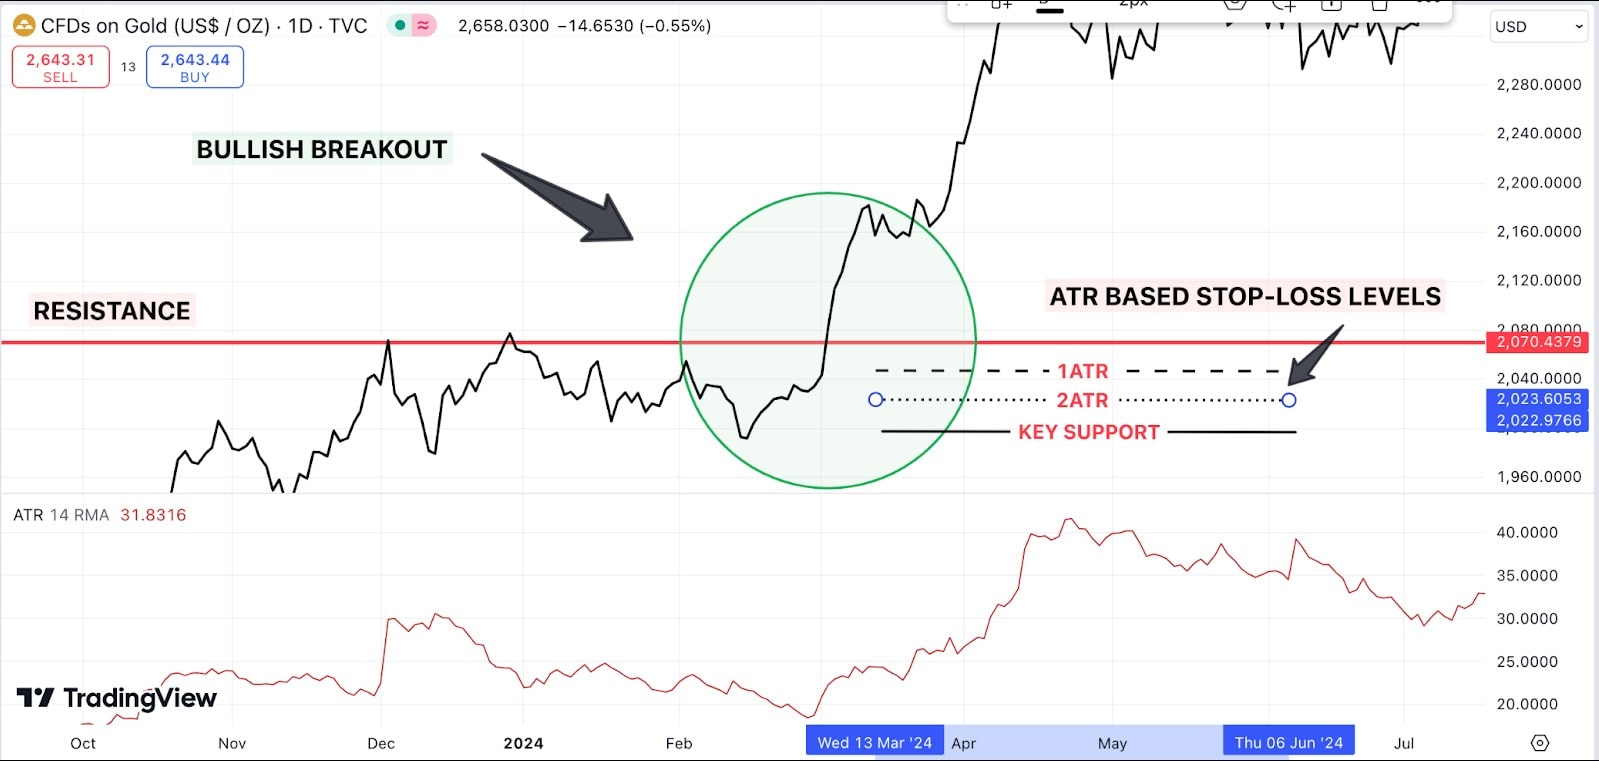
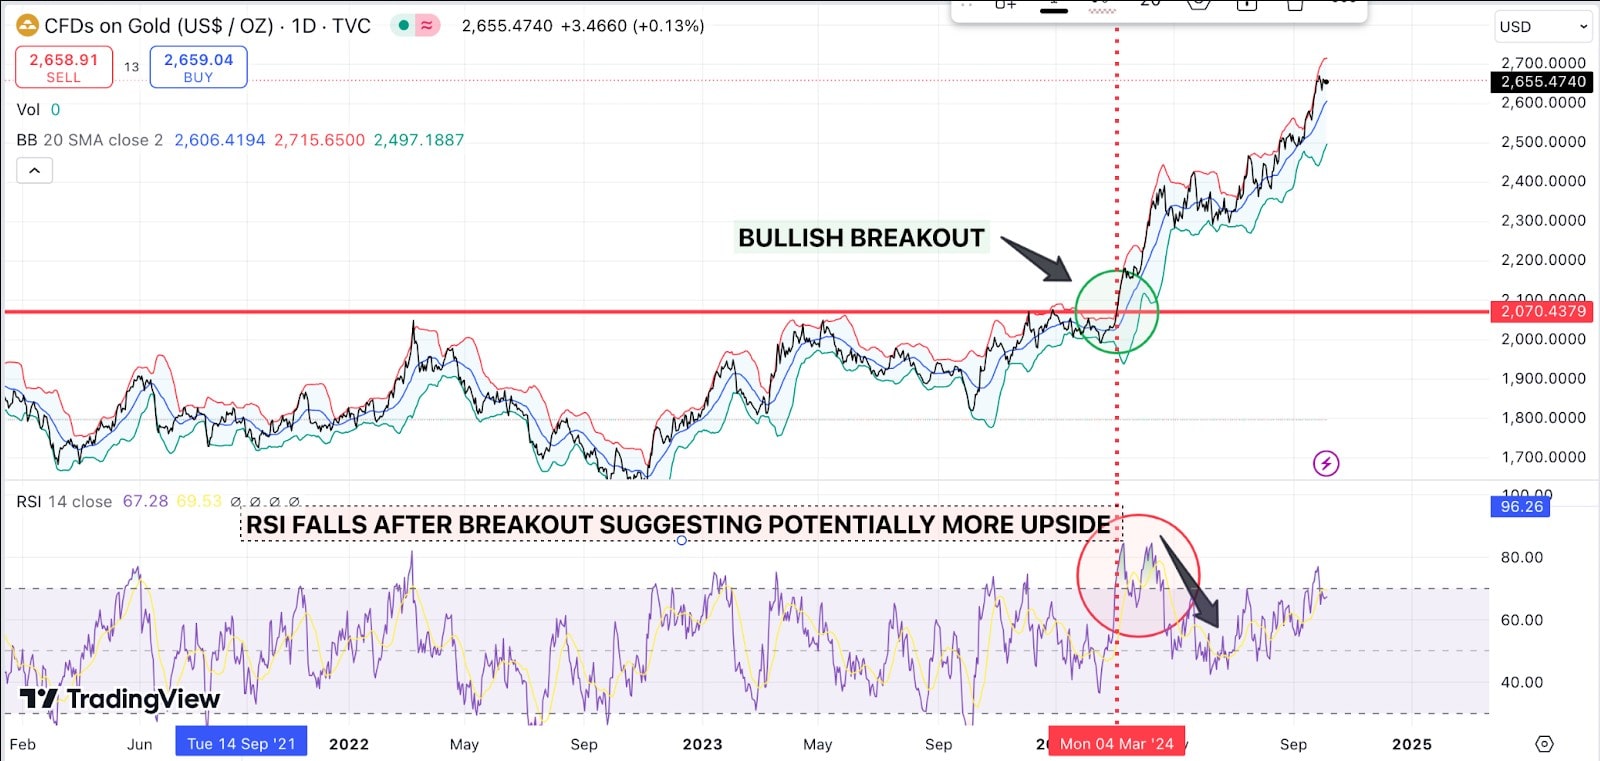
The chart shows a clear bullish breakout above the marked resistance level at around $2,070. When placing a stop loss in this scenario, consider positioning it slightly below the breakout point to provide a cushion against potential pullbacks.
A stop loss could be placed just below the previous resistance level ($2,070), such as around $2,050–$2,060, to protect against a false breakout. Alternatively, for a more confident approach, placing the stop loss near a key support area below the breakout, perhaps around the psychological $2,000 figure, might give more room for volatility but increase risk.
The exact placement depends on risk tolerance and trading strategy. Using the ATR can also guide the stop loss placement by accounting for typical price fluctuations. For instance, placing the stop loss 1-2 ATRs below the breakout level can provide a volatility-adjusted buffer.
If the ATR is 23.00 on entry ($2,070), stop loss levels can be calculated based on 1-2 ATR from the entry point. Using this method, the suggested stop loss levels would be:
1 ATR Stop Loss:
2070 - 23.00 = 2047.00
2 ATR Stop Loss:
2070 - 2 x 23.00 = 2024.00
These levels provide a volatility-based buffer, helping to manage risk according to market conditions.
Bearish Breakout Stop-Loss Positioning
The bearish breakout occurs at the green support level (around $41.08). A typical placement would have been just above the recent high or breakout level. Given the previous price action, a stop loss would have been considered 1 to 2 points above the breakout point. For example, placing the stop loss around $44.00 to $44.50 would have given enough room for volatility but still protect against a significant reversal.
If the ATR was 3.10 entering on the bearish breakout near the support line (around $41.08):
1 ATR Stop Loss:
41.08 + 3.10 = 44.18
2 ATR Stop Loss:
41.08 + 2 x 3.10 = 47.28
These levels would have given some flexibility above the support line to account for normal volatility while protecting against a potential false breakdown.
Setting take-profit levels
Take-profit levels are equally important for locking in gains. These levels help traders exit a position once it reaches a predetermined price target, preventing greed from eroding profits.
Support/Resistance Zones: Use previous support or resistance levels to determine potential price targets.
Measured Move: Calculate the expected price move based on the height of the previous price range. For instance, if the asset broke out of a $25 price range, the target could be a $25 move in the breakout direction (see chart below).
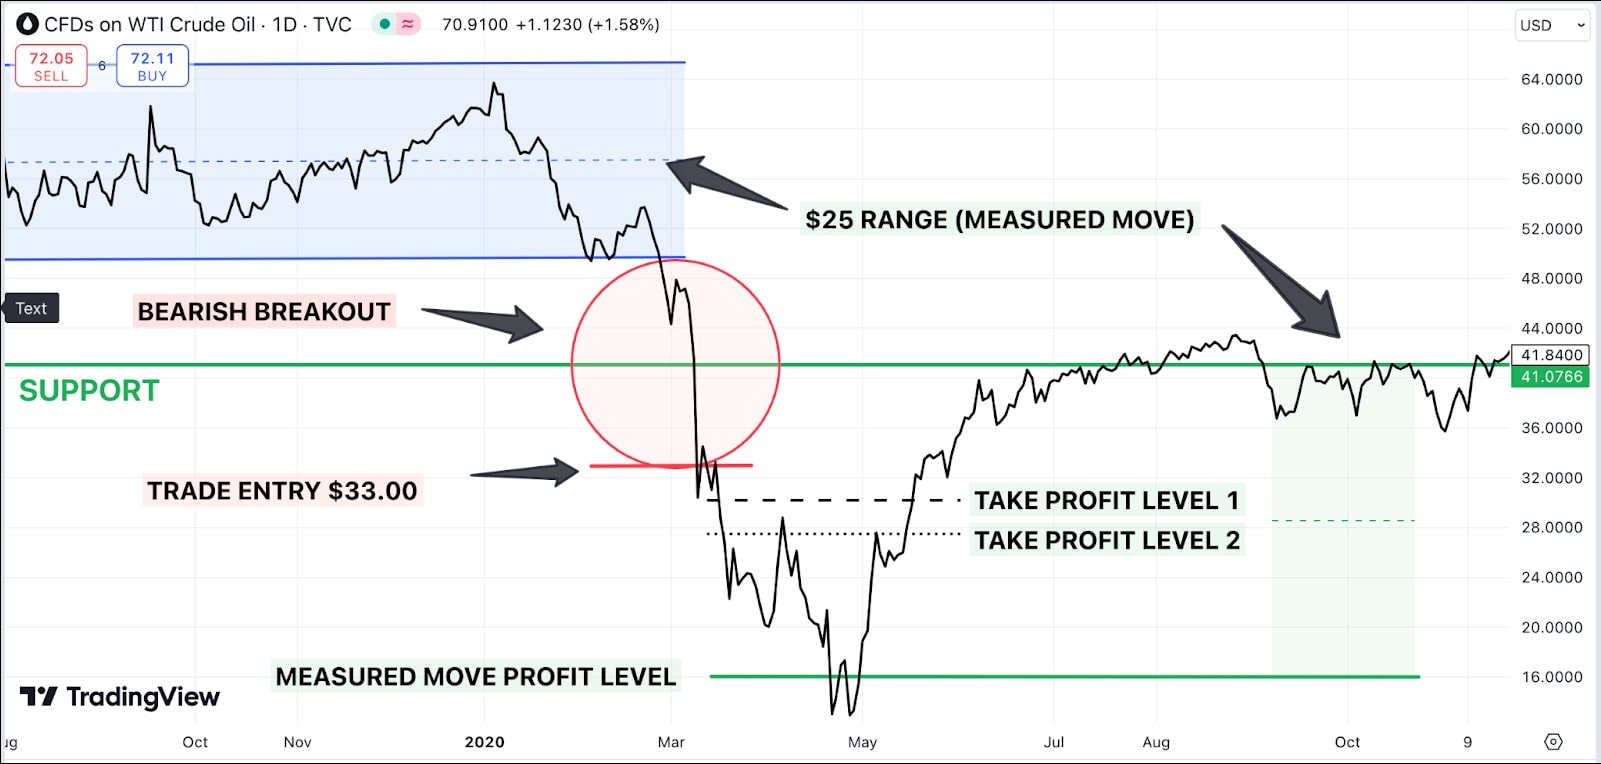
Based on the above chart, if the trade was entered at $33.00 after a bearish breakout, normal take profit levels would have been identified by key support zones where the price may have been expected to find resistance or bounce.
First Take Profit Level: Set at the nearest support level below the entry point. In this example a potential target would have been around the round figure of $30.00, where the price eventually found some small support before breaking lower.
Second Take Profit Level: For a longer-term target, $28.00 would have been considered, in expectation of an extended reaction.
These take profit levels were based on historical price action and potential support zones. Setting these levels allowed for systematic profit-taking as the price moves downward after the bearish breakout in this instance. Adjusting the targets as market conditions change can further optimise a trading strategy.
Advantages / disadvantages of breakout strategies
Advantages
- High Gain Potential: Breakouts can lead to strong trending movements, offering significant opportunities for returns.
- Clear Entry Points: Breakouts provide clear entry signals when the price moves beyond support or resistance levels.
- Momentum-Driven: Breakout trades align with the momentum of the market, making it easier to ride strong trends.
Disadvantages
- False Breakouts: Not every breakout leads to a sustained trend. Traders can be caught in false breakouts, leading to losses.
- High Volatility Risk: While volatility can amplify profits, it also increases the risk of sharp price reversals.
- Requires Constant Monitoring: Breakout trades often develop quickly, requiring traders to be vigilant in monitoring the markets.
Timeframe considerations for trading
Breakout trading can be applied across all timeframes, from intraday charts to long-term charts. Choosing the appropriate time frame depends on trading style and the time that can be dedicated to monitoring trades.
- Short-Term (Intraday): Focuses on quick breakouts and requires active monitoring. Suitable for day traders looking for fast-paced trades.
- Medium-Term: Traders hold positions for days or weeks, focusing on more significant breakout levels on daily charts.
- Long-Term: Long-term traders rely on weekly or monthly charts, aiming to capture major breakout trends that unfold over months.
Common pitfalls to avoid
Breakout trading can be profitable, but it’s essential to be aware of common mistakes that can lead to losses:
- Chasing Breakouts: Entering a trade too late can lead to increased risk exposure, as the price may reverse shortly after entry.
- Ignoring Volume: Trading breakouts without considering volume increases the risk of falling for false breakouts.
- Overleveraging: Using excessive leverage can amplify both potential gains and losses especially in volatile conditions where rapid price swings are common.
Overtrading
Overtrading can occur when traders constantly look for breakout opportunities, leading to exhaustion and poor decision-making. Limiting trades to only the most promising setups helps preserve capital and maintain mental clarity.
- Risk of Overtrading: Increases transaction costs, reduces focus, and increases exposure to unnecessary risks.
- Avoiding Overtrading: Stick to a trading plan and avoid forcing trades. Focus on high-quality breakout opportunities that align with a pre-determined strategy.
Practical tips for traders
Breakout trading requires patience, discipline, and a solid understanding of market conditions. Following these tips helps avoid placing impulsive trades and ensures an adherence to the plan:
- Be Patient: Wait for clear breakouts and confirmation before entering trades.
- Use Multiple Timeframes: Check multiple timeframes to confirm the strength of a breakout and align trades with the dominant trend.
- Stay Informed: Keep up with market news and economic events that can influence market volatility and breakout potential.
Utilising technical indicators
Technical indicators can help confirm breakouts and reduce the likelihood of false signals. Common indicators used in breakout trading include:
- Moving Averages: Helps identify trends and can confirm breakouts when the price crosses above or below the moving average.
- Relative Strength Index (RSI): Indicates overbought or oversold conditions, helping to determine if a breakout is sustainable (see chart below)
- Bollinger Bands: Shows volatility, with price movements beyond the bands often signalling a potential breakout.
Developing a trading plan
A successful breakout trading plan requires discipline and a clear process. Below is a clear and concise 8-step plan:
Step 1: Identify the Setup
Look for key support/resistance levels and consolidation patterns like triangles or ranges. Price should be consolidating near these levels, signalling a potential breakout.
Step 2: Confirm the Breakout
Wait for a breakout with a strong close below support/ above resistance and increased volume to confirm validity, reducing the risk of false breakouts.
Step 3: Entry Strategy
Enter after confirmation of the breakout or wait for a retest of the breakout level for added security.
Step 4: Stop Loss Placement
Place stops just beyond the breakout support or resistance or use the Average True Range (ATR) to account for volatility.
Step 5: Target Setting
Set targets based on prior levels of support and resistance and consider taking partial profits at multiple levels.
Step 6: Risk Management
Maintain a favourable risk-reward ratio (e.g., 1:2) and keep risk per trade between 1-2% of total capital.
Step 7: Exit Strategy
Exit when targets are reached or if the breakout is invalidated and price re-enters the consolidation zone.
Step 8: Review and Adapt
Continuously review and adjust the plan based on performance and market conditions.
The material provided here has not been prepared in accordance with legal requirements designed to promote the independence of investment research and as such is considered to be a marketing communication. Whilst it is not subject to any prohibition on dealing ahead of the dissemination of investment research we will not seek to take any advantage before providing it to our clients.
Pepperstone doesn’t represent that the material provided here is accurate, current or complete, and therefore shouldn’t be relied upon as such. The information, whether from a third party or not, isn’t to be considered as a recommendation; or an offer to buy or sell; or the solicitation of an offer to buy or sell any security, financial product or instrument; or to participate in any particular trading strategy. It does not take into account readers’ financial situation or investment objectives. We advise any readers of this content to seek their own advice. Without the approval of Pepperstone, reproduction or redistribution of this information isn’t permitted.