How to trade the Dow Jones index
Explore key insights on the Dow Jones Industrial Average (DJIA), which consists of 30 large, publicly traded US companies. Learn how to implement different trading strategies, explore key market drivers, and apply effective risk management techniques.
What is the Dow Jones Industrial Average
The DJIA was created in 1896 to provide a simple and accessible measure of the performance of the US stock market and broader economy. It’s one of the world’s oldest and most widely followed stock market benchmarks, originally composed of just 12 companies, none of which are now part of the index. Today, the Dow Jones index includes 30 major companies across a range of industries and acts as an indicator of broader market health.
How the Dow is calculated and its key components
Unlike the S&P 500, which is weighted by market capitalisation, the Dow is price-weighted, meaning higher-priced stocks have a greater influence on its value, regardless of the company's actual size or market value.
When trading or analysing the Dow, it's important to remember that the impact of a stock on the index depends not on its market cap but on how high or low its stock price is relative to the others in the index. The exact weightings of the Dow components change regularly due to stock price fluctuations, but generally, the most significant stocks in the Dow include companies like Goldman Sachs, UnitedHealth Group and Microsoft, as their stock prices are higher compared to other constituents.
Example: How a stock’s price change can affect the Dow
Assume Home Depot’s stock is trading at $350 per share. If the price increases by $10 (from $350 to $360), the price-weighted calculation of the DJIA would be influenced significantly more than a smaller-priced stock like Walmart trading at around $90.
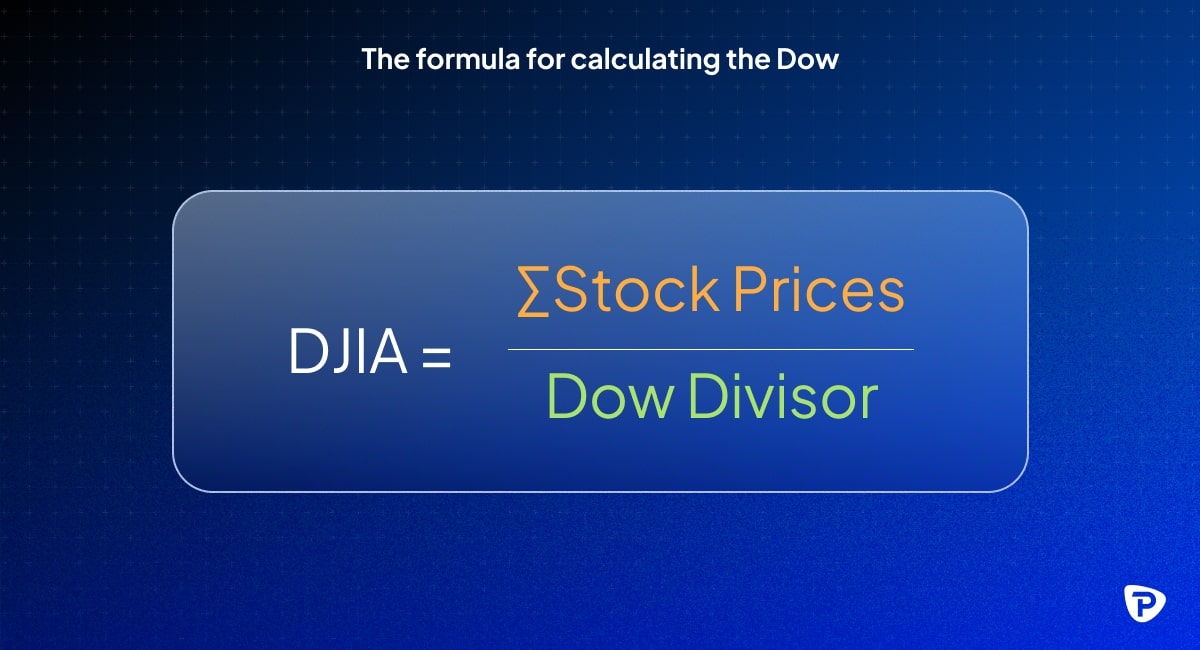
Step 1: Understanding the formula for price-weighted indices
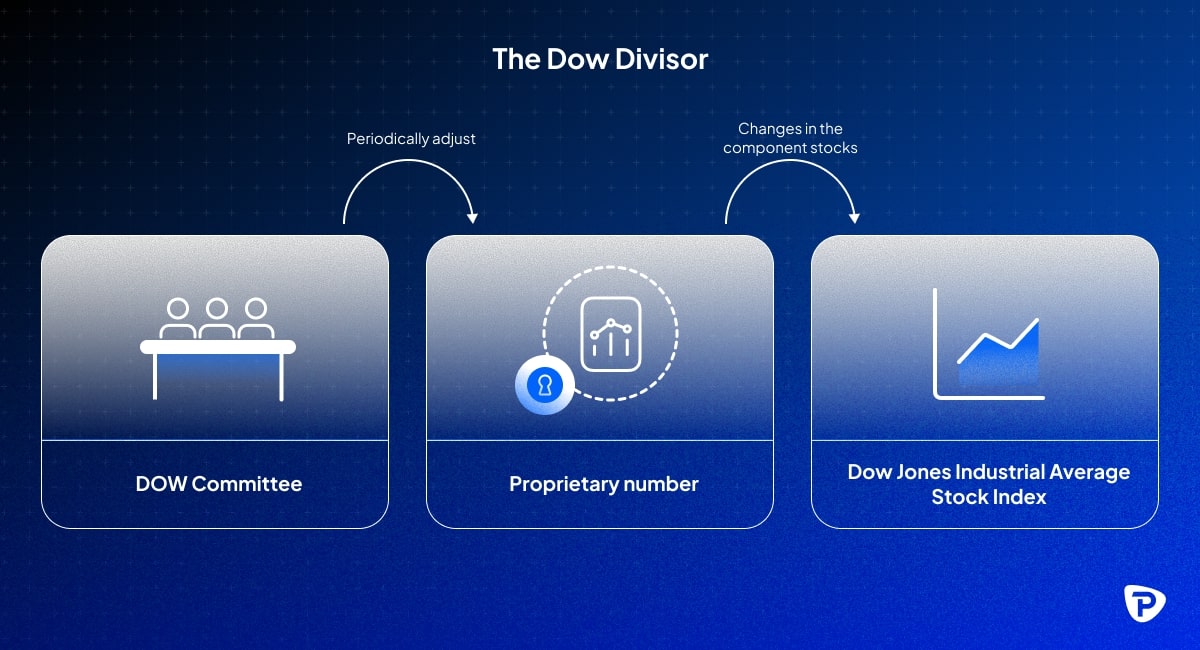
The Dow Jones is calculated by adding the prices of all 30 stocks and then dividing by the divisor, a special number used in the formula to ensure the index remains consistent over time.
The Dow Divisor is adjusted periodically to account for stock splits, dividends, and other structural changes. This prevents sudden artificial and misleading moves, keeping the index stable.
Step 2: How Home Depot’s $10 change affects the index
Assuming the total price of all the stocks in the index is currently $8,000. If Home Depot’s stock price increases by $10, the total price of all stocks in the Dow rises to $8,010.
Step 3: Calculating the impact
Assuming the divisor is now 0.147 (this changes over time), the impact of the $10 increase in Home Depot’s stock price can be calculated as:
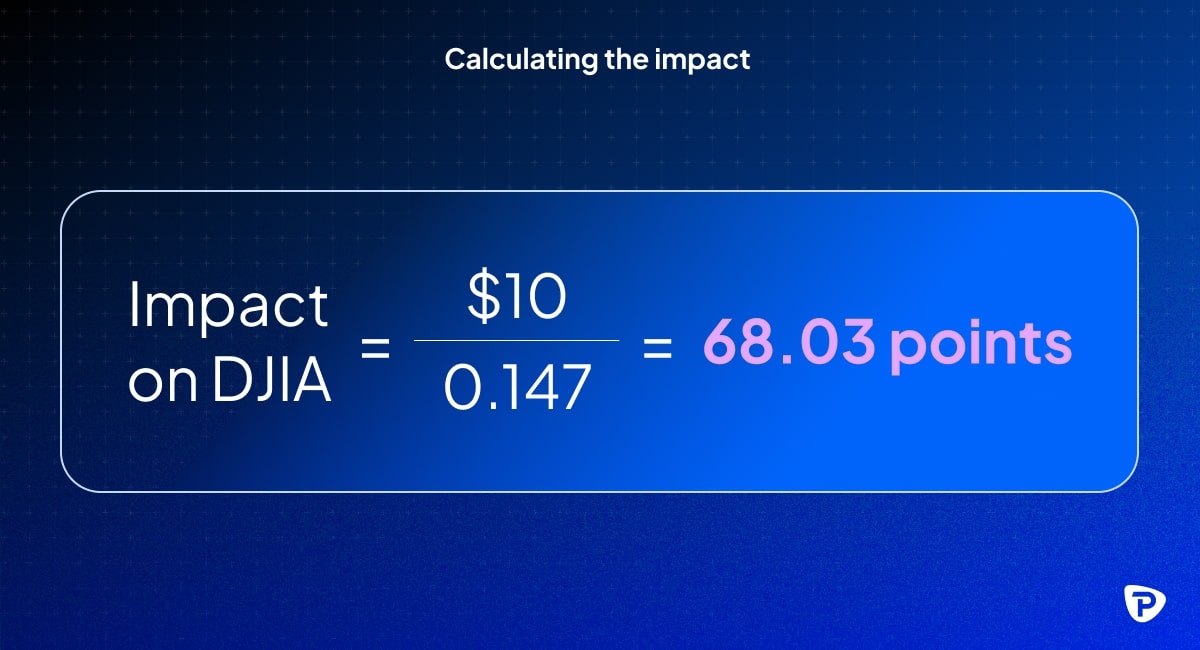
This means Home Depot’s price increase would add around 68 points to the overall Dow index.
A smaller stock with a lower price would have to see a much larger percentage change in price to have the same impact on the index. Thus, the Dow is more sensitive to movements in higher-priced stocks, which can sometimes lead to distorted views of the overall market performance.
Composition of the Dow
The Dow consists of 30 blue-chip companies chosen by the S&P Dow Jones indices committee. The list is updated periodically to reflect market and economic changes:
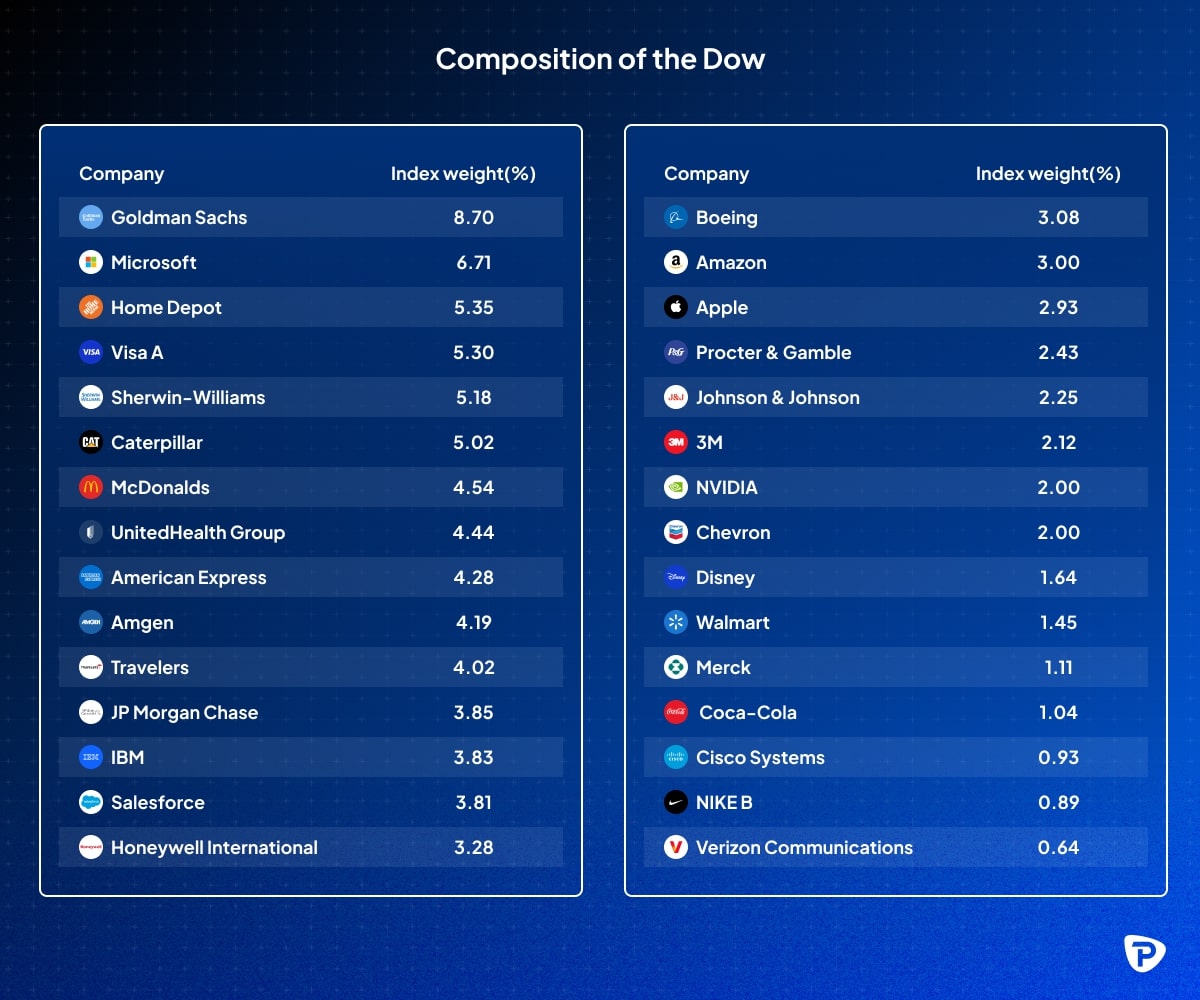
*Note: The stock prices and index weights are illustrative examples and may not reflect current market values. Data as of 3 June 2025.
Market instruments available to trade the Dow
There are several ways to trade the Dow Jones index, each with its benefits and risks:
- Exchange-traded funds (ETFs): ETFs typically track an index, sector, or group of assets and provide a simple way to gain exposure by owning shares in a fund that mirrors the overall performance of the market it represents. For the Dow Jones, options like SPDR Dow Jones Industrial Average ETF Trust (DIA) allow you to track the performance of all 30 stocks without buying them individually.
- Contracts for difference (CFDs): The Dow CFD allows speculation on price movements without owning the underlying stocks. Pepperstone offers a US30 CFD with leverage, extended trading hours, and competitive spreads. CFDs can be traded as cash (spot) or forward contracts, offering flexibility depending on your trading strategy.
All the above instruments involve significant risk, with leverage amplifying both potential gains and losses, leading to greater financial exposure.
Dow Jones trading hours
As the Dow is traded through different instruments, each comes with its own trading hours:
- Stock market hours: The NYSE and NASDAQ, where Dow components are listed, operate from 13:30 to 20:00 UTC (09:30 to 16:00 ET).
- Futures market: Dow futures trade nearly 24 hours a day from Sunday evening to Friday evening, with brief daily pauses. Trading for the Dow generally pauses between 20:15 and 21:00 UTC (16:15 to 17:00 ET). This break occurs between the close of the regular trading session on the stock market and the reopening of the futures market for the next trading day.
- CFD trading: At Pepperstone, Dow CFDs are available during extended trading hours, often similar to futures trading sessions. These extended hours allow traders to react to global news and economic events as they happen.
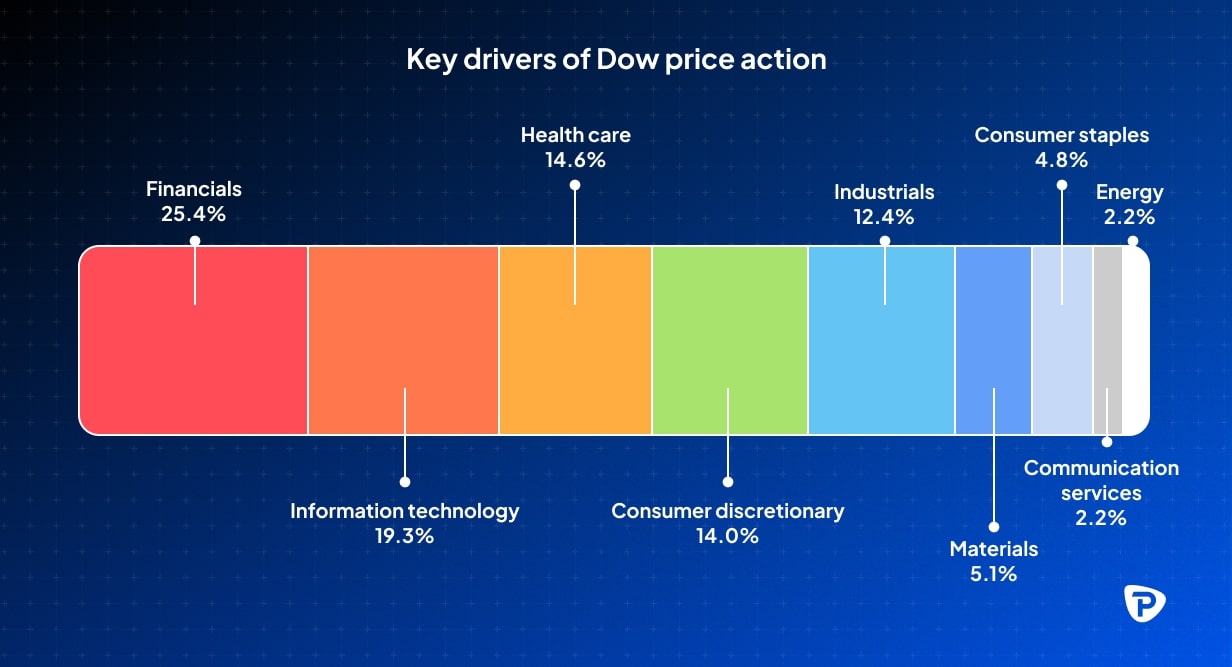
Key drivers of Dow price action
Understanding what influences the Dow's price movements can help you make informed trading decisions. The key factors include:
- Economic indicators: Reports on GDP growth, employment figures, and inflation shape market sentiment. Strong economic data often boosts investor confidence, while weak data can trigger selloffs.
- Corporate earnings: Quarterly earnings from Dow-listed companies directly impact the index. Strong earnings can drive stock prices higher, whereas disappointing results may lead to declines.
- Federal Reserve policy: Changes in interest rates, monetary policy, and bond-buying programmes influence stock prices. Rate hikes can weigh on equities, while rate cuts generally provide support.
- Global events: Political instability, trade disagreements, supply chain disruptions, and global crises (such as wars or pandemics) create uncertainty, leading to volatility.
- Market sentiment: Investor perception, measured by metrics like the Fear & Greed Index or VIX (volatility index), influences buying and selling behaviour. Bullish sentiment can push prices higher, while fear-driven sell-offs can lead to sharp declines.
- Sector performance: Since the Dow comprises companies from multiple industries, strong performance in key sectors like technology, finance, or healthcare can lift the index, while sector weaknesses can drag it down.
- Bond yields: Rising yields make bonds more attractive relative to stocks, leading investors to shift capital away from equities, which can put downward pressure on the Dow.
- Currency strength: A stronger US dollar can negatively impact multinational companies in the Dow by making exports more expensive, potentially reducing revenues and earnings.
- Technical factors: Support and resistance levels, moving averages, volume trends, and momentum indicators play a crucial role in short-term price action and trader decision-making.
Technical vs fundamental analysis for trading the Dow
Trading the Dow requires a balanced approach, blending technical analysis and fundamental analysis to identify opportunities and manage risk effectively. While technical analysis focuses on price trends and market patterns, fundamental analysis evaluates economic conditions and corporate performance.
Combining the two can provide a complete picture of market dynamics.
Which approach is better?
Both approaches have their unique advantages, and many traders find value in combining both to create a more balanced and adaptable strategy:
- Short-term traders (eg day traders, swing traders) often rely more on technical analysis to identify precise entry and exit points.
- Long-term investors and position traders rely on fundamental analysis to assess the economic outlook and corporate financials.
- Hybrid traders use fundamental analysis to determine long-term trends and technical analysis to fine-tune trade execution. By integrating both methods, traders can navigate market volatility more effectively and make informed trading decisions.
Key elements of technical and fundamental analysis
By integrating both approaches, you can improve your ability to identify market trends, evaluate corporate performance, and get a better understanding of how broader economic factors, such as interest rates, impact the market:
Identifying market trends and sentiment
- Technical tools: Moving Averages, RSI, and MACD help identify trends.
- Fundamental indicators: GDP growth, unemployment, and inflation affect market sentiment.
- Example: A bullish Dow trend based on moving averages can be confirmed by strong economic conditions.
Evaluating corporate performance and price movements
- Technical tools: Volume analysis, support/resistance levels, and chart patterns help find entry/exit points.
- Fundamental indicators: Earnings reports and sector performance show if Dow prices align with business growth.
- Example: A positive earnings report from Apple can push the Dow higher, confirmed by volume and breakouts.
Interest rates and Federal Reserve policy impact
- Technical tools: Bond yields and volatility indicators gauge market reaction.
- Fundamental indicators: Fed rate decisions impact stock market sentiment.
- Example: Rate cuts suggest a bullish outlook, with technical analysis confirming momentum.
Key trading strategies for the Dow
You can use different strategies based on time horizons, risk tolerance, and market conditions. Some of the most effective strategies include:
- Trend following: This strategy involves capitalising on dominant price trends, using technical indicators like moving averages, MACD, and RSI to confirm trends. It works well in strong bullish or bearish markets but can be vulnerable to sudden reversals.
Scenario: If the Dow is forming higher highs and higher lows, a trend-following strategy might involve entering after a pullback to a support level. - Range trading: This approach is used when the Dow is moving sideways within a defined price range. It involves buying at support levels and selling at resistance, with tools like Bollinger Bands, RSI, and volume analysis to identify entry and exit points.
Scenario: If the Dow fluctuates between 33,000 and 34,000, a range trading strategy could involve buying near 33,000 and exiting before reaching 34,000, with stop-loss orders to protect against a breakout. - Breakout trading: This strategy focuses on identifying key resistance and support levels where price breaks out into a new trend. High volume confirms the strength of the breakout. Stop-losses are often set below breakout levels to guard against false breakouts.
Scenario: If the Dow consistently fails to break above 35,000 but experiences a strong breakout on high volume, it might indicate the start of a new uptrend. - Mean reversion trading: Assumes that extreme price moves will revert to a historical average. It works well in low-volatility environments but is riskier during strong trends.
Scenario: If the Dow falls significantly below its 200-day moving average but economic conditions remain stable, a mean reversion strategy might expect a price rebound. - News and event-driven trading: This strategy focuses on reacting to macroeconomic data, Federal Reserve announcements, and earnings reports. Fast execution is necessary to take advantage of market-moving news.
Scenario: A sudden Federal Reserve interest rate cut could lead to a market reaction where the Dow rises due to expectations of increased liquidity and economic support.
Risk management
Regardless of the strategy used, risk management is crucial to protect capital, especially when using leveraged products like CFDs and futures:
- Setting stop-loss orders: A stop-loss automatically exits a trade if the price moves against the position, limiting losses. Trailing stops adjust with market movements, locking in profits while still protecting against downturns.
Example: In a long trade at 34,500, set a stop-loss at 34,200 to limit downside risk. - Managing position sizes: Allocate only a portion of total capital per trade to prevent overexposure. A common guideline is to risk no more than 1-2% of the account balance on a single trade.
Example: With a $10,000 account, risking 2% per trade results in a maximum loss of $200 per position. - Diversifying holdings: Diversification reduces reliance on a single asset or sector. By including other indices, bonds, commodities, or currencies, risk can be balanced.
Example: If the tech sector is underperforming, exposure to industrial or consumer sectors within the Dow can help offset losses. - Monitoring volatility and economic events: The Dow can experience heightened volatility during earnings season, economic data releases, and Fed announcements. It is important to avoid overleveraging during these high-risk periods.
Example: Reducing position sizes ahead of a non-farm payroll (NFP) release can help mitigate unpredictable market swings.
Balancing risk and reward in trading the Dow
While leveraged trading can amplify profits, it also magnifies losses. You should always:
- Have a plan before entering trades, including entry, exit, and stop-loss levels.
- Avoid emotional decision-making, especially after losses.
- Regularly review trading performance to refine strategies over time.
By combining effective strategies with strict risk management, you can navigate Dow trading with greater confidence and consistency.
The material provided here has not been prepared in accordance with legal requirements designed to promote the independence of investment research and as such is considered to be a marketing communication. Whilst it is not subject to any prohibition on dealing ahead of the dissemination of investment research we will not seek to take any advantage before providing it to our clients.
Pepperstone doesn’t represent that the material provided here is accurate, current or complete, and therefore shouldn’t be relied upon as such. The information, whether from a third party or not, isn’t to be considered as a recommendation; or an offer to buy or sell; or the solicitation of an offer to buy or sell any security, financial product or instrument; or to participate in any particular trading strategy. It does not take into account readers’ financial situation or investment objectives. We advise any readers of this content to seek their own advice. Without the approval of Pepperstone, reproduction or redistribution of this information isn’t permitted.