- English
- 简体中文
- 繁体中文
- ไทย
- Tiếng Việt
- Español
- Português
- لغة عربية
- English
- 简体中文
- 繁体中文
- ไทย
- Tiếng Việt
- Español
- Português
- لغة عربية
Analysis

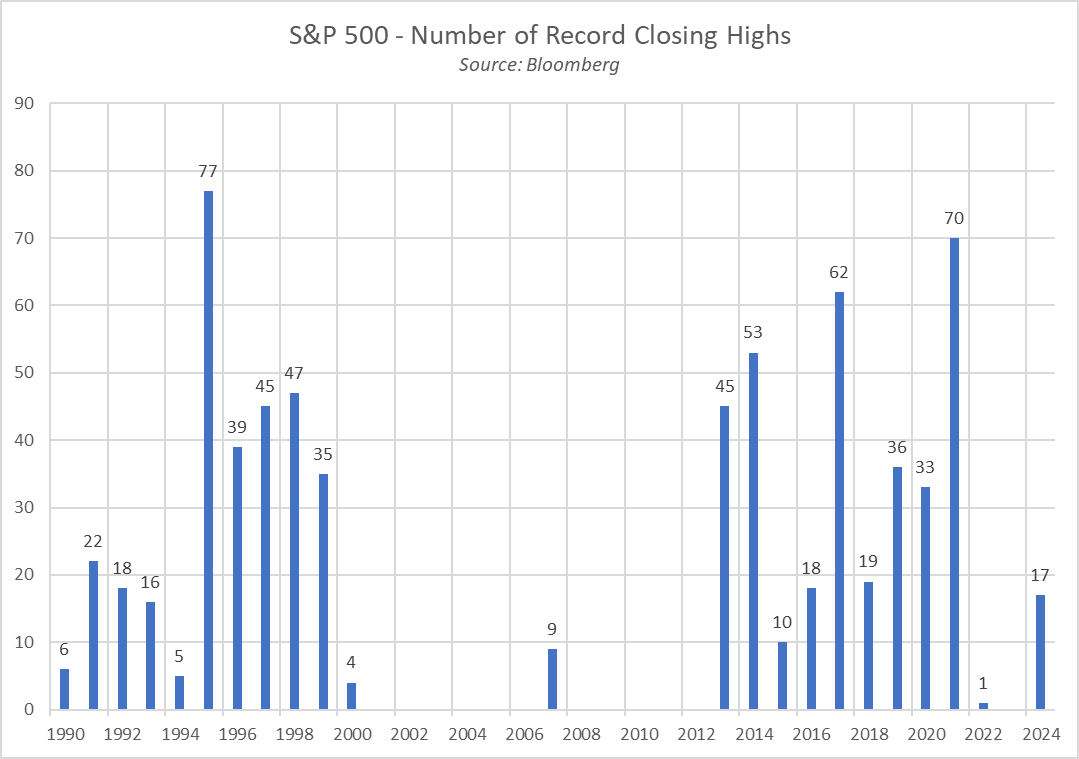
Just how strong has this performance been? 17 record highs in the S&P 500 already since the beginning of January, to be precise, a total of 44 trading days. That represents the benchmark US equity index having notched a new all-time closing high on 38% of all trading days thus far, while having already notched the most record highs in a year since 2021.
As has often been noted in these pages, there are few more bullish signs for any asset than said asset setting new all-time highs on a regular basis.
Looking under the surface, further bullish signs, pointing towards potential greater upside, begin to emerge.
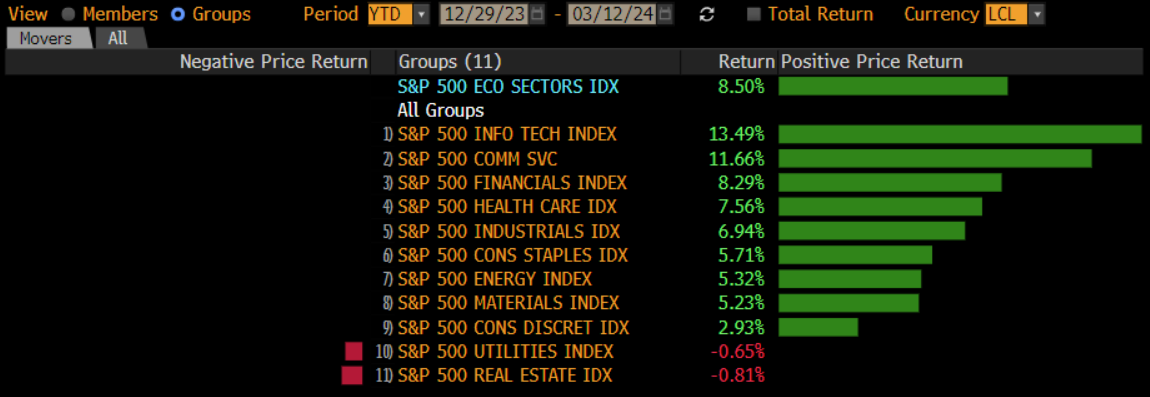
For instance, the rally shows increasing signs of broadening out, with the gains not just being a tech/AI story as we’ve seen during much of the cycle so far. At a sector level, 9 of the 11 S&P 500 sectors currently trade in the green on a YTD basis, with only utilities and real estate marginally in the red.
This proportion is up from 8 sectors around a month ago, and from just 5 sectors having traded in positive territory at the end of January, with such an improvement in breadth also coming amid rising volumes, likely a sign of increasing conviction in the ongoing rally.
Digging deeper still, to a constituent level, we see 335 of the 503 S&P 500 constituents, approx. two-thirds of the index, now trading in positive territory on the year. In a similar manner to what’s been seen at a sector level, this figure has improved from 54% of constituents a month ago, and a rather pitiful 44% at the end of January. Once again, increasing participation in equity upside tends to be a strong bullish indicator.
Remaining at a single-stock level, this increased participation has also resulted in a greater proportion of index members now trading above key medium- and long-run momentum gauges, again implying further upside could well be on the cards.
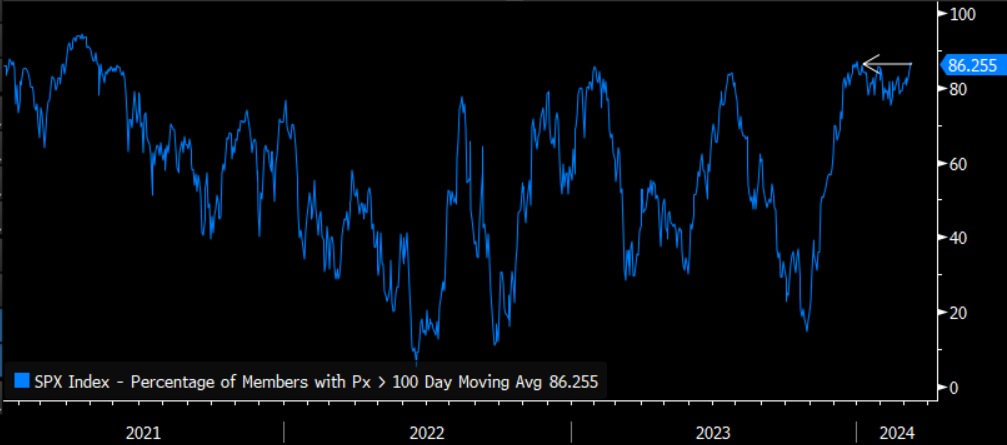
As an example, the proportion of S&P constituents now trading above their 100-day moving average now stands north of 85%, its highest level this year, and close to the highest since 2021 – as mentioned, the last time the market was setting record highs with such regularity.
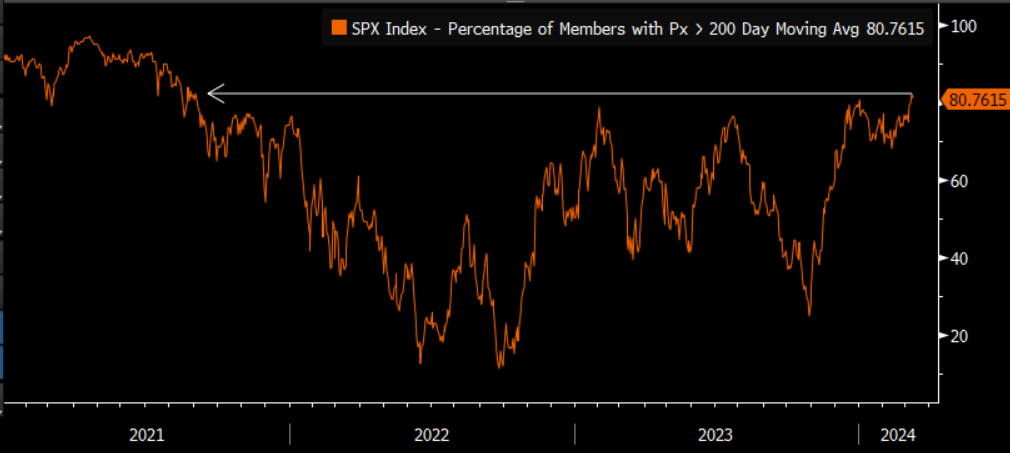
Scaling out to the 200-day moving average, a key input in many institutional trend-following strategies, and a similar picture is evident. Just over 80% of S&P 500 members now trade above said level, the highest since mid-2021, with breaks above the 200-day MA having a strong tendency to entice fresh longs to enter the market.
Of course, while both of these are signs of upside momentum continuing to mount, neither can or indeed should be taken in isolation.
That said, it is not only strong internals that are helping to propel the market higher at the present time.
Although recent inflation data has surprised to the upside, with the last three CPI prints proving hotter than market expectations, the core disinflationary trend within the US economy remains intact. In turn, this should still allow the Fed to begin policy normalisation later this year, most likely in June, with both rate cuts, and the end of quantitative tightening likely to result in improved liquidity, providing a favourable tailwind for risk.
In addition, with the inflationary beast almost slain, policymakers have a significant degree of optionality on the policy path that they wish to take, being able to ease more rapidly, to a greater magnitude, or reintroduce targeted liquidity injections were they to be required. In other words, the central bank ‘put’ has returned alive and well.
Furthermore, one must consider that the economic backdrop remains relatively resilient – the services sector continues to expand at a solid clip, output in the manufacturing side of the economy appears to have bottomed, and the labour market remains tight, which should continue to underpin consumer spending.
Of course, this is not to say that near-term downside is off the cards, nor that a pullback or even a deeper correction won’t happen, particularly if the Fed were to make a renewed hawkish pivot, or the economic backdrop were to sour in a significant manner. However, for now, and likely for some time to come, the balance of risks points to further upside, with the path of least resistance likely continuing to lead higher, and with any dips set to be bought rapidly, and aggressively.
Related articles


The material provided here has not been prepared in accordance with legal requirements designed to promote the independence of investment research and as such is considered to be a marketing communication. Whilst it is not subject to any prohibition on dealing ahead of the dissemination of investment research we will not seek to take any advantage before providing it to our clients.
Pepperstone doesn’t represent that the material provided here is accurate, current or complete, and therefore shouldn’t be relied upon as such. The information, whether from a third party or not, isn’t to be considered as a recommendation; or an offer to buy or sell; or the solicitation of an offer to buy or sell any security, financial product or instrument; or to participate in any particular trading strategy. It does not take into account readers’ financial situation or investment objectives. We advise any readers of this content to seek their own advice. Without the approval of Pepperstone, reproduction or redistribution of this information isn’t permitted.