- English (UK)

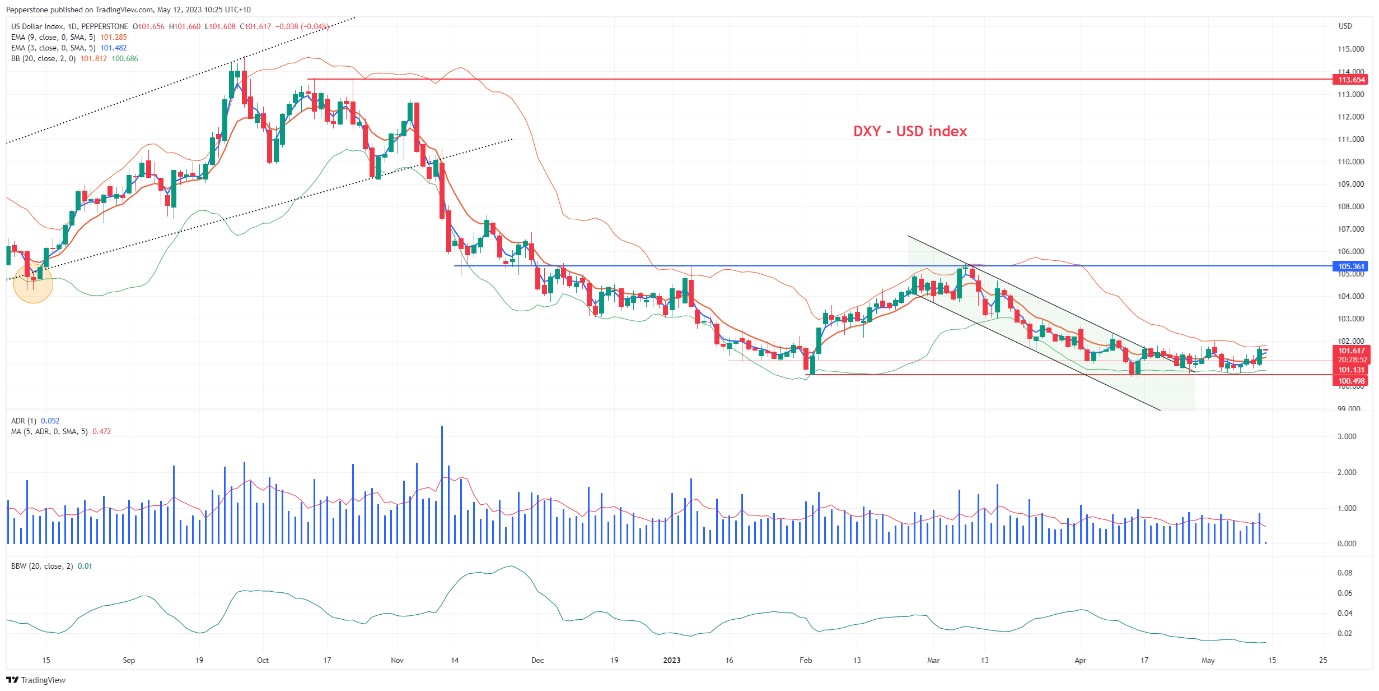
US Dollar Index (DXY)
The fact we are seeing US 2yr Treasury yields confined to a 4.28% to 3.60% range is a major factor behind the DXY trading in such a tight consolidation. On the daily timeframe we see the Bollinger Bands (BB) compress to the tightest levels since Jan 22, with the RSI (9) sitting mid-range – subsequently mean reversion is the correct strategy here and we see clients adopting this quite successfully at present. EURUSD (the EUR holds a 57% weight in the USD index) is starting to break down, and should we start to see trending conditions then one suspects the DXY should push higher and potentially out of the range. The longer we see this BB compression the more likely we are to see an impulsive and powerful break out – I favour the upside, but the US debt ceiling is the obvious risk to that call.
For more intel on the US debt ceiling, I sat down with Mitch Comben (high value client relations) for a deep dive - https://youtu.be/L8YplkBjO1M
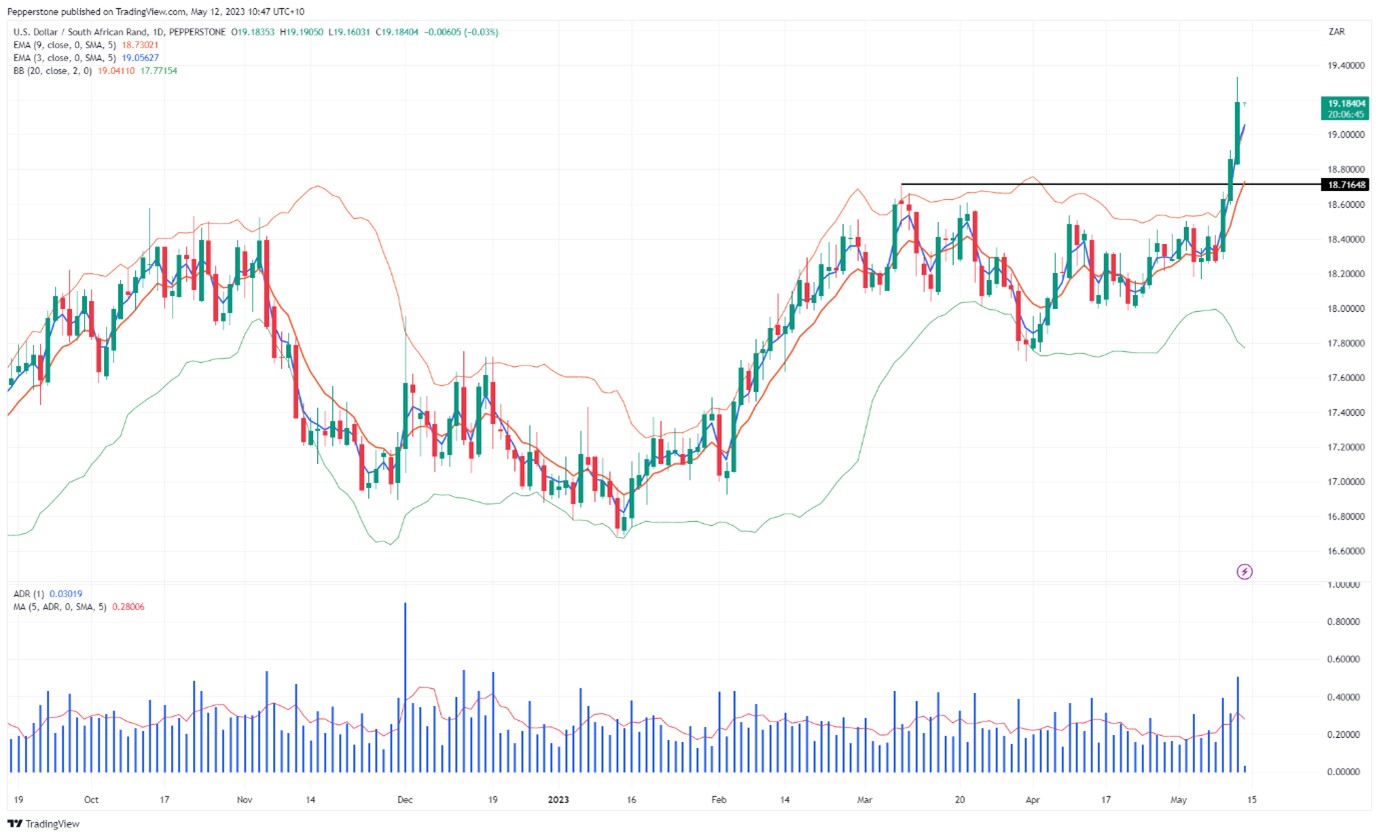
USDZAR
The ZAR (South African rand) has come up on the radar as sellers have dominated and a true buyers strike ensues. We’re seeing longer-dated South African govt bonds sell off aggressively, with yields on 25yr government debt rising above 12.5% and the highest levels since 2020. The energy shortage continues to take a toll on economics and talk of increasing stagflation risks will typically attract currency sellers – the April CPI print (due 24 May) could be important in determining if the SA central bank (SARB) is indeed ready to pause in its hiking cycle, with SARB policy meeting due 25 May. Geopolitical issues are also weighing to an extent with the US ambassador to SA accusing the country of supplying arms to Russia. Favour buying weakness in USDZAR into 19.05.
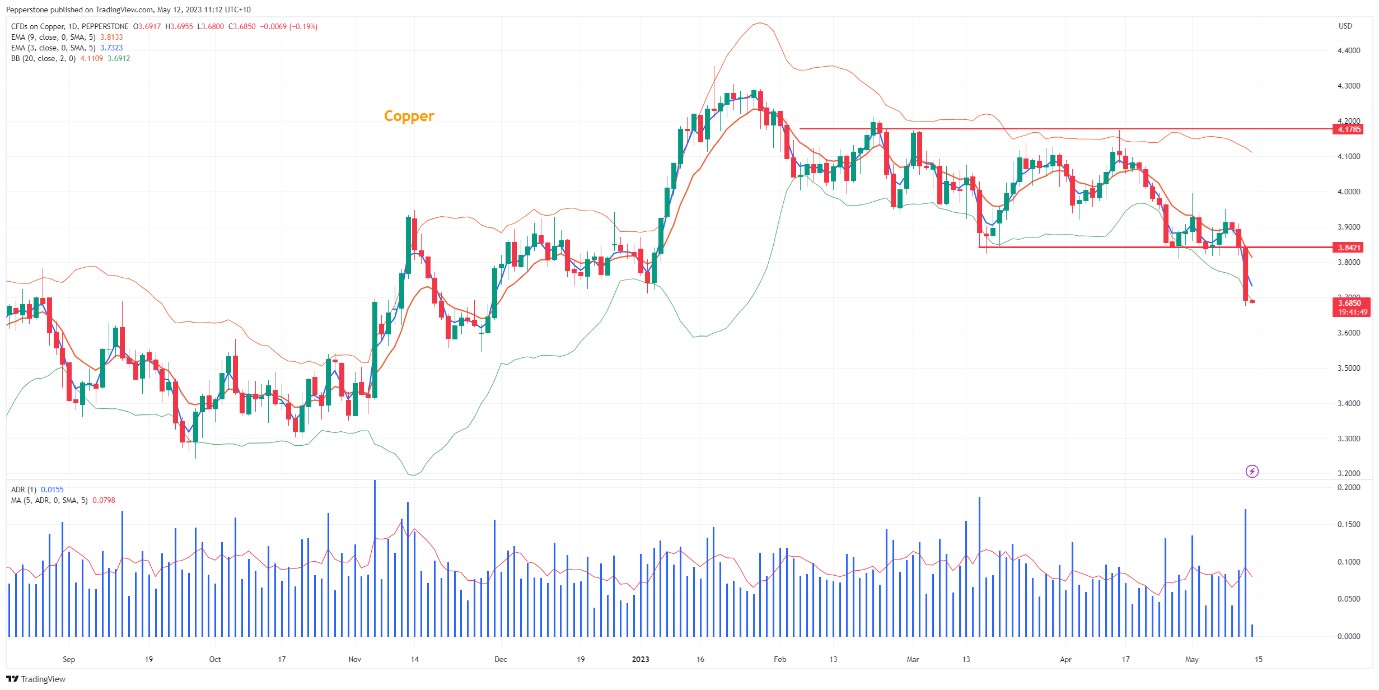
Copper
A 4% sell-off in copper has been getting some focus on the trading floors, with price smashing through the range lows of $3.84. We saw the second biggest high-low range of the year, so plenty for day traders to work with. Reduced Chinese demand is very much at the heart of the move, with copper imports YTD 13% below the levels seen in 2022. The copper/gold ratio is trending sharply lower and speaks to a progressively more concerned view on impeding economics. Favour selling rallies.
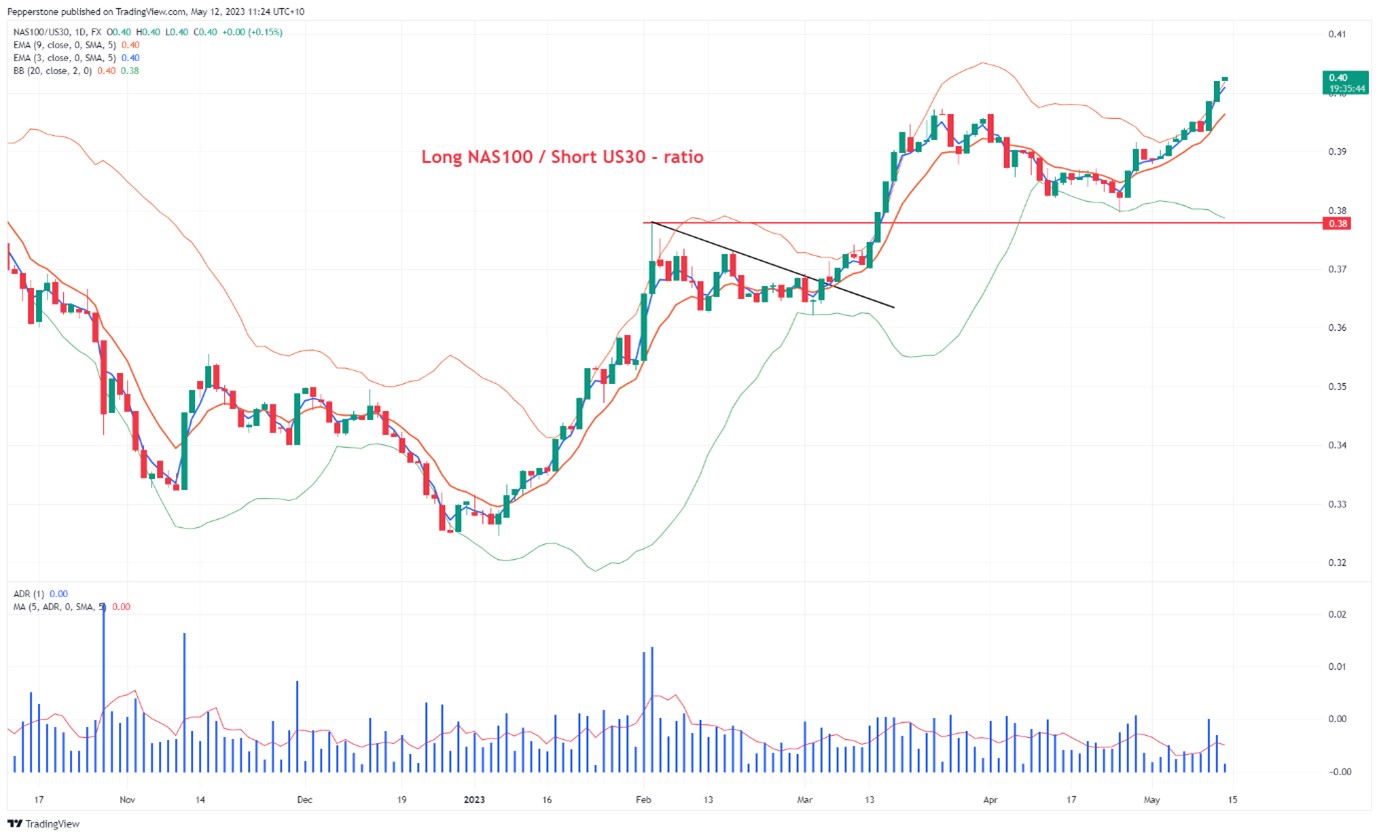
NAS100 / US30 (ratio)
looking at the ratio we see it breaking to new highs showing the NAS100 outperforming – the NAS100 is clearly the dominant US index with the YTD gain now at 17.8%, so being long NAS100/short US30 (or US2000) has become a core expression of economic fragility in the hedge fund world. The key to long/short (or pairs) strategies is to start with a shared dollar notional amount and then dividing this by the price of each index and that will offer the position size for both legs. The fact this trade is such a consensus position is a concern but for now, the trend (in the ratio) is to be respected.
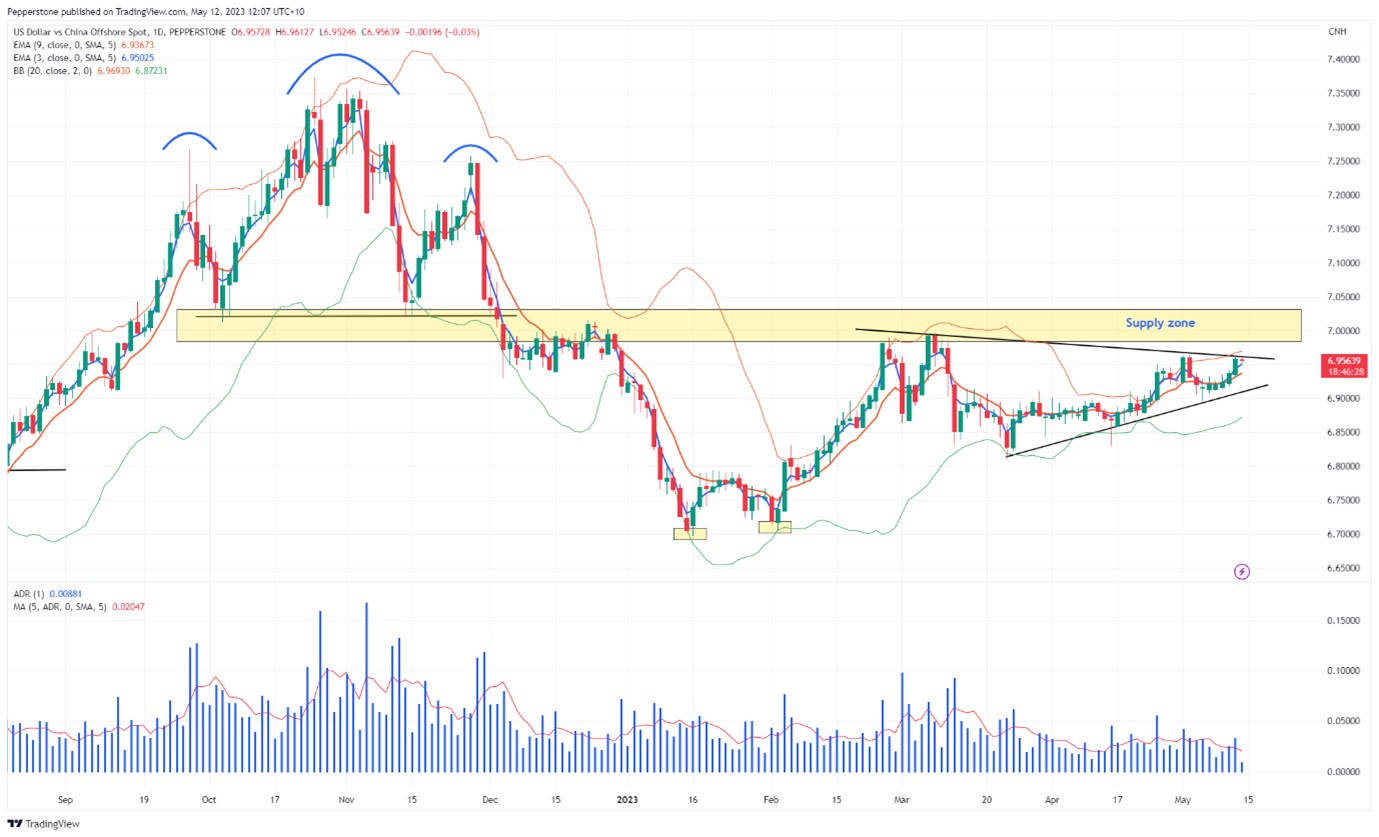
USDCNH
(Chinese yuan) – a currency cross that often flies under the radar, but periodically it can play an important role and a driver of price action in other currencies, such as the AUD or the NZD. We currently see the 20-day rolling correlation between USDCNH and AUDUSD at -56%, but it’s rising, and I feel if we see a firm move in USDCNH into 7.000 – the key supply zone – then it could result in AUDUSD pushing into the range lows (seen on the daily chart) of 0.6580. On Tuesday (16 May) we get China’s industrial production (consensus 10.8%), retail sales (8.2%) and fixed asset investment (5.8%) – the market expects solid improvement, but any disappointment could see further buyers in China bonds (yields lower) and see the CNH under pressure. Any moves into 7.000 should offer scalpers levels to work off.
Related articles

The material provided here has not been prepared in accordance with legal requirements designed to promote the independence of investment research and as such is considered to be a marketing communication. Whilst it is not subject to any prohibition on dealing ahead of the dissemination of investment research we will not seek to take any advantage before providing it to our clients.
Pepperstone doesn’t represent that the material provided here is accurate, current or complete, and therefore shouldn’t be relied upon as such. The information, whether from a third party or not, isn’t to be considered as a recommendation; or an offer to buy or sell; or the solicitation of an offer to buy or sell any security, financial product or instrument; or to participate in any particular trading strategy. It does not take into account readers’ financial situation or investment objectives. We advise any readers of this content to seek their own advice. Without the approval of Pepperstone, reproduction or redistribution of this information isn’t permitted.