Spread bets and CFDs are complex instruments and come with a high risk of losing money rapidly due to leverage. 72% of retail investor accounts lose money when trading spread bets and CFDs with this provider. You should consider whether you understand how spread bets and CFDs work, and whether you can afford to take the high risk of losing your money.
- English (UK)

Still, the time to hedge was last week when the VIX was not at 25%, and we see a 9-volatility premium for S&P 500 1-month put volatility over calls. The old saying, hedge because you can (and it's cheap) and not because the market forces you to do so rings true here.
Gold has been a great portfolio hedge for a while now, and weightings should be at least 10% of the broad portfolio and will remain a solid hedge against the risk of Sanders winning the November US election. The metal hit a high of $1689, but has since come off the boil with price sitting $28 lower here. That said, gold remains supported on dips, especially when we have seen some incredible moves in the US bond market with the gains lead in the belly of the curve, with 5-year Treasury’s -12bp and at 1.20% is eyeing a move into 1%. Further out the curve and UST 10s at 1.36% are eyeing the at-time lows of 1.31% - the bond market has been telling us all we need to know.
Gold remains a play on an expected response from central banks and while we continue to see a solid bid in both nominal and real rates, the market is now pricing a 56% chance of a cut from the Fed on 29 April and a full cut by June. I reiterate the view that we are closing in on a point where we see a rerun, perhaps in a less aggressive manor, as in 2018 when the market had a view that the Fed would end its QT program and cut rates, and the Fed shared a different view – it was long before the markets forced a re-think from the Fed.
At the heart of the view, we see US 5yr inflation expectations dropping to 1.61% and the lowest levels since July 2016, and the Fed will have noticed this even if we have just heard from Cleveland Fed president Loretta Mester who, among other comments, detailed that the “virus is a risk but I am struck by the US resilience”. It doesn’t sound like the Fed is overly concerned at this stage, although we’ll get a better gauge tomorrow when the Fed general, Jerome Powell speaks.
Yield curves continue to flatten and invert
When we see the VIX at 25% that is generally a toxic mix for risk and we head to safety and look for a return of our capital than on it. When we look at the news flow, there is no clarity that we can be confident on any of the assumptions that feed into earnings models, especially for airlines or travel companies which have been taken to the woodshed. But when countries are closing borders, the threat of outbreak is becoming more pronounced in Europe and the Middle East and supply chains are just going to become more disrupted - How do we model risk when we can’t model economics with any confidence?
When we don’t have clarity or genuinely understand our circuit breaker, then we head to cash or buy bonds, gold and the JPY – the holy trinity in this market – although long volatility is also working well as traders sense movement. Indeed, for anyone, including yours truly, who thought the JPY had lost its safe-haven quality well it was the superstar major currency, notably NOKJPY, which was sold 1.7%, with traders seeing a punchy 4% decline in crude.
Equities face a dark and sinister open, with Aussie SPI futures some 2.6% from the official ASX200 close. We can use that as a guide, and while some of the moves lower in US equities were already discounted, we see S&P 500 futures 1.9% lower from the same time. It takes a brave soul to be buying these markets, but the opening 30 minutes will be key to psychology – it could well be a buyer strike and another day where order book dynamics take hold and the sellers exasperate the move. Expect moves of 2% for the Nikkei 225 and Hang Seng too.
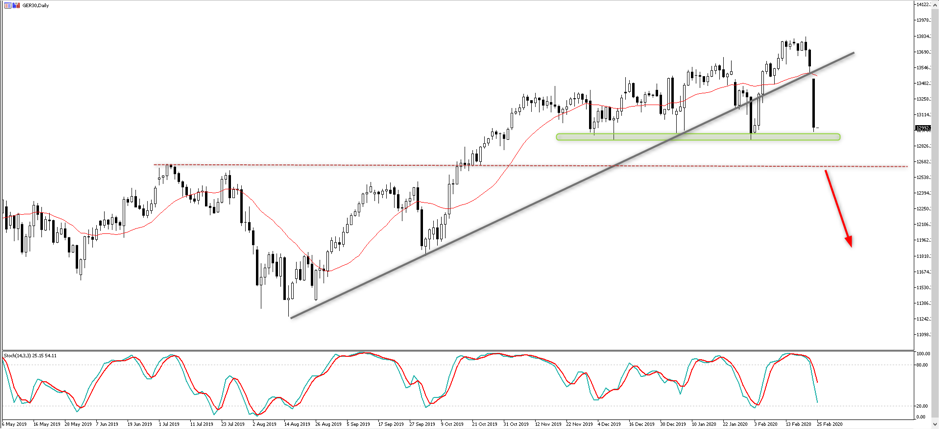
On the European side, it’s the MIB which has been hit the hardest, with a 5.4% drop (at 5.1 Z-score move), which won’t surprise given Italy is at the heart of concerns and it’s a higher beta index anyhow. The DAX needs attention as we see the index right on the 12,900 area, where the index has held in on multiple times since November. The bulls will need this to hold, or the risk of a quick move to 12,660 and then 12,000 is elevated.
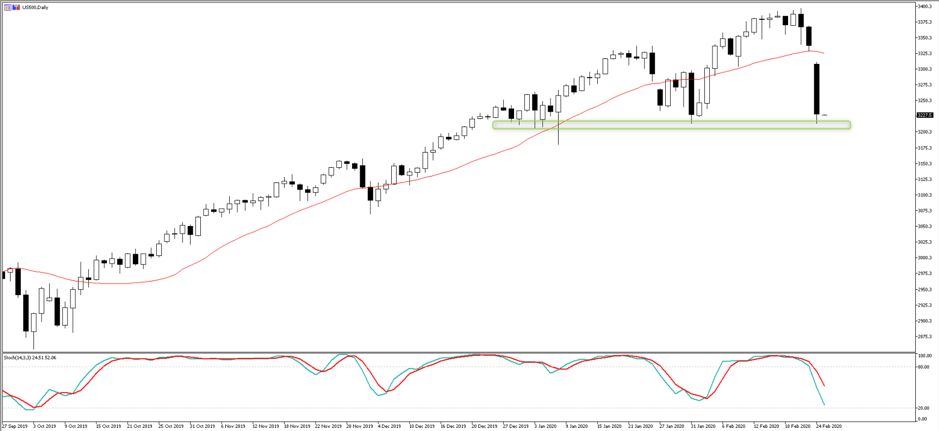
I would also add that when we’re talking levels we should watch the S&P 500 (US500). If we see price head through 3200 then it will lead to even higher volatility and risk of a 10% drawdown. The bulls need to defend this or it's goodnight Vienna.
Ready to trade?
It's quick and easy to get started. Apply in minutes with our online application process.
The material provided here has not been prepared in accordance with legal requirements designed to promote the independence of investment research and as such is considered to be a marketing communication. Whilst it is not subject to any prohibition on dealing ahead of the dissemination of investment research we will not seek to take any advantage before providing it to our clients.
Pepperstone doesn’t represent that the material provided here is accurate, current or complete, and therefore shouldn’t be relied upon as such. The information, whether from a third party or not, isn’t to be considered as a recommendation; or an offer to buy or sell; or the solicitation of an offer to buy or sell any security, financial product or instrument; or to participate in any particular trading strategy. It does not take into account readers’ financial situation or investment objectives. We advise any readers of this content to seek their own advice. Without the approval of Pepperstone, reproduction or redistribution of this information isn’t permitted.