• Home
  • Pro
  • Partners
  • Help and support
  • English (UK)
Pepperstone logo
Pepperstone logo
  • Ways to trade
    • Spread betting

      Bet on global price movements in £ per point

    • CFD trading

      Trade on 1000s of assets without owning them

    • Pricing

      Discover our tight spreads, plus all other possible fees

    • Risk management
    • Trading accounts
    • Demo trading
    • Trading hours
    • 24-hour trading
    • Maintenance schedule
  • Markets
    • Forex

      Get great rates on majors like EUR/USD, plus minors and exotics

    • Indices

      Enjoy 24-hour pricing on the UK100, US30 and more

    • Commodities

      Trade on metals, energies & softs, with oil spreads from 2 cents

    • Shares
    • ETFs
    • Currency indices
    • Dividends for index CFDs
    • Dividends for share CFDs
    • CFD forwards
  • Trading platforms
    • TradingView

      Trade through the world-famous supercharts with great pricing

    • MetaTrader 5

      Explore the apex in trading automation with our execution tech

    • The Pepperstone platform
    • MetaTrader 4
    • cTrader
    • Trading tools
  • Market analysis
    • Navigating markets

      Latest news and analysis from our experts

    • The Daily Fix

      Your regular round-up of key events

    • Meet the analysts

      Our global team giving your trading the edge

  • About us
    • Who we are

      Pepperstone was born from the dream of making trading better

    • Company news
    • Company awards
    • Protecting clients online
    • Spread betting

      Bet on global price movements in £ per point

    • CFD trading

      Trade on 1000s of assets without owning them

    • Pricing

      Discover our tight spreads, plus all other possible fees

    • Risk management
    • Trading accounts
    • Demo trading
    • Trading hours
    • 24-hour trading
    • Maintenance schedule
    • Forex

      Get great rates on majors like EUR/USD, plus minors and exotics

    • Indices

      Enjoy 24-hour pricing on the UK100, US30 and more

    • Commodities

      Trade on metals, energies & softs, with oil spreads from 2 cents

    • Shares
    • ETFs
    • Currency indices
    • Dividends for index CFDs
    • Dividends for share CFDs
    • CFD forwards
    • TradingView

      Trade through the world-famous supercharts with great pricing

    • MetaTrader 5

      Explore the apex in trading automation with our execution tech

    • The Pepperstone platform
    • MetaTrader 4
    • cTrader
    • Trading tools
    • Navigating markets

      Latest news and analysis from our experts

    • The Daily Fix

      Your regular round-up of key events

    • Meet the analysts

      Our global team giving your trading the edge

    • Who we are

      Pepperstone was born from the dream of making trading better

    • Company news
    • Company awards
    • Protecting clients online

Five charts to watch as US-Iran tensions ratchet up

Sean MacLean
Sean MacLean
Research Strategist
8 Jan 2020
Share
Markets responded swiftly to news today that Iran fired tens of rockets at a US-Iraqi air base this morning. Investors fled to safe havens as US stocks took a hit.

The move from Iran comes as retaliation to President Trump’s lethal drone strike on Friday that killed Iranian General Qassem Soleimani. Tensions have only escalated since as 2020 kicks off to a volatile start.

We’re seeing increased trading volume as the conflict develops. Here are five charts you should be watching as retaliation ratchets up: XAUUSD, XAUAUD, XTIUSD, US500, and AUDJPY.

Gold

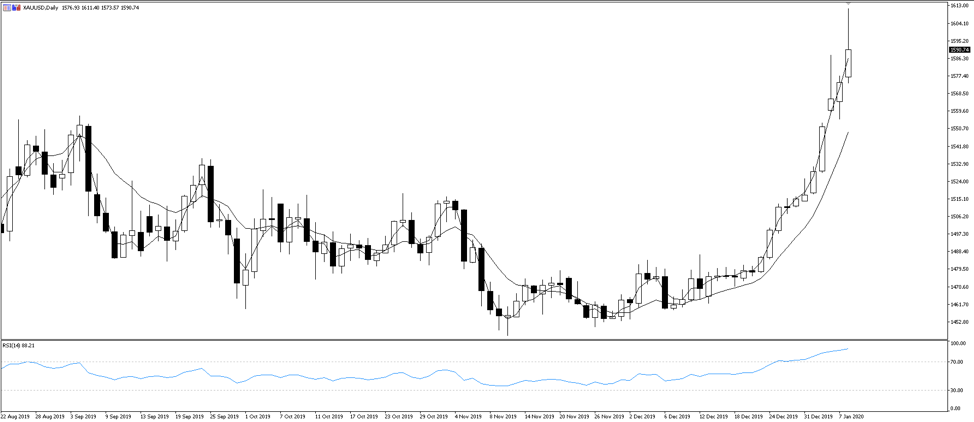
Gold hit a six-year high on Monday when it soared past 1550 USD. Then today as news of the US-Iraqi airbase strike unfolded, the precious metal flew even further: past 1600 to a high of 1611. Gold continues its daily gains against the greenback after two weeks of gentle appreciation before gapping higher on this week’s open.

Look at this week’s daily candles: the move is almost vertical. And even though gold pared back a bit Monday after spiking higher, the move has continued throughout the week. Gold is our hedge against this week’s geopolitical risk.

XAUUSD daily chart

We’re not just watching XAUUSD though. Also consider gold against the Aussie dollar (XAUAUD), which hit an all-time high of 2351 this morning.

XAUAUD daily chart

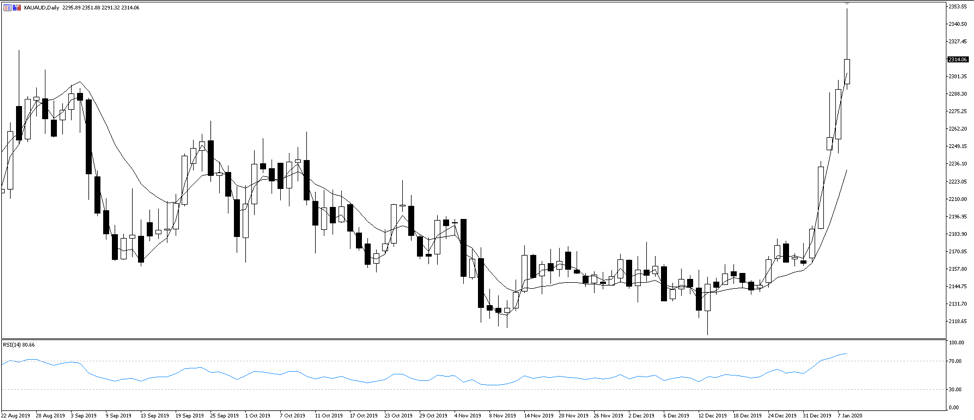
We have a bullish RSI for both XAUUSD and XAUAUD, reflecting the strong upward move. If we see a pullback while awaiting further news, it will likely be short-lived. Do expect gold to track higher again if the US retaliates, or rhetoric of retaliation from either side intensifies. Critical one to watch.

WTI crude (XTIUSD)

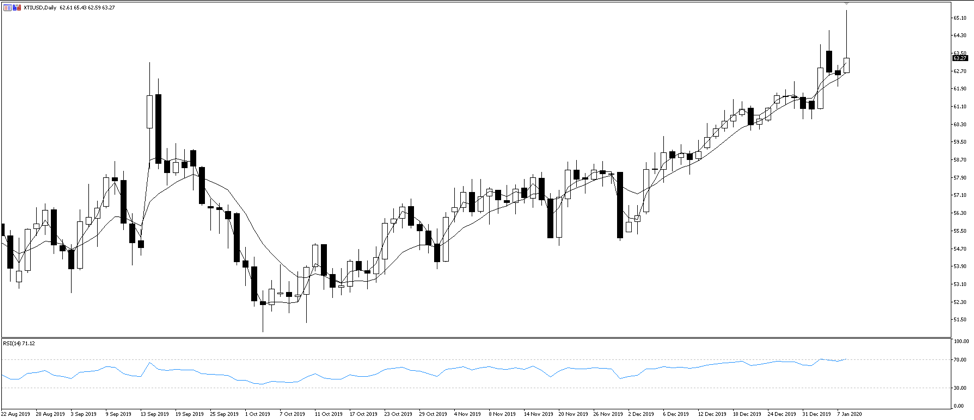
Oil is of course extremely sensitive to geopolitical tensions in this region, and WTI crude (XTIUSD) jumped as much as 4.5% today from its opening price.

Similarly, there was a 3% increase on the day at Friday’s close after the initial strike from the US. By Tuesday the gains had mostly pared back, as the conflict hadn’t affected oil supply.

XTIUSD will remain sensitive to the news flow, and higher levels will stick if the conflict disrupts oil supply. The US earlier this week expressed concern that Iran might strike Saudi oil fields in retaliation.

XTIUSD daily chart

US500

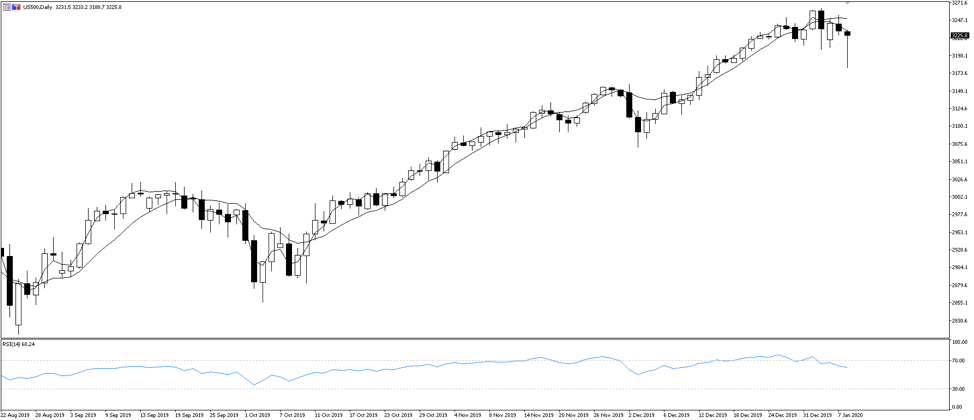
US stocks took a considerable hit, with US stock futures slipping 1.2% as news of the air strike emerged. But nothing seems to hinder US stocks for too long these days, strengthening again when news flow calms. Today’s losses seem to have mostly recovered: the index is now trading back above the Monday and Tuesday lows.

There is opportunity in these quick and decent moves, but please be sure to reduce stop-losses and take-profits in order to manage your own risk.
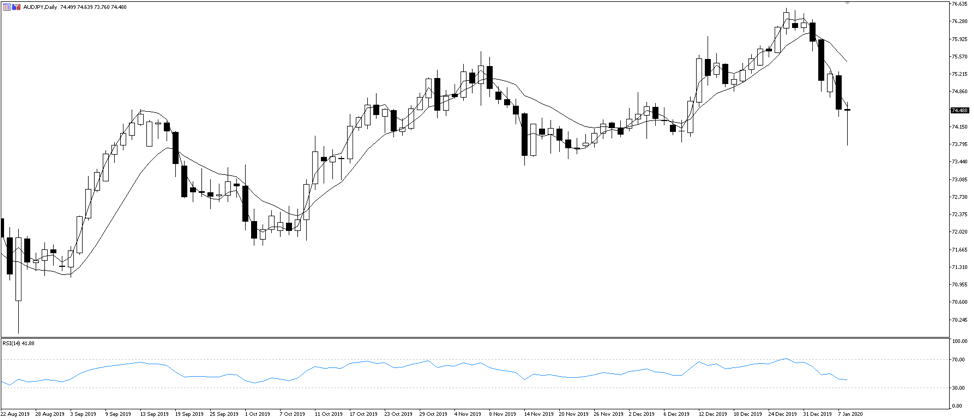
US500 daily chart

AUDJPY

Consider AUDJPY, an important risk proxy, which has proven very sensitive to news flow since the initial attack on Friday. The safe haven Japanese yen against AUD offered more pronounced moves than the popular pair USDJPY.

The greenback can act as a safe haven in its own right at times, so with USD removed from the equation, AUDJPY gives a cleaner read on event risk. At AUDJPY’s low this morning of 73.760, that was a 1.9% decline since Friday’s open before the initial US attack. In contrast, USDJPY hit only a 0.8% decline since Friday’s open when the pair hit a 107.651 low amid the airstrikes this morning.

AUDJPY daily chart

The mood is tense. If we see escalation either side, risk will increase and gold will rally further. If markets take the view that the tit for tat retaliation will not lead to an all-out war, equities will rally and gold sell off. Of course, there is too much uncertainty at this point to know. Keep watch.

Ready to trade?

It's quick and easy to get started. Apply in minutes with our online application process.

Get startedSubscribe to The Daily Fix

The material provided here has not been prepared in accordance with legal requirements designed to promote the independence of investment research and as such is considered to be a marketing communication. Whilst it is not subject to any prohibition on dealing ahead of the dissemination of investment research we will not seek to take any advantage before providing it to our clients.

Pepperstone doesn’t represent that the material provided here is accurate, current or complete, and therefore shouldn’t be relied upon as such. The information, whether from a third party or not, isn’t to be considered as a recommendation; or an offer to buy or sell; or the solicitation of an offer to buy or sell any security, financial product or instrument; or to participate in any particular trading strategy. It does not take into account readers’ financial situation or investment objectives. We advise any readers of this content to seek their own advice. Without the approval of Pepperstone, reproduction or redistribution of this information isn’t permitted.

Other Sites

  • The Trade Off
  • Partners
  • Group
  • Careers

Ways to trade

  • Pricing
  • Trading accounts
  • Pro
  • Trading hours

Platforms

  • Trading Platforms
  • Trading tools

Markets and Symbols

  • Forex
  • Shares
  • ETFs
  • Indicies
  • Commodities
  • Currency indicies
  • CFD forwards

Analysis

  • Navigating Markets
  • The Daily Fix
  • Meet Our Analysts

Learn to trade

  • Trading guides
  • Videos
  • Webinars
Pepperstone logo
support@pepperstone.com
+448000465473+442038074724
70 Gracechurch St
London EC3V 0HR
United Kingdom
  • Legal documents
  • Privacy policy
  • Website terms and conditions
  • Cookie policy
  • Sitemap

© 2025 Pepperstone Limited 
Company Number 08965105 | Financial Conduct Authority Firm Registration Number 684312

Risk warning: Spread bets and CFDs are complex instruments and come with a high risk of losing money rapidly due to leverage. 73.7% of retail investor accounts lose money when trading spread bets and CFDs with this provider. You should consider whether you understand how spread bets and CFDs work and whether you can afford to take the high risk of losing your money.

Trading derivatives is risky. It isn't suitable for everyone and, in the case of Professional clients, you could lose substantially more than your initial investment. You don't own or have rights in the underlying assets. Past performance is no indication of future performance and tax laws are subject to change. The information on this website is general in nature and doesn't take into account your or your client's personal objectives, financial circumstances, or needs. Please read our legal documents and ensure you fully understand the risks before you make any trading decisions. We encourage you to seek independent advice.

Pepperstone Limited is a limited company registered in England & Wales under Company Number 08965105 and is authorised and regulated by the Financial Conduct Authority (Registration Number 684312). Registered office: 70 Gracechurch Street, London EC3V 0HR, United Kingdom.

The information on this site is not intended for residents of Belgium or the United States, or use by any person in any country or jurisdiction where such distribution or use would be contrary to local law or regulation.