- English (UK)
The Daily Fix: Finding opportunity in a lower volatility backdrop

Looking around the markets for inspiration within the usual framework, I thought I’d share a few charts that look interesting.
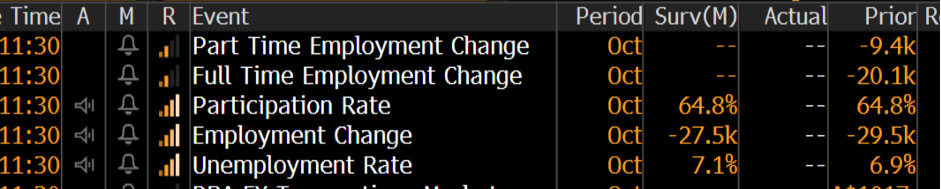
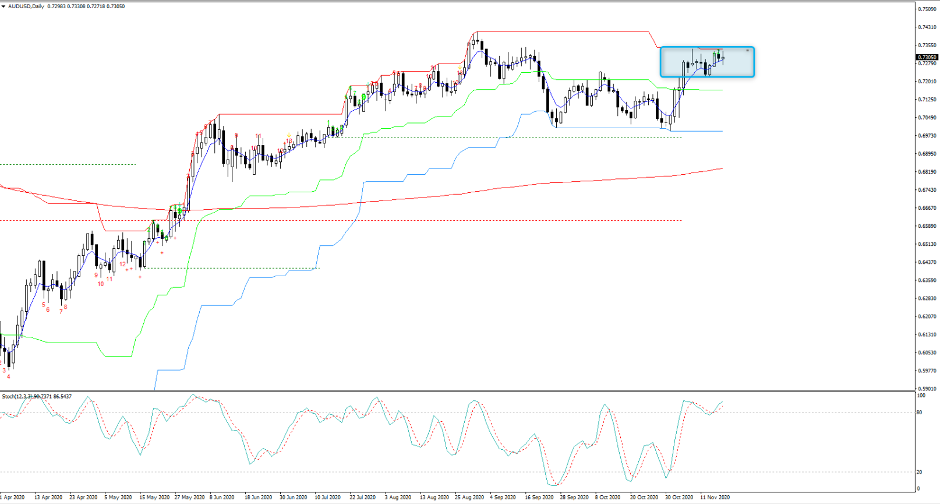
AUDUSD will get a strong look in today with Aussie October jobs out at 11:30 AEDT. Here are the consensus expectations to key off. Rallies in AUDUSD should be capped into 0.7340/50 on the day, which marries nicely with the top of its recent consolidation range. To get a close through here (on the day) we’ll likely need to see a solid beat in the jobs data, renewed selling in USDCNH, and a better tone in the Hang Seng.
AUDUSD daily
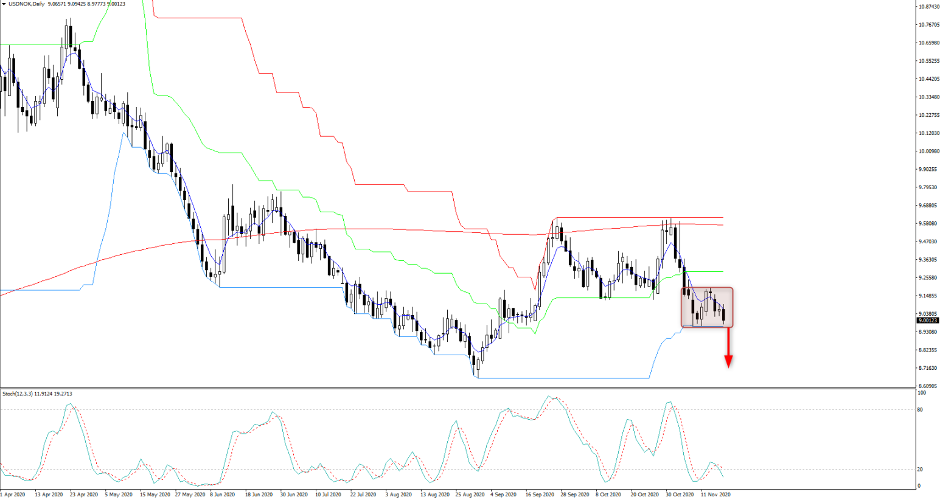
USDNOK
A move higher in Brent crude has helped the NOK outperform on the day, although with NYC starting to add restrictions to fight back at the COVID case count we question if energy may see some short-term vulnerabilities. USDNOK has broken the double top neckline at 9.1200 and technically targets the August lows and perhaps even as far as 8.63. We see the pair testing the 40-day low (blue line), where a break of this support would accelerate the downside. In the sleepy low vol backdrop for FX, USDNOK could be one for the radar.
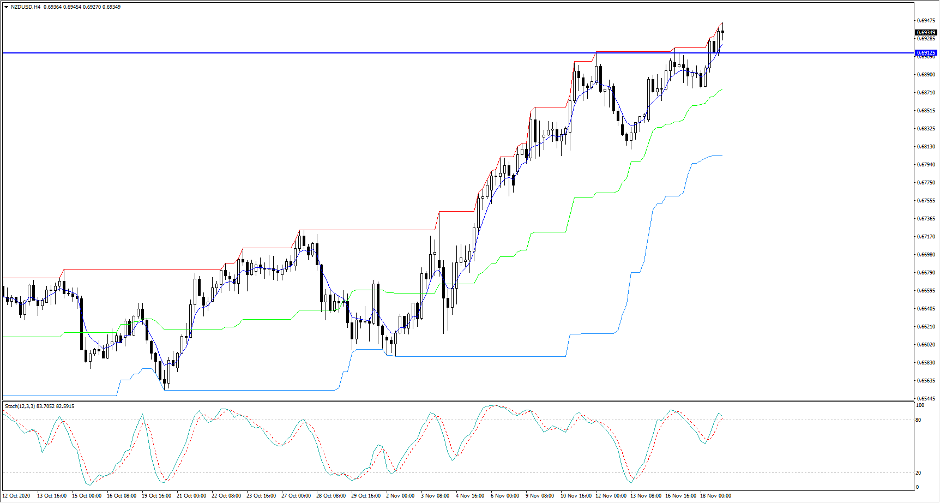
NZDUSD
The second strongest currency on the day is the NZD and the NZDUSD daily chart is a trend followers dream, but a headache for the RBNZ. Until price can close below the 5-day EMA the path of least resistance here is higher, although there will be some wood to chop to get through 0.7000 - a fate the market puts at just 14.1% probability of playing out within a week. We can take the timeframe down to the 4-hour (see below) and see the price action on the break of the double top and it looks strong. Can it now hold and build a platform with the risk of the RBNZ jawboning the currency rising? Hollow words one would think when there's limited action the bank can take to derail this trend on a lasting basis.
Copper
Small moves on the day in copper, but industrial metals stay firm and speak volumes about expected demand from China and EM. Some indecision is creeping in on the daily and should price close below the 5-day EMA then we could see a move into 310. As it stands, this is a strong trend and for those in positions I’d be keeping a close eye on USDCNH, which is key here and as the yuan is strengthening (and USD weaker) copper is finding buyers.
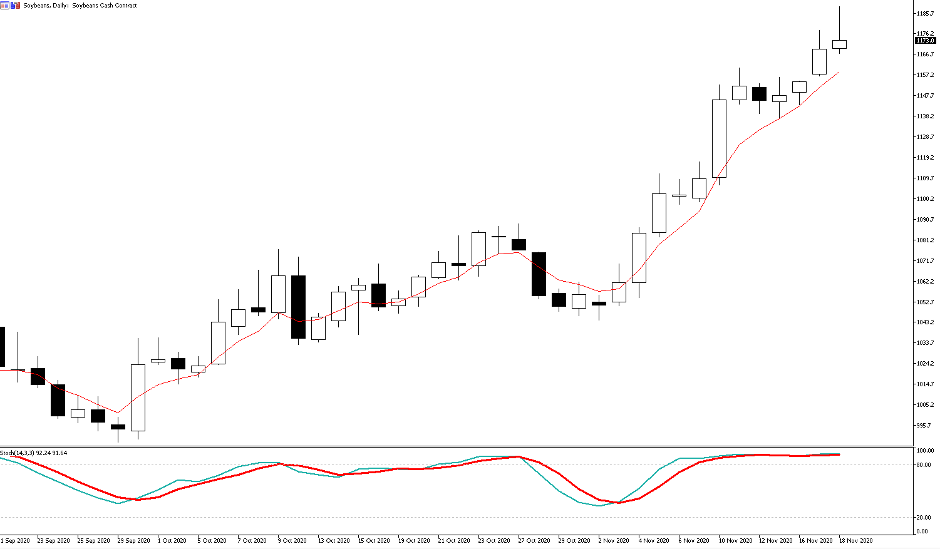
This is the same in soybeans (white) which has such a strong inverse relationship with USDCNH (blue).
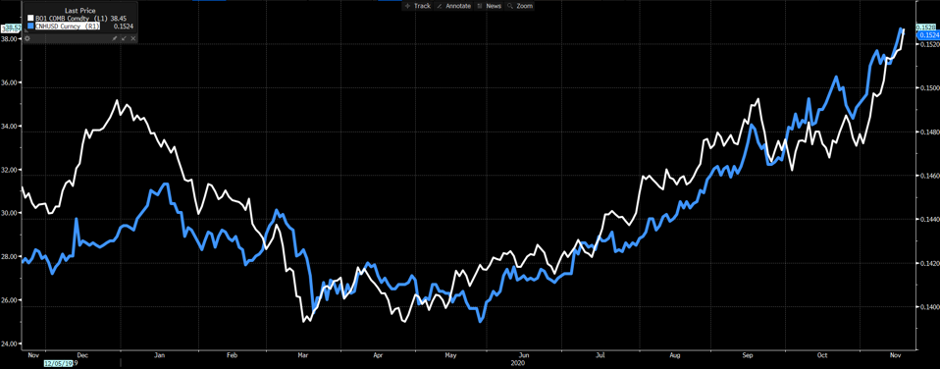
Agricultural commodities have been flying of late and the fact they are on my radar suggests this is a top. See the daily candle in soybeans, a lower low in upcoming trade could confirm we’ve seen a ST high.
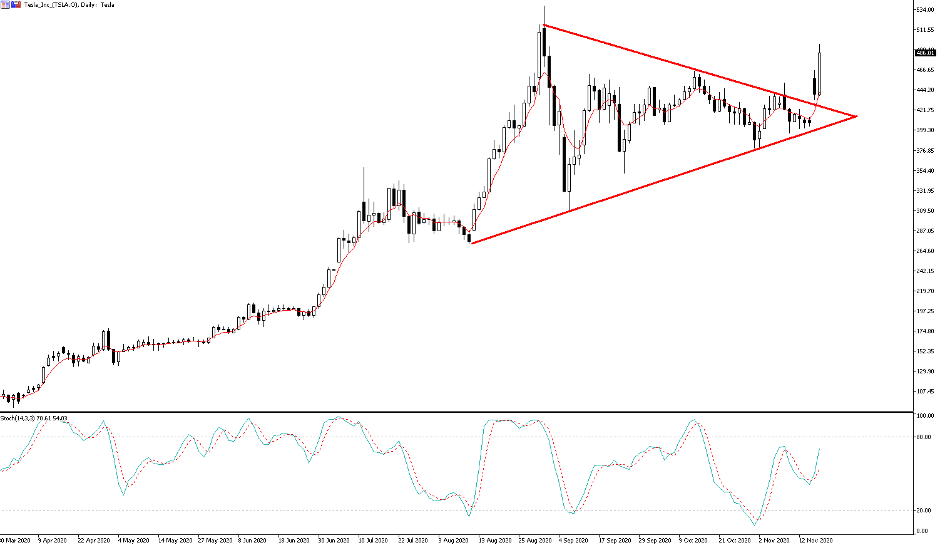
Tesla
The daily chart tells a clear picture. For those interested in Tesla joining the S&P 500 here’s a piece I wrote yesterday.


Ready to trade?
It's quick and easy to get started. Apply in minutes with our online application process.
The material provided here has not been prepared in accordance with legal requirements designed to promote the independence of investment research and as such is considered to be a marketing communication. Whilst it is not subject to any prohibition on dealing ahead of the dissemination of investment research we will not seek to take any advantage before providing it to our clients.
Pepperstone doesn’t represent that the material provided here is accurate, current or complete, and therefore shouldn’t be relied upon as such. The information, whether from a third party or not, isn’t to be considered as a recommendation; or an offer to buy or sell; or the solicitation of an offer to buy or sell any security, financial product or instrument; or to participate in any particular trading strategy. It does not take into account readers’ financial situation or investment objectives. We advise any readers of this content to seek their own advice. Without the approval of Pepperstone, reproduction or redistribution of this information isn’t permitted.