Spread bets and CFDs are complex instruments and come with a high risk of losing money rapidly due to leverage. 73.7% of retail investor accounts lose money when trading spread bets and CFDs with this provider. You should consider whether you understand how spread bets and CFDs work, and whether you can afford to take the high risk of losing your money.
- English (UK)
Bollinger Bands® offer an edge in trading - John Bollinger talks to Pepperstone

We have some great thought leaders in the world of trading and macro analysis.
The keynote is John Bollinger, who many technical focused traders will know as the creator of the well-known Bollinger Bands (BB). This is a must-watch for those looking at developing their process, adopting a more statistical framework assessing the distributions of outcomes.
Sign up is free, so just put some basic details here to get access to the live streams and recordings.
Bollinger Bands® – a great addition for all strategies
There are many range and band-based indicators traders can use on MT4, MT5, cTrader and TradingView – perhaps the three most popular are Keltner Bands, Donchian Channel, and Bollinger Bands. All can be used to establish whether price is high or low within range (on a select look-back period) and can be effective for identifying and trading reversals, range trading/mean reversion and trend-following - especially when combined with other variables such as volume, rate of change (ROC), RSI, moving averages, ATR, and Intraday Intensity (Bollinger offers guidance on this in his initial BB studies)
Personally, I have always found Bollinger Bands a great tool to use, especially for breakouts to offer increased conviction around potential trending markets – the principle in statistics to understanding distributions (in a sample) and the use of standard deviation may need some background but this is the principle for Bollinger Bands.
The idea is that in a normally distributed market 95% of price move or outcomes, are contained within two standard deviations from the mean – which typically is the 20-day moving average (MA). In a trending market these dynamics and probabilities change to one of a ‘skewed’ market.
Bollinger Bands® – trade breakouts and trend
The upper and lower bands therefore effectively show the dispersion of price moves from the 20-day MA, with 20 days being a big enough sample size to give this validity. The wider the bands the greater the moves from the price average and the tighter the bands the lower the dispersion of moves relative to the average – breakout traders look for a period tight bands or ‘squeeze’, as this can often lead to more explosive moves, something John Bollinger will touch on.
USDJPY – a basic breakout strategy – look at the BB squeeze, with price also above both EMAs
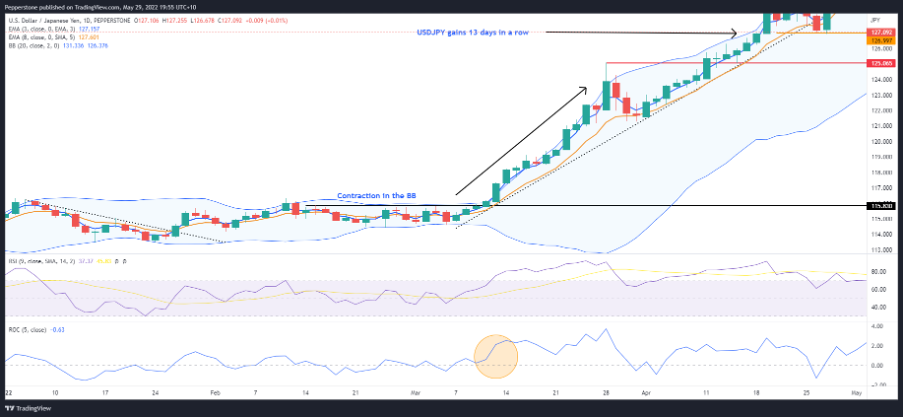
(Source: Tradingview - Past performance is not indicative of future performance.)
I’ve found that most traders have a limited understanding of the concept of distributions, but it's really how everyone should think in their trading – on any timeframe. We obviously don’t know the future, so we look at the potential outcomes and devise a probability matrix – considerations such as upcoming economic data and other known event risks, price trends, positioning and potential hedging needs all skew this distribution.
What Bollinger Bands do is offer us a visual presentation of the recent realised volatility. It offers a heightened probability for breakout and trend traders that the breakout may continue to run – especially if we can combine with volume, ATR and short-term EMAs. These variables I personally use, and I like to see post a breakout from a range, or above a prior high, that we subsequently see the price hugging the upper band and the BB width increases as price pulls away from the mean. This is where the trend traders will let it the position run and use a trailing stop or some sort of exit signal (for example, a 3 and 8 EMA crossover)
As with any breakout strategy, the BB strategy may have many false starts, but the risk/reward trade-off is often well above 2. This style of trading would have served you well in 2022, as we’ve seen some outrageous trends.
Trading reversals with Bollinger Bands®
Bollinger looks closely at reversals, and I know a lot of retail traders who would appreciate a more statistical method of selling strength and buying weakness. The absolute width of the upper-lower bands is key here – for this we use the BBW (Bollinger Band Width) accompanying tool.
Many will be familiar with divergence – perhaps using price and an oscillator, such as an RSI – it's one of the classic measures of exhaustion in a trend (bullish or bearish). In a divergence play using BB, the theory is (in a bullish reversal) we see price pushing outside the lower BB (or 2 standard deviations from the 20-day MA), followed by a lower low in a new bar), yet price in that bar fails to breach the lower BB. This is confirmed by the BB %B, which is a similar calculation as stochastic momentum, and we see a higher low.
EURUSD daily – with bullish divergence
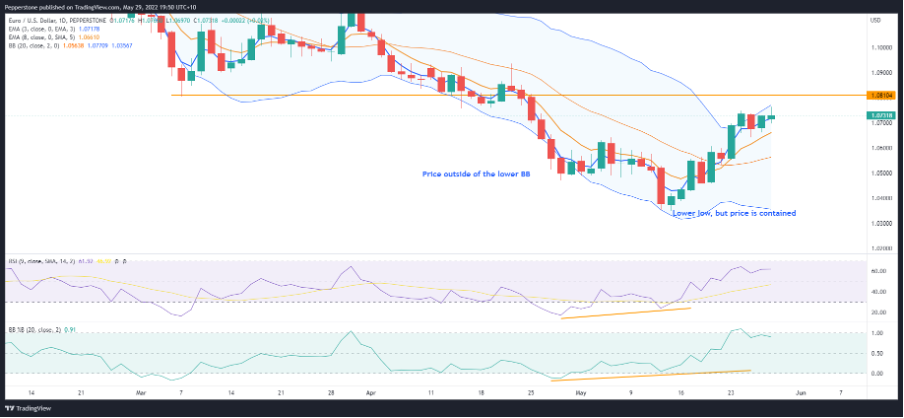
(Source: Tradingview - Past performance is not indicative of future performance.)
As we see in the EURUSD example, by adding the RSI, we can see clear bullish divergence in both the 9-day RSI and the BB %B, which played out well.
The price purest will perhaps say most of this can be seen in naked price action alone – There's truth to that, but I think this will help smooth out the process – as well as the management of risk and offer confidence of taking reversals and trends.
Sign up to hear John Bollinger offer key insights on strategy
So, whether you trade trends, reversals, or mean reversion, this talk from John Bollinger at Pepperstone Talks should offer content that perhaps you hadn’t considered before. One I am genuinely excited about being part of. Sign up here to watch the live stream or recording.
Related articles

Ready to trade?
It's quick and easy to get started. Apply in minutes with our online application process.
The material provided here has not been prepared in accordance with legal requirements designed to promote the independence of investment research and as such is considered to be a marketing communication. Whilst it is not subject to any prohibition on dealing ahead of the dissemination of investment research we will not seek to take any advantage before providing it to our clients.
Pepperstone doesn’t represent that the material provided here is accurate, current or complete, and therefore shouldn’t be relied upon as such. The information, whether from a third party or not, isn’t to be considered as a recommendation; or an offer to buy or sell; or the solicitation of an offer to buy or sell any security, financial product or instrument; or to participate in any particular trading strategy. It does not take into account readers’ financial situation or investment objectives. We advise any readers of this content to seek their own advice. Without the approval of Pepperstone, reproduction or redistribution of this information isn’t permitted.